Comprehensive Guide to Matplotlib.axis.Axis.get_label() Function in Python
Matplotlib.axis.Axis.get_label() function in Python is a powerful tool for retrieving axis labels in Matplotlib plots. This function is an essential part of the Matplotlib library, which is widely used for creating static, animated, and interactive visualizations in Python. In this comprehensive guide, we’ll explore the Matplotlib.axis.Axis.get_label() function in depth, covering its usage, parameters, return values, and practical applications. We’ll also provide numerous examples to illustrate how this function can be used in various scenarios.
Understanding the Basics of Matplotlib.axis.Axis.get_label()
The Matplotlib.axis.Axis.get_label() function is a method of the Axis class in Matplotlib. Its primary purpose is to retrieve the label object associated with an axis. This function is particularly useful when you need to access or modify the properties of an existing axis label.
Let’s start with a simple example to demonstrate how to use the Matplotlib.axis.Axis.get_label() function:
import matplotlib.pyplot as plt

# Create a simple plot
fig, ax = plt.subplots()
ax.plot([1, 2, 3, 4], [1, 4, 2, 3])

# Set the x-axis label
ax.set_xlabel('X-axis label from how2matplotlib.com')

# Get the x-axis label using get_label()
x_label = ax.xaxis.get_label()

# Print the label text
print(x_label.get_text())

plt.show()
Output:
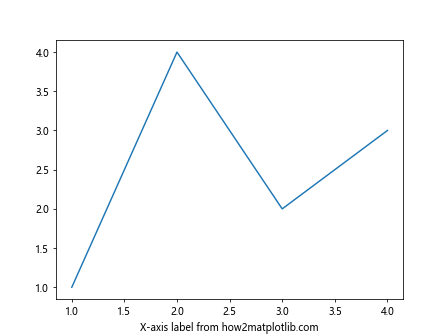
In this example, we create a simple plot, set the x-axis label, and then use the Matplotlib.axis.Axis.get_label() function to retrieve the label object. We then print the text of the label using the get_text() method.
Exploring the Parameters of Matplotlib.axis.Axis.get_label()
The Matplotlib.axis.Axis.get_label() function doesn’t take any parameters. It’s a straightforward method that returns the Text instance representing the axis label. This simplicity makes it easy to use in various contexts.
Here’s an example that demonstrates how to use Matplotlib.axis.Axis.get_label() to access both x-axis and y-axis labels:
import matplotlib.pyplot as plt

# Create a plot with labels
fig, ax = plt.subplots()
ax.plot([1, 2, 3, 4], [1, 4, 2, 3])
ax.set_xlabel('X-axis label from how2matplotlib.com')
ax.set_ylabel('Y-axis label from how2matplotlib.com')

# Get both axis labels
x_label = ax.xaxis.get_label()
y_label = ax.yaxis.get_label()

# Print the label texts
print(f"X-axis label: {x_label.get_text()}")
print(f"Y-axis label: {y_label.get_text()}")

plt.show()
Output:
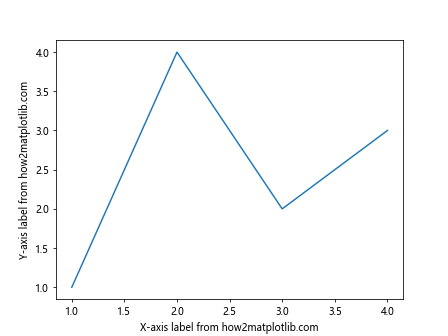
In this example, we set both x-axis and y-axis labels and then use Matplotlib.axis.Axis.get_label() to retrieve them. We then print the text of both labels.
Understanding the Return Value of Matplotlib.axis.Axis.get_label()
The Matplotlib.axis.Axis.get_label() function returns a Text instance representing the axis label. This Text object has various properties and methods that allow you to manipulate the label’s appearance and content.
Let’s explore some of the properties and methods of the Text object returned by Matplotlib.axis.Axis.get_label():
import matplotlib.pyplot as plt

# Create a plot with a label
fig, ax = plt.subplots()
ax.plot([1, 2, 3, 4], [1, 4, 2, 3])
ax.set_xlabel('X-axis label from how2matplotlib.com')

# Get the x-axis label
x_label = ax.xaxis.get_label()

# Access various properties of the label
print(f"Label text: {x_label.get_text()}")
print(f"Label color: {x_label.get_color()}")
print(f"Label font size: {x_label.get_fontsize()}")
print(f"Label position: {x_label.get_position()}")

plt.show()
Output:
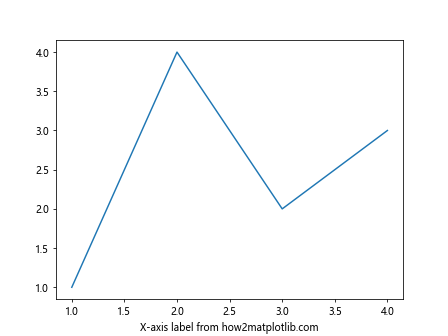
In this example, we use Matplotlib.axis.Axis.get_label() to retrieve the x-axis label and then access various properties of the Text object, such as its text, color, font size, and position.
Modifying Axis Labels Using Matplotlib.axis.Axis.get_label()
One of the powerful features of Matplotlib.axis.Axis.get_label() is that it allows you to modify existing axis labels. You can change various properties of the label, such as its text, color, font size, and more.
Here’s an example that demonstrates how to modify an axis label using Matplotlib.axis.Axis.get_label():
import matplotlib.pyplot as plt

# Create a plot with a label
fig, ax = plt.subplots()
ax.plot([1, 2, 3, 4], [1, 4, 2, 3])
ax.set_xlabel('Original label from how2matplotlib.com')

# Get the x-axis label
x_label = ax.xaxis.get_label()

# Modify the label properties
x_label.set_text('Modified label from how2matplotlib.com')
x_label.set_color('red')
x_label.set_fontsize(14)
x_label.set_fontweight('bold')

plt.show()
Output:
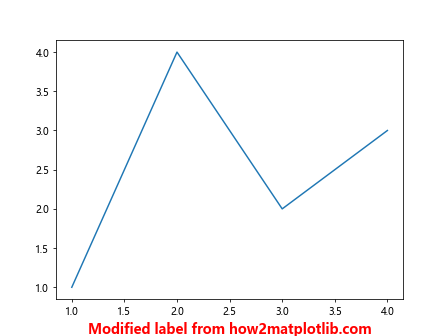
In this example, we first create a plot with an original x-axis label. We then use Matplotlib.axis.Axis.get_label() to retrieve the label object and modify its properties, including the text, color, font size, and font weight.
Using Matplotlib.axis.Axis.get_label() with Multiple Subplots
Matplotlib.axis.Axis.get_label() can be particularly useful when working with multiple subplots. It allows you to access and modify labels for individual subplots easily.
Here’s an example that demonstrates how to use Matplotlib.axis.Axis.get_label() with multiple subplots:
import matplotlib.pyplot as plt

# Create a figure with multiple subplots
fig, (ax1, ax2) = plt.subplots(1, 2, figsize=(10, 5))

# Plot data and set labels for the first subplot
ax1.plot([1, 2, 3, 4], [1, 4, 2, 3])
ax1.set_xlabel('X-axis label 1 from how2matplotlib.com')
ax1.set_ylabel('Y-axis label 1 from how2matplotlib.com')

# Plot data and set labels for the second subplot
ax2.plot([1, 2, 3, 4], [3, 2, 4, 1])
ax2.set_xlabel('X-axis label 2 from how2matplotlib.com')
ax2.set_ylabel('Y-axis label 2 from how2matplotlib.com')

# Get and modify labels for both subplots
for ax in (ax1, ax2):
    x_label = ax.xaxis.get_label()
    y_label = ax.yaxis.get_label()

    x_label.set_color('red')
    y_label.set_color('blue')

    x_label.set_fontsize(12)
    y_label.set_fontsize(12)

plt.tight_layout()
plt.show()
Output:
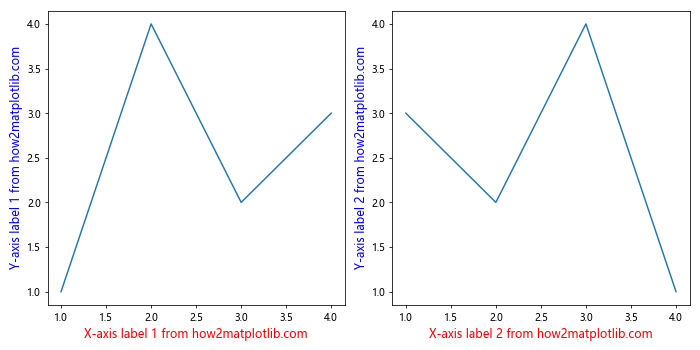
In this example, we create two subplots and set labels for each. We then use Matplotlib.axis.Axis.get_label() in a loop to access and modify the labels for both subplots, changing their colors and font sizes.
Combining Matplotlib.axis.Axis.get_label() with Other Matplotlib Functions
Matplotlib.axis.Axis.get_label() can be effectively combined with other Matplotlib functions to create more complex and customized plots. Let’s explore some examples of how to do this.
Using get_label() with tick_params()
You can use Matplotlib.axis.Axis.get_label() in conjunction with tick_params() to create a consistent style for both axis labels and tick labels:
import matplotlib.pyplot as plt

# Create a plot
fig, ax = plt.subplots()
ax.plot([1, 2, 3, 4], [1, 4, 2, 3])

# Set initial labels
ax.set_xlabel('X-axis label from how2matplotlib.com')
ax.set_ylabel('Y-axis label from how2matplotlib.com')

# Get the labels
x_label = ax.xaxis.get_label()
y_label = ax.yaxis.get_label()

# Set label properties
label_color = 'navy'
label_size = 12

x_label.set_color(label_color)
y_label.set_color(label_color)
x_label.set_fontsize(label_size)
y_label.set_fontsize(label_size)

# Set tick label properties to match
ax.tick_params(axis='both', colors=label_color, labelsize=label_size)

plt.show()
Output:
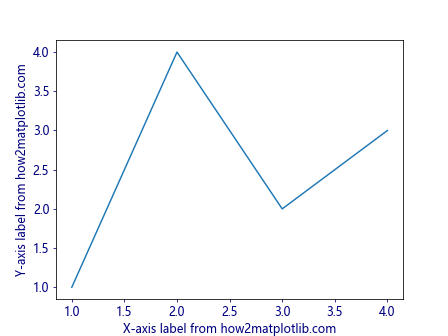
In this example, we use Matplotlib.axis.Axis.get_label() to access the axis labels and set their color and font size. We then use tick_params() to apply the same styling to the tick labels, creating a consistent look for all text elements on the axes.
Advanced Techniques with Matplotlib.axis.Axis.get_label()
Let’s explore some more advanced techniques using Matplotlib.axis.Axis.get_label().
Animating Axis Labels
You can use Matplotlib.axis.Axis.get_label() in animations to dynamically update axis labels:
import matplotlib.pyplot as plt
import matplotlib.animation as animation

# Create a figure and axis
fig, ax = plt.subplots()

# Initialize the plot
line, = ax.plot([], [])
ax.set_xlim(0, 10)
ax.set_ylim(0, 10)

# Set initial labels
ax.set_xlabel('X-axis label from how2matplotlib.com')
ax.set_ylabel('Y-axis label from how2matplotlib.com')

# Animation function
def animate(frame):
    x = list(range(frame + 1))
    y = [i**2 for i in x]
    line.set_data(x, y)

    # Update x-axis label
    x_label = ax.xaxis.get_label()
    x_label.set_text(f'Frame {frame} from how2matplotlib.com')

    return line, x_label

# Create the animation
anim = animation.FuncAnimation(fig, animate, frames=10, interval=500, blit=True)

plt.show()
Output:
In this example, we create an animation where the x-axis label is updated in each frame using Matplotlib.axis.Axis.get_label().
Using get_label() with Custom Transforms
You can use Matplotlib.axis.Axis.get_label() along with custom transforms to position labels in unique ways:
import matplotlib.pyplot as plt
import matplotlib.transforms as transforms

# Create a plot
fig, ax = plt.subplots()
ax.plot([1, 2, 3, 4], [1, 4, 2, 3])

# Set initial labels
ax.set_xlabel('X-axis label from how2matplotlib.com')
ax.set_ylabel('Y-axis label from how2matplotlib.com')

# Get the labels
x_label = ax.xaxis.get_label()
y_label = ax.yaxis.get_label()

# Create custom transforms
x_transform = transforms.blended_transform_factory(ax.transAxes, ax.transAxes)
y_transform = transforms.blended_transform_factory(ax.transAxes, ax.transAxes)

# Apply custom positions using the transforms
x_label.set_transform(x_transform)
y_label.set_transform(y_transform)

x_label.set_position((0.5, -0.1))  # Center, below the axis
y_label.set_position((-0.1, 0.5))  # Left of the axis, centered vertically

plt.show()
Output:
In this example, we use Matplotlib.axis.Axis.get_label() to access the axis labels and then apply custom transforms to position them in unique locations relative to the axes.
Common Pitfalls and How to Avoid Them
When working with Matplotlib.axis.Axis.get_label(), there are some common pitfalls that you should be aware of:
- Forgetting to update the plot: After modifying a label using get_label(), remember to call plt.draw() or plt.show() to update the plot and see the changes.
Confusing axis instances: When working with multiple subplots or axes, make sure you’re calling get_label() on the correct axis instance.
Overwriting existing label properties: Be cautious when setting properties of a label object. Some methods may overwrite existing properties.
Ignoring the returned object: Remember that get_label() returns a Text object. Don’t ignore this return value if you plan to modify the label.
Here’s an example that demonstrates how to avoid these pitfalls: