Comprehensive Guide to Matplotlib.axis.Axis.get_minor_ticks() Function in Python
Matplotlib.axis.Axis.get_minor_ticks() function in Python is an essential tool for customizing and retrieving minor tick information in Matplotlib plots. This function allows developers to access and manipulate minor ticks on both x and y axes, providing greater control over the visual representation of data. In this comprehensive guide, we’ll explore the Matplotlib.axis.Axis.get_minor_ticks() function in depth, covering its usage, parameters, return values, and practical applications in various plotting scenarios.
Understanding the Matplotlib.axis.Axis.get_minor_ticks() Function
The Matplotlib.axis.Axis.get_minor_ticks() function is a method of the Axis class in Matplotlib. It is used to retrieve a list of minor tick objects associated with a specific axis. These minor ticks are smaller marks between the major ticks on an axis, providing additional granularity to the scale.
Let’s start with a simple example to demonstrate the basic usage of the Matplotlib.axis.Axis.get_minor_ticks() function:
import matplotlib.pyplot as plt
import numpy as np

# Create a simple plot
fig, ax = plt.subplots()
x = np.linspace(0, 10, 100)
ax.plot(x, np.sin(x))

# Get minor ticks on the x-axis
minor_ticks = ax.xaxis.get_minor_ticks()

# Print the number of minor ticks
print(f"Number of minor ticks on x-axis: {len(minor_ticks)}")

plt.title("How to use get_minor_ticks() - how2matplotlib.com")
plt.show()
Output:
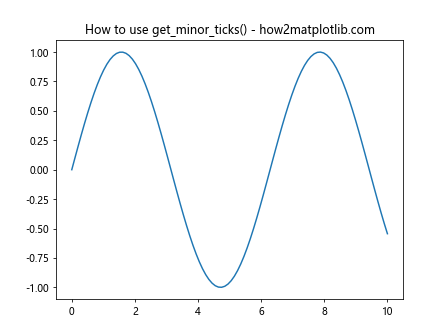
In this example, we create a simple sine wave plot and use the Matplotlib.axis.Axis.get_minor_ticks() function to retrieve the minor ticks on the x-axis. The function returns a list of minor tick objects, which we can then manipulate or analyze as needed.
Parameters of Matplotlib.axis.Axis.get_minor_ticks()
The Matplotlib.axis.Axis.get_minor_ticks() function doesn’t accept any parameters. It simply returns the list of minor tick objects associated with the axis on which it is called. This simplicity makes it easy to use and integrate into various plotting workflows.
Return Value of Matplotlib.axis.Axis.get_minor_ticks()
When you call the Matplotlib.axis.Axis.get_minor_ticks() function, it returns a list of Tick objects. Each Tick object represents a minor tick on the axis and contains information about its position, label, and other properties.
Customizing Minor Ticks with Matplotlib.axis.Axis.get_minor_ticks()
One of the primary use cases for the Matplotlib.axis.Axis.get_minor_ticks() function is to customize the appearance of minor ticks. You can modify various properties of the minor ticks, such as their size, color, and visibility.
Here’s an example that demonstrates how to customize minor ticks:
import matplotlib.pyplot as plt
import numpy as np

fig, ax = plt.subplots()
x = np.linspace(0, 10, 100)
ax.plot(x, np.sin(x))

# Get minor ticks and customize them
minor_ticks = ax.xaxis.get_minor_ticks()
for tick in minor_ticks:
    tick.tick1line.set_markersize(15)
    tick.tick1line.set_color('red')
    tick.label1.set_fontsize(8)

plt.title("Customizing minor ticks - how2matplotlib.com")
plt.show()
Output:
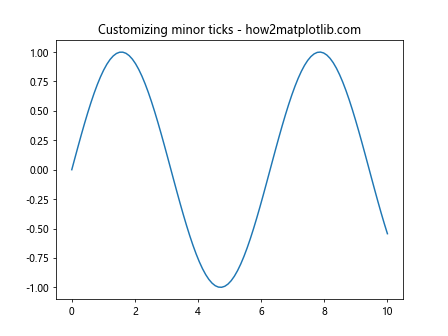
In this example, we iterate through the minor ticks returned by Matplotlib.axis.Axis.get_minor_ticks() and modify their size, color, and font size. This level of customization allows you to create visually appealing and informative plots tailored to your specific needs.
Using Matplotlib.axis.Axis.get_minor_ticks() with Different Plot Types
The Matplotlib.axis.Axis.get_minor_ticks() function can be used with various types of plots in Matplotlib. Let’s explore how to use it with different plot types and customize the minor ticks accordingly.
Bar Plots
import matplotlib.pyplot as plt
import numpy as np

fig, ax = plt.subplots()
x = ['A', 'B', 'C', 'D']
y = [3, 7, 2, 5]
ax.bar(x, y)

# Customize minor ticks on y-axis
minor_ticks = ax.yaxis.get_minor_ticks()
for tick in minor_ticks:
    tick.tick2line.set_markersize(5)
    tick.tick2line.set_color('green')

plt.title("Bar plot with customized minor ticks - how2matplotlib.com")
plt.show()
Output:
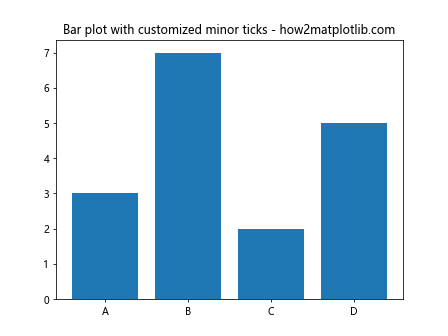
In this example, we create a bar plot and customize the minor ticks on the y-axis using the Matplotlib.axis.Axis.get_minor_ticks() function. This can be particularly useful for emphasizing specific value ranges in bar charts.
Scatter Plots
import matplotlib.pyplot as plt
import numpy as np

fig, ax = plt.subplots()
x = np.random.rand(50)
y = np.random.rand(50)
ax.scatter(x, y)

# Customize minor ticks on both axes
for axis in [ax.xaxis, ax.yaxis]:
    minor_ticks = axis.get_minor_ticks()
    for tick in minor_ticks:
        tick.tick1line.set_markersize(3)
        tick.tick1line.set_color('purple')

plt.title("Scatter plot with customized minor ticks - how2matplotlib.com")
plt.show()
Output:
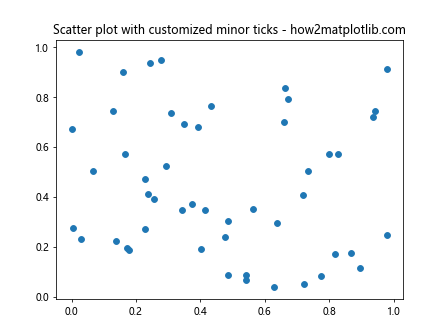
This example demonstrates how to use Matplotlib.axis.Axis.get_minor_ticks() to customize minor ticks on both x and y axes in a scatter plot. This can help improve the readability of the plot, especially when dealing with data points spread across a wide range.
Advanced Applications of Matplotlib.axis.Axis.get_minor_ticks()
The Matplotlib.axis.Axis.get_minor_ticks() function can be used in more advanced scenarios to create highly customized and informative plots. Let’s explore some of these applications.
Creating Custom Tick Formatters
You can use the Matplotlib.axis.Axis.get_minor_ticks() function in combination with custom tick formatters to create unique axis labels:
import matplotlib.pyplot as plt
import numpy as np

fig, ax = plt.subplots()
x = np.linspace(0, 10, 100)
ax.plot(x, np.sin(x))

def custom_formatter(x, pos):
    return f"[{x:.1f}]"

ax.xaxis.set_minor_formatter(plt.FuncFormatter(custom_formatter))

minor_ticks = ax.xaxis.get_minor_ticks()
for tick in minor_ticks:
    tick.label1.set_fontsize(8)
    tick.label1.set_rotation(45)

plt.title("Custom minor tick formatter - how2matplotlib.com")
plt.show()
Output:
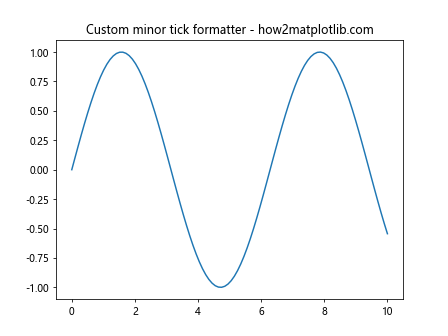
In this example, we define a custom formatter function and apply it to the minor ticks using set_minor_formatter(). We then use Matplotlib.axis.Axis.get_minor_ticks() to further customize the appearance of the minor tick labels.
Selectively Showing Minor Ticks
You can use the Matplotlib.axis.Axis.get_minor_ticks() function to selectively show or hide minor ticks based on certain conditions:
import matplotlib.pyplot as plt
import numpy as np

fig, ax = plt.subplots()
x = np.linspace(0, 10, 100)
ax.plot(x, np.sin(x))

minor_ticks = ax.xaxis.get_minor_ticks()
for i, tick in enumerate(minor_ticks):
    if i % 2 == 0:
        tick.set_visible(False)
    else:
        tick.label1.set_fontsize(8)
        tick.label1.set_color('red')

plt.title("Selectively showing minor ticks - how2matplotlib.com")
plt.show()
Output:
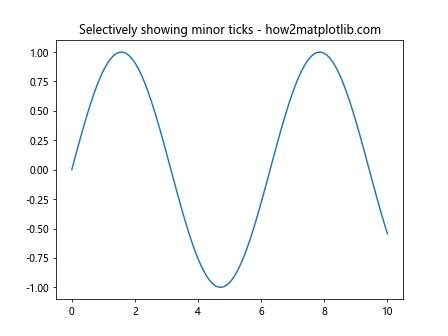
This example demonstrates how to use Matplotlib.axis.Axis.get_minor_ticks() to show only every other minor tick and customize their appearance. This technique can be useful for reducing clutter on axes with many minor ticks.
Combining Matplotlib.axis.Axis.get_minor_ticks() with Other Matplotlib Functions
The Matplotlib.axis.Axis.get_minor_ticks() function can be effectively combined with other Matplotlib functions to create more complex and informative visualizations. Let’s explore some of these combinations.
Using get_minor_ticks() with GridSpec
You can use Matplotlib.axis.Axis.get_minor_ticks() in conjunction with GridSpec to create multi-panel plots with customized minor ticks:
import matplotlib.pyplot as plt
import numpy as np

fig = plt.figure(figsize=(12, 8))
gs = fig.add_gridspec(2, 2)

ax1 = fig.add_subplot(gs[0, 0])
ax2 = fig.add_subplot(gs[0, 1])
ax3 = fig.add_subplot(gs[1, :])

x = np.linspace(0, 10, 100)

ax1.plot(x, np.sin(x))
ax2.plot(x, np.cos(x))
ax3.plot(x, np.tan(x))

for ax in [ax1, ax2, ax3]:
    minor_ticks = ax.xaxis.get_minor_ticks()
    for tick in minor_ticks:
        tick.tick1line.set_markersize(3)
        tick.tick1line.set_color('green')

plt.suptitle("Multi-panel plot with customized minor ticks - how2matplotlib.com")
plt.tight_layout()
plt.show()
Output:
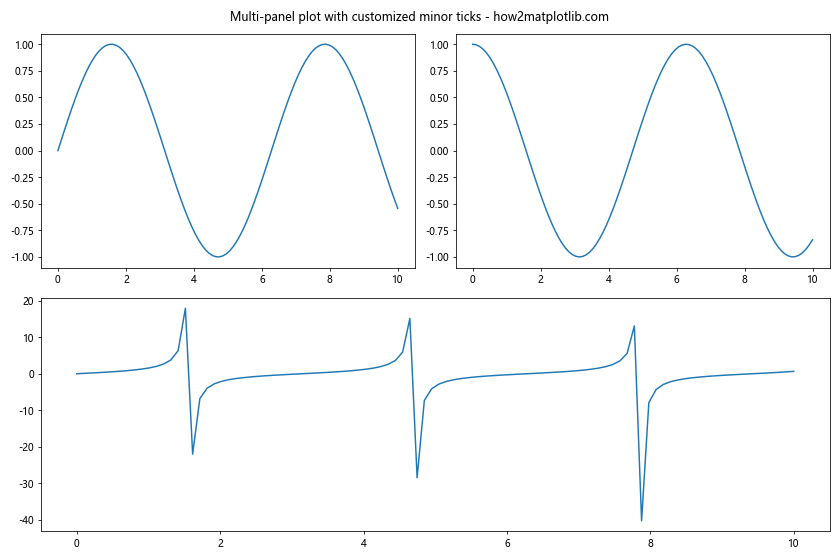
This example demonstrates how to create a multi-panel plot using GridSpec and customize the minor ticks on each subplot using Matplotlib.axis.Axis.get_minor_ticks().
Combining get_minor_ticks() with Colorbar
You can also use Matplotlib.axis.Axis.get_minor_ticks() to customize the minor ticks on a colorbar:
import matplotlib.pyplot as plt
import numpy as np

fig, ax = plt.subplots()
data = np.random.rand(10, 10)
im = ax.imshow(data, cmap='viridis')

cbar = plt.colorbar(im)
minor_ticks = cbar.ax.yaxis.get_minor_ticks()
for tick in minor_ticks:
    tick.tick2line.set_color('red')
    tick.tick2line.set_markersize(5)

plt.title("Customized colorbar minor ticks - how2matplotlib.com")
plt.show()
Output:
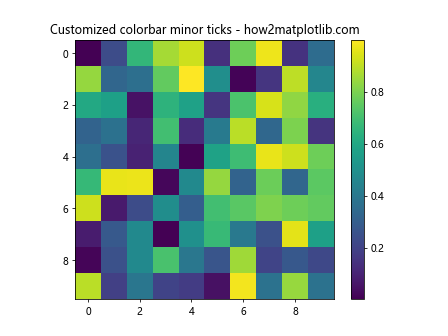
This example shows how to use Matplotlib.axis.Axis.get_minor_ticks() to customize the minor ticks on a colorbar associated with an image plot.
Best Practices for Using Matplotlib.axis.Axis.get_minor_ticks()
When working with the Matplotlib.axis.Axis.get_minor_ticks() function, it’s important to follow some best practices to ensure your plots are both visually appealing and informative. Here are some tips to keep in mind:
- Use minor ticks judiciously: While minor ticks can provide additional detail, too many can clutter your plot. Use them when they add value to the visualization.
Maintain consistency: If you’re customizing minor ticks, try to maintain a consistent style across all axes and subplots in your figure.
Consider color contrast: When changing the color of minor ticks, ensure there’s enough contrast with the background and other plot elements for good visibility.
Test different scales: The behavior of minor ticks can change with different axis scales (linear, log, symlog). Always test your customizations with the intended scale.
Be mindful of performance: If you’re working with very large datasets or creating many plots, manipulating individual minor ticks might impact performance. In such cases, consider using style sheets or rcParams for global customizations.
Let’s see an example that incorporates some of these best practices: