Comprehensive Guide to Matplotlib.axis.Axis.get_minpos() Function in Python
Matplotlib.axis.Axis.get_minpos() function in Python is an essential tool for data visualization enthusiasts and professionals alike. This function, part of the powerful Matplotlib library, allows users to retrieve the minimum positive value on an axis. In this comprehensive guide, we’ll explore the Matplotlib.axis.Axis.get_minpos() function in depth, providing numerous examples and explanations to help you master its usage.
Understanding the Basics of Matplotlib.axis.Axis.get_minpos()
The Matplotlib.axis.Axis.get_minpos() function is a method of the Axis class in Matplotlib. Its primary purpose is to return the minimum positive value on the axis. This can be particularly useful when dealing with logarithmic scales or when you need to determine the smallest non-zero value in your dataset.
Let’s start with a simple example to illustrate how to use the Matplotlib.axis.Axis.get_minpos() function:
import matplotlib.pyplot as plt
import numpy as np

# Create some sample data
x = np.linspace(0, 10, 100)
y = np.sin(x)

# Create a figure and axis
fig, ax = plt.subplots()

# Plot the data
ax.plot(x, y, label='how2matplotlib.com')

# Get the minimum positive value on the y-axis
min_pos = ax.yaxis.get_minpos()

print(f"Minimum positive value on y-axis: {min_pos}")

plt.legend()
plt.show()
Output:
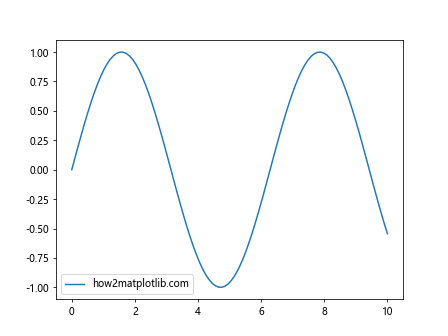
In this example, we create a simple sine wave plot and use the Matplotlib.axis.Axis.get_minpos() function to find the minimum positive value on the y-axis. The function is called on the yaxis object of the Axis instance.
Exploring the Functionality of Matplotlib.axis.Axis.get_minpos()
The Matplotlib.axis.Axis.get_minpos() function doesn’t take any arguments. It simply returns the minimum positive value on the axis. This value is determined based on the current view limits of the axis and the data plotted on it.
Let’s look at another example to better understand how the Matplotlib.axis.Axis.get_minpos() function behaves with different types of data:
import matplotlib.pyplot as plt
import numpy as np

# Create some sample data with both positive and negative values
x = np.linspace(-5, 5, 100)
y = x**2 - 4

# Create a figure and axis
fig, ax = plt.subplots()

# Plot the data
ax.plot(x, y, label='how2matplotlib.com')

# Get the minimum positive value on both axes
x_min_pos = ax.xaxis.get_minpos()
y_min_pos = ax.yaxis.get_minpos()

print(f"Minimum positive value on x-axis: {x_min_pos}")
print(f"Minimum positive value on y-axis: {y_min_pos}")

plt.legend()
plt.show()
Output:
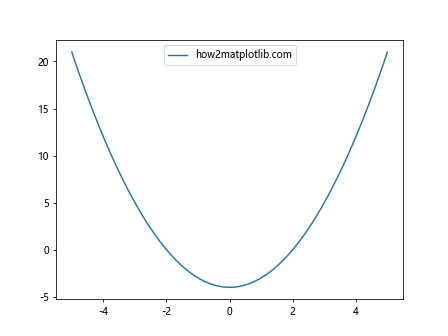
In this example, we plot a parabola that crosses the x-axis. The Matplotlib.axis.Axis.get_minpos() function is called on both the x-axis and y-axis to demonstrate how it handles different value ranges.
Practical Applications of Matplotlib.axis.Axis.get_minpos()
The Matplotlib.axis.Axis.get_minpos() function can be particularly useful in various scenarios. Let’s explore some practical applications:
1. Setting Appropriate Axis Limits
One common use case for the Matplotlib.axis.Axis.get_minpos() function is to set appropriate axis limits, especially when dealing with logarithmic scales. Here’s an example:
import matplotlib.pyplot as plt
import numpy as np

# Create some sample data
x = np.logspace(-2, 2, 100)
y = np.exp(x)

# Create a figure and axis
fig, ax = plt.subplots()

# Plot the data with a logarithmic y-scale
ax.semilogy(x, y, label='how2matplotlib.com')

# Get the minimum positive value on the y-axis
y_min_pos = ax.yaxis.get_minpos()

# Set the y-axis limit to start from the minimum positive value
ax.set_ylim(bottom=y_min_pos)

plt.legend()
plt.title('Using get_minpos() to Set Y-axis Limit')
plt.show()
Output:
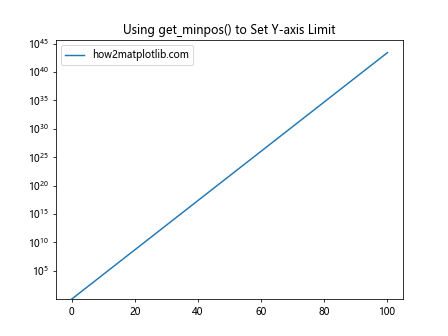
In this example, we use a logarithmic scale for the y-axis. The Matplotlib.axis.Axis.get_minpos() function helps us set the lower limit of the y-axis to the smallest positive value, ensuring that all data points are visible.
2. Data Analysis and Filtering
The Matplotlib.axis.Axis.get_minpos() function can also be useful in data analysis tasks, such as filtering out small values. Here’s an example:
import matplotlib.pyplot as plt
import numpy as np

# Create some sample data with small and large values
x = np.linspace(0, 10, 100)
y = np.exp(-x) + 0.1 * np.random.randn(100)

# Create a figure and axis
fig, ax = plt.subplots()

# Plot the original data
ax.plot(x, y, label='Original Data (how2matplotlib.com)')

# Get the minimum positive value on the y-axis
y_min_pos = ax.yaxis.get_minpos()

# Filter out values smaller than the minimum positive value
y_filtered = np.where(y > y_min_pos, y, np.nan)

# Plot the filtered data
ax.plot(x, y_filtered, label='Filtered Data (how2matplotlib.com)')

plt.legend()
plt.title('Data Filtering Using get_minpos()')
plt.show()
Output:
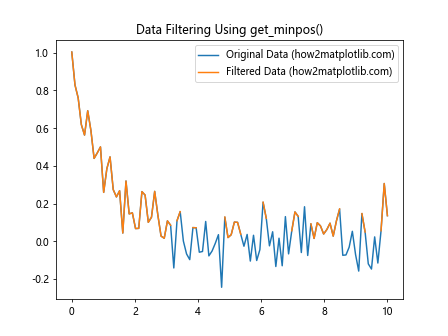
In this example, we use the Matplotlib.axis.Axis.get_minpos() function to determine a threshold for filtering out small values in our dataset. Values below this threshold are replaced with NaN, effectively removing them from the plot.
Advanced Usage of Matplotlib.axis.Axis.get_minpos()
While the basic usage of Matplotlib.axis.Axis.get_minpos() is straightforward, there are some advanced techniques and considerations to keep in mind:
1. Handling Multiple Subplots
When working with multiple subplots, you might want to use Matplotlib.axis.Axis.get_minpos() to ensure consistency across all plots. Here’s an example:
import matplotlib.pyplot as plt
import numpy as np

# Create some sample data
x1 = np.linspace(0, 10, 100)
y1 = np.sin(x1)
x2 = np.linspace(0, 5, 50)
y2 = np.cos(x2)

# Create a figure with two subplots
fig, (ax1, ax2) = plt.subplots(1, 2, figsize=(12, 5))

# Plot data on both subplots
ax1.plot(x1, y1, label='Sin (how2matplotlib.com)')
ax2.plot(x2, y2, label='Cos (how2matplotlib.com)')

# Get the minimum positive value on y-axis for both subplots
y_min_pos1 = ax1.yaxis.get_minpos()
y_min_pos2 = ax2.yaxis.get_minpos()

# Set the same y-axis limits for both subplots
y_min = min(y_min_pos1, y_min_pos2)
ax1.set_ylim(bottom=y_min)
ax2.set_ylim(bottom=y_min)

ax1.legend()
ax2.legend()
plt.suptitle('Consistent Y-axis Limits Using get_minpos()')
plt.show()
Output:
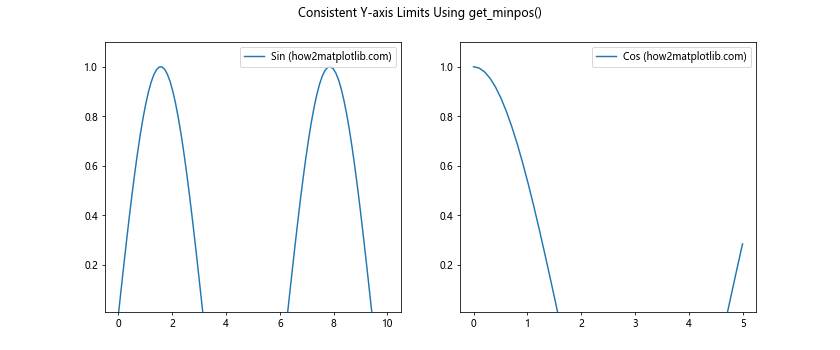
In this example, we use Matplotlib.axis.Axis.get_minpos() to find the minimum positive value on the y-axis for both subplots and then set the same lower limit for both, ensuring visual consistency.
2. Combining with Other Axis Methods
The Matplotlib.axis.Axis.get_minpos() function can be used in combination with other axis methods to achieve more complex visualizations. Here’s an example that combines get_minpos() with set_yscale():
import matplotlib.pyplot as plt
import numpy as np

# Create some sample data
x = np.linspace(0, 10, 100)
y = np.exp(x)

# Create a figure and axis
fig, ax = plt.subplots()

# Plot the data
ax.plot(x, y, label='how2matplotlib.com')

# Set logarithmic scale for y-axis
ax.set_yscale('log')

# Get the minimum positive value on the y-axis
y_min_pos = ax.yaxis.get_minpos()

# Set the y-axis limit to start from half of the minimum positive value
ax.set_ylim(bottom=y_min_pos / 2)

plt.legend()
plt.title('Logarithmic Scale with Custom Lower Limit')
plt.show()
Output:
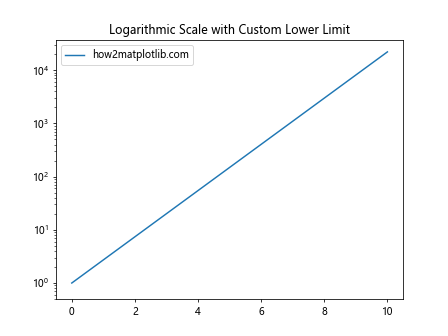
In this example, we set a logarithmic scale for the y-axis and then use Matplotlib.axis.Axis.get_minpos() to set a custom lower limit that’s half of the minimum positive value.
Common Pitfalls and How to Avoid Them
While using the Matplotlib.axis.Axis.get_minpos() function, there are some common pitfalls that you should be aware of:
1. Empty or All-Negative Data
If your dataset is empty or contains only negative values, the Matplotlib.axis.Axis.get_minpos() function might not behave as expected. Here’s an example of how to handle this:
import matplotlib.pyplot as plt
import numpy as np

# Create some sample data with only negative values
x = np.linspace(-10, -1, 100)
y = -x**2

# Create a figure and axis
fig, ax = plt.subplots()

# Plot the data
ax.plot(x, y, label='how2matplotlib.com')

# Try to get the minimum positive value on the y-axis
y_min_pos = ax.yaxis.get_minpos()

if y_min_pos > 0:
    print(f"Minimum positive value on y-axis: {y_min_pos}")
else:
    print("No positive values on y-axis")
    # Set a default positive limit
    ax.set_ylim(bottom=0.1)

plt.legend()
plt.title('Handling All-Negative Data')
plt.show()
Output:
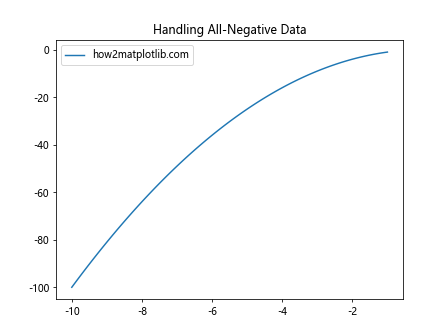
In this example, we check if the value returned by Matplotlib.axis.Axis.get_minpos() is positive. If it’s not, we set a default positive limit for the y-axis.
2. Very Small Positive Values
When dealing with very small positive values, the Matplotlib.axis.Axis.get_minpos() function might return a value that’s too small to be practical. Here’s how you can handle this:
import matplotlib.pyplot as plt
import numpy as np

# Create some sample data with very small positive values
x = np.linspace(0, 1, 100)
y = 1e-10 * np.exp(x)

# Create a figure and axis
fig, ax = plt.subplots()

# Plot the data
ax.plot(x, y, label='how2matplotlib.com')

# Get the minimum positive value on the y-axis
y_min_pos = ax.yaxis.get_minpos()

# If the minimum positive value is very small, set a more practical limit
if y_min_pos < 1e-8:
    ax.set_ylim(bottom=1e-8)
else:
    ax.set_ylim(bottom=y_min_pos)

plt.legend()
plt.title('Handling Very Small Positive Values')
plt.show()
Output:
In this example, we check if the value returned by Matplotlib.axis.Axis.get_minpos() is below a certain threshold. If it is, we set a more practical lower limit for the y-axis.
Best Practices for Using Matplotlib.axis.Axis.get_minpos()
To make the most of the Matplotlib.axis.Axis.get_minpos() function, consider the following best practices:
- Always check for edge cases: As we've seen, empty datasets or datasets with only negative values can cause issues. Always include checks to handle these cases.
Combine with other methods: The Matplotlib.axis.Axis.get_minpos() function is most powerful when combined with other Matplotlib methods like set_ylim() or set_yscale().
Use for data analysis: Beyond just setting axis limits, consider using Matplotlib.axis.Axis.get_minpos() for data analysis tasks like filtering or thresholding.
Consider the scale: The function behaves differently on linear and logarithmic scales. Make sure to set the scale before calling get_minpos() if you're using a non-linear scale.
Be mindful of very small values: When dealing with very small positive values, you might need to set a more practical lower limit than what get_minpos() returns.
Here's an example that incorporates these best practices: