Exploring 3D Visualization with Matplotlib plot_surface
Matplotlib plot_surface is a powerful tool for creating three-dimensional surface plots in Python. This function, part of the mplot3d toolkit in Matplotlib, allows users to visualize complex 3D data with ease and flexibility. In this comprehensive guide, we’ll delve deep into the capabilities of plot_surface, exploring its various features, parameters, and applications through detailed explanations and numerous code examples.
Understanding the Basics of Matplotlib plot_surface
At its core, plot_surface is used to create a surface plot from 3D data. It takes three 2D arrays as input: X, Y, and Z. The X and Y arrays define the grid of points on which the surface is plotted, while the Z array provides the height values for each point on this grid.
Let’s start with a basic example to illustrate how plot_surface works:
import numpy as np
import matplotlib.pyplot as plt
from mpl_toolkits.mplot3d import Axes3D

# Create data
X = np.arange(-5, 5, 0.25)
Y = np.arange(-5, 5, 0.25)
X, Y = np.meshgrid(X, Y)
Z = np.sin(np.sqrt(X**2 + Y**2))

# Create figure and 3D axis
fig = plt.figure(figsize=(10, 8))
ax = fig.add_subplot(111, projection='3d')

# Plot the surface
surf = ax.plot_surface(X, Y, Z)

# Set labels and title
ax.set_xlabel('X-axis')
ax.set_ylabel('Y-axis')
ax.set_zlabel('Z-axis')
ax.set_title('Basic Surface Plot - how2matplotlib.com')

# Show the plot
plt.show()
Output:
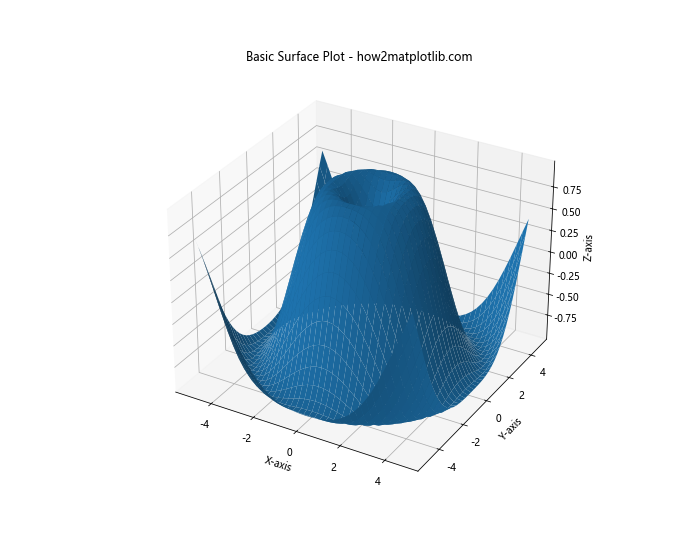
In this example, we first create our data using NumPy. We define X and Y as 1D arrays and then use np.meshgrid to create 2D coordinate arrays. The Z array is calculated as a function of X and Y. We then create a figure and a 3D axis, and use plot_surface to create the surface plot. Finally, we set labels and a title, and display the plot.
Customizing Colors in Matplotlib plot_surface
One of the most powerful features of plot_surface is its ability to represent data not just through height, but also through color. This allows us to convey even more information in a single plot.
Using a Colormap
We can apply a colormap to our surface plot to represent the Z values with different colors:
import numpy as np
import matplotlib.pyplot as plt
from mpl_toolkits.mplot3d import Axes3D

# Create data
X = np.arange(-5, 5, 0.25)
Y = np.arange(-5, 5, 0.25)
X, Y = np.meshgrid(X, Y)
Z = np.sin(np.sqrt(X**2 + Y**2))

# Create figure and 3D axis
fig = plt.figure(figsize=(10, 8))
ax = fig.add_subplot(111, projection='3d')

# Plot the surface with a colormap
surf = ax.plot_surface(X, Y, Z, cmap='viridis')

# Add a color bar
fig.colorbar(surf, shrink=0.5, aspect=5)

# Set labels and title
ax.set_xlabel('X-axis')
ax.set_ylabel('Y-axis')
ax.set_zlabel('Z-axis')
ax.set_title('Surface Plot with Colormap - how2matplotlib.com')

# Show the plot
plt.show()
Output:
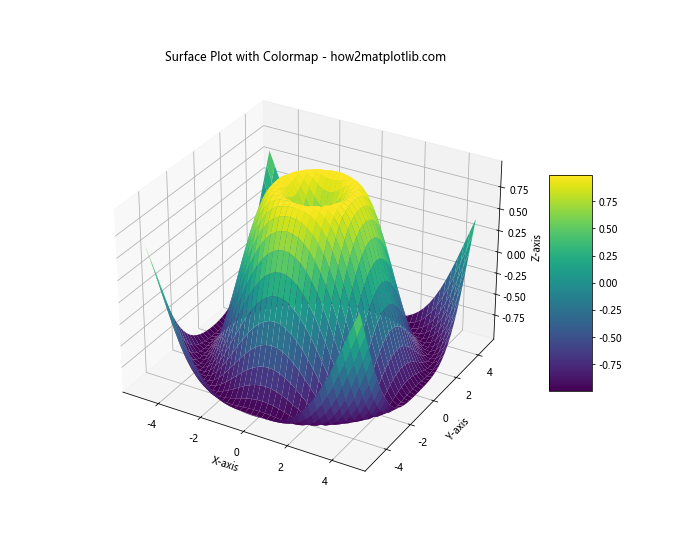
In this example, we’ve added the cmap parameter to plot_surface, specifying the ‘viridis’ colormap. We’ve also added a color bar to the plot using fig.colorbar, which helps interpret the color scale.
Custom Color Function
We can also define our own color function to map colors to the surface:
import numpy as np
import matplotlib.pyplot as plt
from mpl_toolkits.mplot3d import Axes3D

# Create data
X = np.arange(-5, 5, 0.25)
Y = np.arange(-5, 5, 0.25)
X, Y = np.meshgrid(X, Y)
Z = np.sin(np.sqrt(X**2 + Y**2))

# Create a custom color array
colors = np.zeros(Z.shape + (3,))
colors[..., 0] = np.clip(Z * 2, 0, 1)  # Red channel
colors[..., 1] = np.clip((Z + 1) / 2, 0, 1)  # Green channel
colors[..., 2] = np.clip(-Z * 2, 0, 1)  # Blue channel

# Create figure and 3D axis
fig = plt.figure(figsize=(10, 8))
ax = fig.add_subplot(111, projection='3d')

# Plot the surface with custom colors
surf = ax.plot_surface(X, Y, Z, facecolors=colors)

# Set labels and title
ax.set_xlabel('X-axis')
ax.set_ylabel('Y-axis')
ax.set_zlabel('Z-axis')
ax.set_title('Surface Plot with Custom Colors - how2matplotlib.com')

# Show the plot
plt.show()
Output:
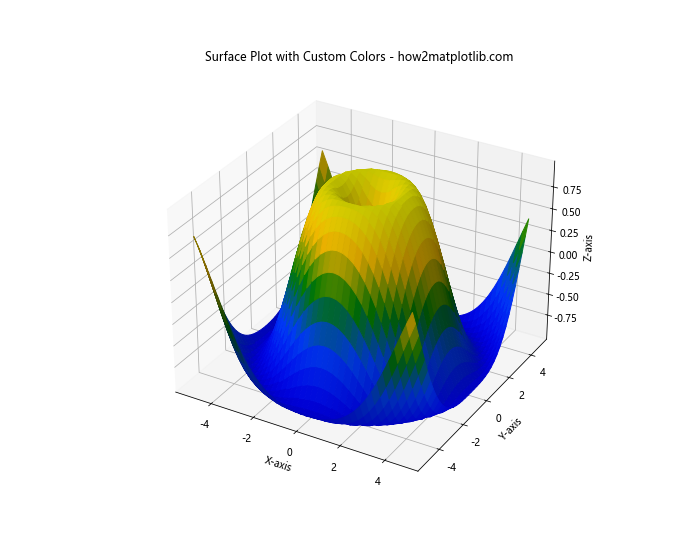
In this example, we create a custom color array where each point on the surface is assigned an RGB color based on its Z value. We then pass this color array to plot_surface using the facecolors parameter.
Adjusting the Surface Appearance in Matplotlib plot_surface
plot_surface offers several parameters to adjust the appearance of the surface, including its transparency, shading, and line properties.
Transparency and Shading
We can adjust the transparency of the surface and change its shading:
import numpy as np
import matplotlib.pyplot as plt
from mpl_toolkits.mplot3d import Axes3D

# Create data
X = np.arange(-5, 5, 0.25)
Y = np.arange(-5, 5, 0.25)
X, Y = np.meshgrid(X, Y)
Z = np.sin(np.sqrt(X**2 + Y**2))

# Create figure and 3D axis
fig = plt.figure(figsize=(10, 8))
ax = fig.add_subplot(111, projection='3d')

# Plot the surface with transparency and shading
surf = ax.plot_surface(X, Y, Z, cmap='coolwarm', alpha=0.8, shade=True)

# Add a color bar
fig.colorbar(surf, shrink=0.5, aspect=5)

# Set labels and title
ax.set_xlabel('X-axis')
ax.set_ylabel('Y-axis')
ax.set_zlabel('Z-axis')
ax.set_title('Surface Plot with Transparency and Shading - how2matplotlib.com')

# Show the plot
plt.show()
Output:
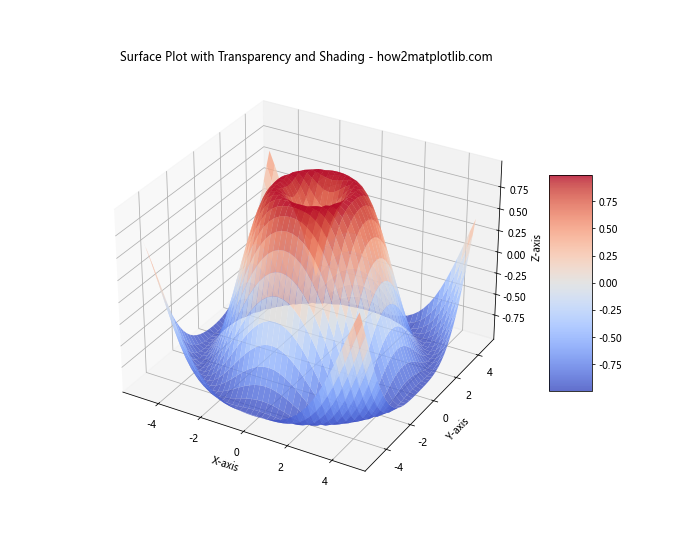
In this example, we’ve set alpha=0.8 to make the surface slightly transparent, and shade=True to enable shading effects.
Adjusting Line Properties
We can also adjust the properties of the lines that make up the surface grid:
import numpy as np
import matplotlib.pyplot as plt
from mpl_toolkits.mplot3d import Axes3D

# Create data
X = np.arange(-5, 5, 0.5)
Y = np.arange(-5, 5, 0.5)
X, Y = np.meshgrid(X, Y)
Z = np.sin(np.sqrt(X**2 + Y**2))

# Create figure and 3D axis
fig = plt.figure(figsize=(10, 8))
ax = fig.add_subplot(111, projection='3d')

# Plot the surface with custom line properties
surf = ax.plot_surface(X, Y, Z, cmap='viridis',
                       linewidth=1, antialiased=False,
                       rstride=1, cstride=1)

# Add a color bar
fig.colorbar(surf, shrink=0.5, aspect=5)

# Set labels and title
ax.set_xlabel('X-axis')
ax.set_ylabel('Y-axis')
ax.set_zlabel('Z-axis')
ax.set_title('Surface Plot with Custom Line Properties - how2matplotlib.com')

# Show the plot
plt.show()
Output:
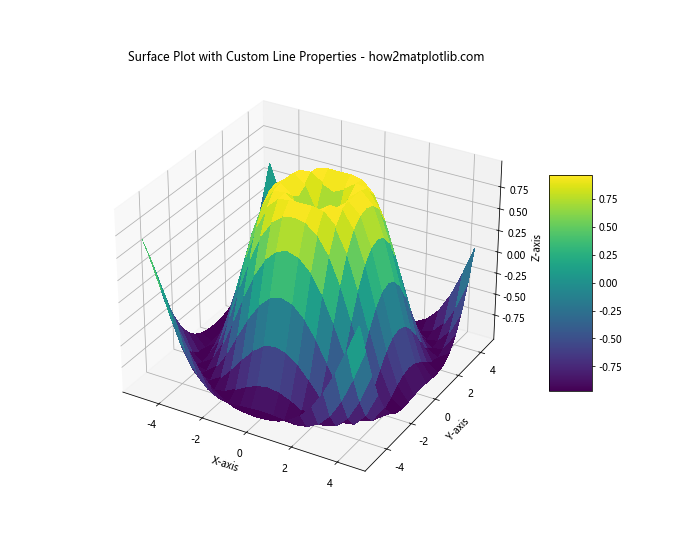
In this example, we’ve set linewidth=1 to make the grid lines visible, antialiased=False for sharper lines, and rstride=1 and cstride=1 to show all grid lines.
Advanced Techniques with Matplotlib plot_surface
Now that we’ve covered the basics, let’s explore some more advanced techniques using plot_surface.
Multiple Surfaces
We can plot multiple surfaces on the same axis to compare different datasets:
import numpy as np
import matplotlib.pyplot as plt
from mpl_toolkits.mplot3d import Axes3D

# Create data
X = np.arange(-5, 5, 0.25)
Y = np.arange(-5, 5, 0.25)
X, Y = np.meshgrid(X, Y)
Z1 = np.sin(np.sqrt(X**2 + Y**2))
Z2 = np.cos(np.sqrt(X**2 + Y**2))

# Create figure and 3D axis
fig = plt.figure(figsize=(12, 6))
ax1 = fig.add_subplot(121, projection='3d')
ax2 = fig.add_subplot(122, projection='3d')

# Plot the surfaces
surf1 = ax1.plot_surface(X, Y, Z1, cmap='viridis')
surf2 = ax2.plot_surface(X, Y, Z2, cmap='plasma')

# Add color bars
fig.colorbar(surf1, ax=ax1, shrink=0.5, aspect=5)
fig.colorbar(surf2, ax=ax2, shrink=0.5, aspect=5)

# Set labels and titles
for ax in [ax1, ax2]:
    ax.set_xlabel('X-axis')
    ax.set_ylabel('Y-axis')
    ax.set_zlabel('Z-axis')

ax1.set_title('Sin Surface - how2matplotlib.com')
ax2.set_title('Cos Surface - how2matplotlib.com')

# Adjust layout and show the plot
plt.tight_layout()
plt.show()
Output:
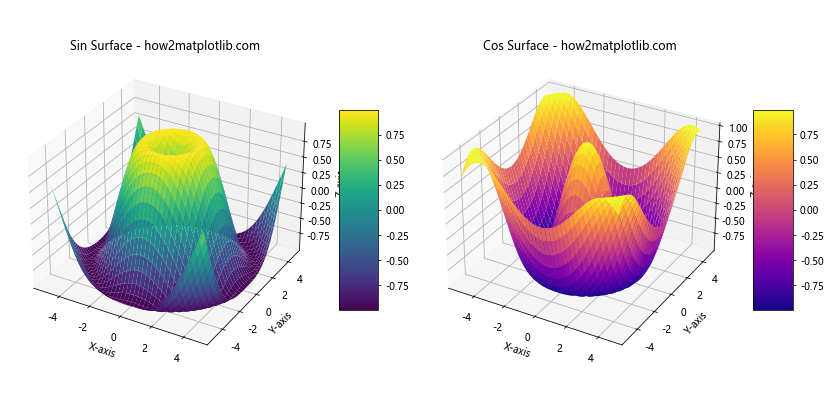
This example creates two subplots, each with a different surface plot. This allows for easy comparison between different datasets or functions.
Combining Surface and Contour Plots
We can combine surface plots with contour plots to provide additional information:
import numpy as np
import matplotlib.pyplot as plt
from mpl_toolkits.mplot3d import Axes3D

# Create data
X = np.arange(-5, 5, 0.25)
Y = np.arange(-5, 5, 0.25)
X, Y = np.meshgrid(X, Y)
Z = np.sin(np.sqrt(X**2 + Y**2))

# Create figure and 3D axis
fig = plt.figure(figsize=(10, 8))
ax = fig.add_subplot(111, projection='3d')

# Plot the surface
surf = ax.plot_surface(X, Y, Z, cmap='viridis', alpha=0.8)

# Add contour lines
contours = ax.contour(X, Y, Z, zdir='z', offset=-2, cmap='coolwarm')

# Add a color bar
fig.colorbar(surf, shrink=0.5, aspect=5)

# Set labels and title
ax.set_xlabel('X-axis')
ax.set_ylabel('Y-axis')
ax.set_zlabel('Z-axis')
ax.set_title('Surface Plot with Contour Lines - how2matplotlib.com')

# Set z axis limits
ax.set_zlim(-2, 1)

# Show the plot
plt.show()
Output:
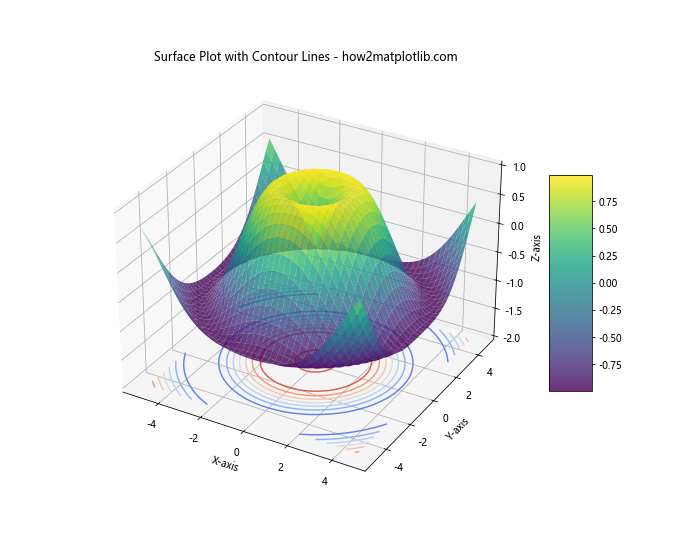
In this example, we’ve added contour lines to the bottom of the plot using ax.contour. This provides a 2D representation of the surface at the bottom of the 3D plot.
Handling Large Datasets with Matplotlib plot_surface
When dealing with large datasets, rendering a surface plot can be computationally expensive. Here are some techniques to handle large datasets efficiently.
Downsampling
One approach is to downsample the data before plotting:
import numpy as np
import matplotlib.pyplot as plt
from mpl_toolkits.mplot3d import Axes3D

# Create a large dataset
x = np.linspace(-10, 10, 1000)
y = np.linspace(-10, 10, 1000)
X, Y = np.meshgrid(x, y)
Z = np.sin(np.sqrt(X**2 + Y**2))

# Downsample the data
downsample = 10
X_down = X[::downsample, ::downsample]
Y_down = Y[::downsample, ::downsample]
Z_down = Z[::downsample, ::downsample]

# Create figure and 3D axis
fig = plt.figure(figsize=(10, 8))
ax = fig.add_subplot(111, projection='3d')

# Plot the downsampled surface
surf = ax.plot_surface(X_down, Y_down, Z_down, cmap='viridis')

# Add a color bar
fig.colorbar(surf, shrink=0.5, aspect=5)

# Set labels and title
ax.set_xlabel('X-axis')
ax.set_ylabel('Y-axis')
ax.set_zlabel('Z-axis')
ax.set_title('Downsampled Surface Plot - how2matplotlib.com')

# Show the plot
plt.show()
Output:
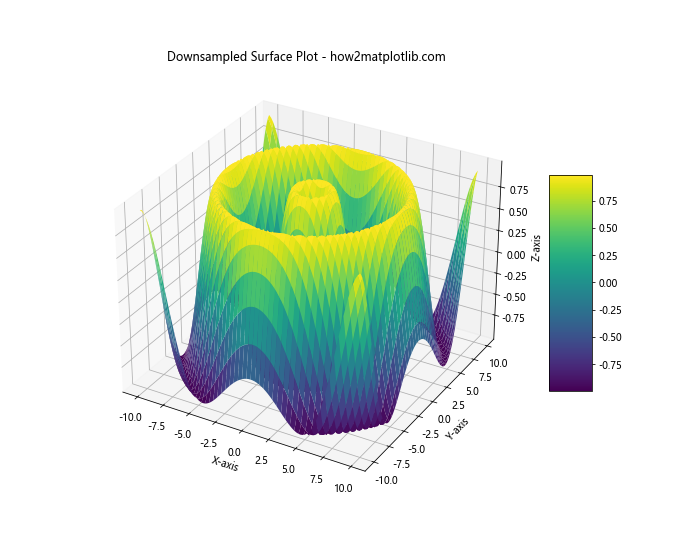
In this example, we create a large dataset and then downsample it by taking every 10th point before plotting. This significantly reduces the number of points to plot while still maintaining the overall shape of the surface.
Using rstride and cstride
Another approach is to use the rstride and cstride parameters to reduce the number of rows and columns plotted:
import numpy as np
import matplotlib.pyplot as plt
from mpl_toolkits.mplot3d import Axes3D

# Create a large dataset
x = np.linspace(-10, 10, 1000)
y = np.linspace(-10, 10, 1000)
X, Y = np.meshgrid(x, y)
Z = np.sin(np.sqrt(X**2 + Y**2))

# Create figure and 3D axis
fig = plt.figure(figsize=(10, 8))
ax = fig.add_subplot(111, projection='3d')

# Plot the surface with reduced stride
surf = ax.plot_surface(X, Y, Z, cmap='viridis', rstride=50, cstride=50)

# Add a color bar
fig.colorbar(surf, shrink=0.5, aspect=5)

# Set labels and title
ax.set_xlabel('X-axis')
ax.set_ylabel('Y-axis')
ax.set_zlabel('Z-axis')
ax.set_title('Surface Plot with Reduced Stride - how2matplotlib.com')

# Show the plot
plt.show()
Output:
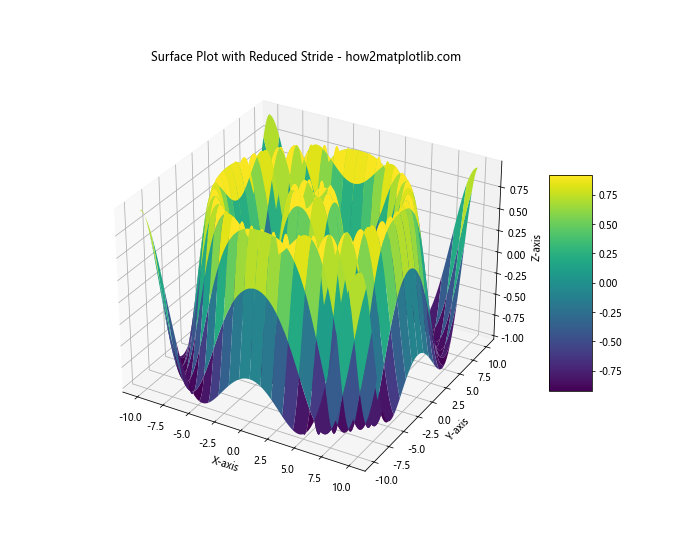
In this example, we use rstride=50 and cstride=50 to plot only every 50th row and column of our data. This significantly reduces the rendering time while still providing a good representation of the surface.
Matplotlib plot_surface Conclusion
Matplotlib’s plot_surface function is a powerful tool for creating 3D surface plots. We’ve explored various aspects of this function, from basic usage to advanced techniques like custom coloring, handling large datasets, creating animations, and combining with other plot types.
By mastering these techniques, you can create rich, informative 3D visualizations that effectively communicate complex data. Remember that the key to creating good visualizations is not just in the technical implementation, but also in choosing the right representation for your data and your audience.
As you continue to work with plot_surface and other 3D plotting functions in Matplotlib, don’t be afraid to experiment and combine different techniques. The flexibility of Matplotlib allows for a wide range of customizations and combinations, enabling you to create visualizations that are both informative and visually appealing.