How to Use Matplotlib Hex Colors: A Comprehensive Guide
Matplotlib hex colors are an essential aspect of data visualization in Python. This article will delve deep into the world of matplotlib hex colors, exploring their various applications, benefits, and implementation techniques. We’ll cover everything from basic usage to advanced color manipulation, providing you with a thorough understanding of how to leverage matplotlib hex colors in your data visualization projects.
Understanding Matplotlib Hex Colors
Matplotlib hex colors are a way to represent colors using hexadecimal notation in the matplotlib library. This color system allows for precise control over the colors used in your plots and charts. Hex colors are represented by a six-digit code, preceded by a hash symbol (#). Each pair of digits in the code represents the intensity of red, green, and blue components of the color, respectively.
Let’s start with a simple example of using matplotlib hex colors:
import matplotlib.pyplot as plt

plt.figure(figsize=(8, 6))
plt.plot([1, 2, 3, 4], [1, 4, 2, 3], color='#FF5733')
plt.title('Simple Line Plot with Matplotlib Hex Color - how2matplotlib.com')
plt.xlabel('X-axis')
plt.ylabel('Y-axis')
plt.show()
Output:
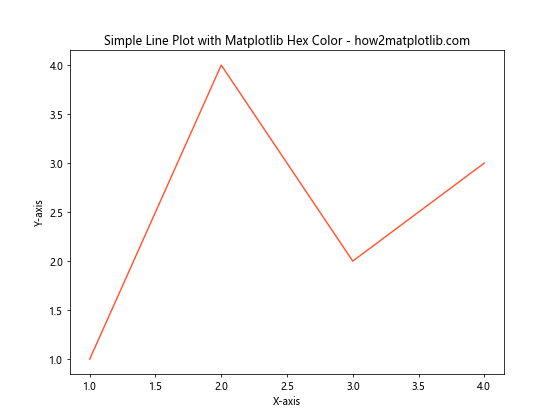
In this example, we’ve used the matplotlib hex color ‘#FF5733’ to set the color of the line plot. This hex code represents a vibrant orange color.
The Anatomy of Matplotlib Hex Colors
To fully understand matplotlib hex colors, it’s crucial to break down their structure:
- The hash symbol (#) indicates the start of a hex color code.
- The first two digits (FF in our example) represent the red component.
- The next two digits (57) represent the green component.
- The last two digits (33) represent the blue component.
Each pair of digits can range from 00 (no intensity) to FF (full intensity) in hexadecimal notation.
Let’s create a function to demonstrate how changing these components affects the color:
import matplotlib.pyplot as plt

def plot_hex_color(hex_color):
    plt.figure(figsize=(6, 4))
    plt.bar(['Color'], [1], color=hex_color)
    plt.title(f'Matplotlib Hex Color: {hex_color} - how2matplotlib.com')
    plt.ylim(0, 1)
    plt.show()

# Demonstrate different hex colors
plot_hex_color('#FF0000')  # Full red
plot_hex_color('#00FF00')  # Full green
plot_hex_color('#0000FF')  # Full blue
plot_hex_color('#FFFF00')  # Yellow (full red + full green)
This example shows how different combinations of red, green, and blue components create various colors using matplotlib hex colors.
Benefits of Using Matplotlib Hex Colors
Matplotlib hex colors offer several advantages over other color representation methods:
- Precision: Hex colors allow for exact color specification.
- Consistency: Hex codes ensure consistent colors across different platforms and devices.
- Flexibility: You can easily adjust colors by modifying individual components.
- Compatibility: Hex colors are widely supported in web design and other graphical applications.
Let’s demonstrate the precision of matplotlib hex colors with an example:
import matplotlib.pyplot as plt

plt.figure(figsize=(10, 6))
colors = ['#FF0000', '#FF3333', '#FF6666', '#FF9999', '#FFCCCC']
for i, color in enumerate(colors):
    plt.bar(i, 1, color=color, width=0.8)

plt.title('Shades of Red Using Matplotlib Hex Colors - how2matplotlib.com')
plt.xlabel('Color Shades')
plt.ylabel('Value')
plt.xticks(range(5), ['100%', '80%', '60%', '40%', '20%'])
plt.show()
Output:
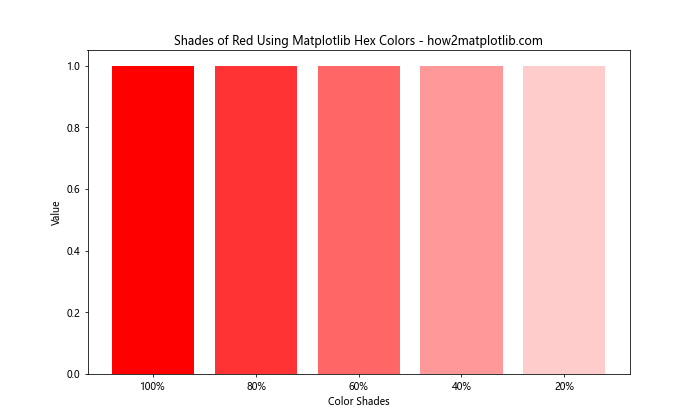
This example showcases the precision of matplotlib hex colors by displaying different shades of red, each precisely defined using hex codes.
Creating Custom Color Palettes with Matplotlib Hex Colors
One of the most powerful features of matplotlib hex colors is the ability to create custom color palettes. This is particularly useful when you want to maintain a consistent color scheme across your visualizations or adhere to specific branding guidelines.
Here’s an example of how to create and use a custom color palette:
import matplotlib.pyplot as plt

# Define custom color palette
custom_palette = ['#1A5F7A', '#159895', '#57C5B6', '#002B5B']

plt.figure(figsize=(10, 6))
for i, color in enumerate(custom_palette):
    plt.bar(i, i+1, color=color, width=0.8)

plt.title('Custom Color Palette with Matplotlib Hex Colors - how2matplotlib.com')
plt.xlabel('Categories')
plt.ylabel('Values')
plt.xticks(range(4), ['A', 'B', 'C', 'D'])
plt.show()
Output:
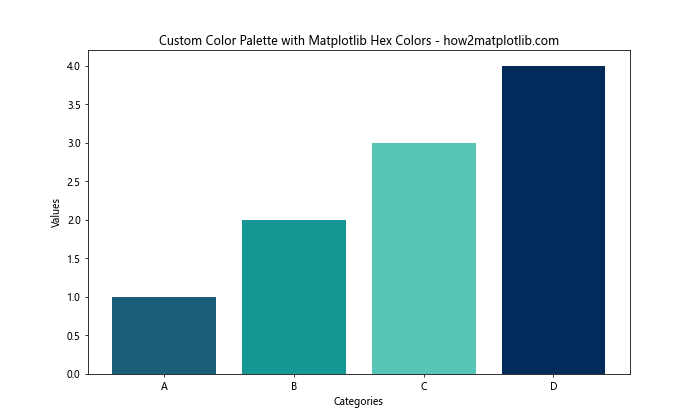
This example demonstrates how to use a custom color palette created with matplotlib hex colors to create a visually appealing bar chart.
Generating Matplotlib Hex Colors Programmatically
While manually specifying matplotlib hex colors is useful, sometimes you may need to generate colors programmatically. This can be particularly helpful when dealing with large datasets or when you need to create color gradients.
Let’s look at an example of how to generate a color gradient using matplotlib hex colors:
import matplotlib.pyplot as plt
import matplotlib.colors as mcolors

def hex_color_gradient(start_hex, end_hex, steps):
    start = mcolors.to_rgb(start_hex)
    end = mcolors.to_rgb(end_hex)
    colors = [mcolors.to_hex(tuple([(1-t)*s + t*e for s, e in zip(start, end)])) for t in np.linspace(0, 1, steps)]
    return colors

# Generate a gradient from blue to red
gradient = hex_color_gradient('#0000FF', '#FF0000', 10)

plt.figure(figsize=(12, 6))
for i, color in enumerate(gradient):
    plt.bar(i, 1, color=color, width=0.8)

plt.title('Color Gradient Using Matplotlib Hex Colors - how2matplotlib.com')
plt.xlabel('Gradient Steps')
plt.ylabel('Value')
plt.show()
This example shows how to create a smooth color gradient between two matplotlib hex colors, which can be useful for creating heat maps or other visualizations that require color transitions.
Using Matplotlib Hex Colors in Different Plot Types
Matplotlib hex colors can be applied to various types of plots. Let’s explore how to use them in different visualization types:
Scatter Plots
import matplotlib.pyplot as plt
import numpy as np

np.random.seed(42)
x = np.random.rand(50)
y = np.random.rand(50)
colors = np.random.rand(50)

plt.figure(figsize=(10, 8))
scatter = plt.scatter(x, y, c=colors, cmap='viridis')
plt.colorbar(scatter)
plt.title('Scatter Plot with Matplotlib Hex Colors - how2matplotlib.com')
plt.xlabel('X-axis')
plt.ylabel('Y-axis')
plt.show()
Output:
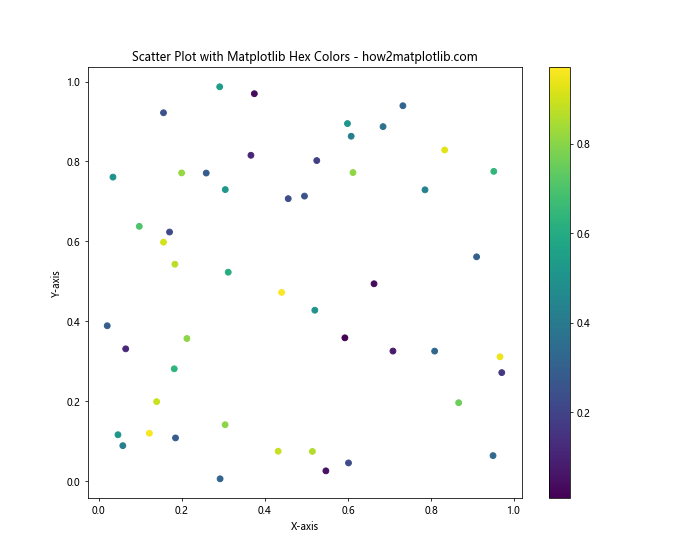
In this example, we’ve used a colormap to assign colors to scatter points based on their values. While not directly using hex colors, this demonstrates how color can be used to represent an additional dimension of data.
Pie Charts
import matplotlib.pyplot as plt

sizes = [30, 25, 20, 15, 10]
labels = ['A', 'B', 'C', 'D', 'E']
colors = ['#FF9999', '#66B2FF', '#99FF99', '#FFCC99', '#FF99CC']

plt.figure(figsize=(10, 8))
plt.pie(sizes, labels=labels, colors=colors, autopct='%1.1f%%', startangle=90)
plt.title('Pie Chart with Matplotlib Hex Colors - how2matplotlib.com')
plt.axis('equal')
plt.show()
Output:
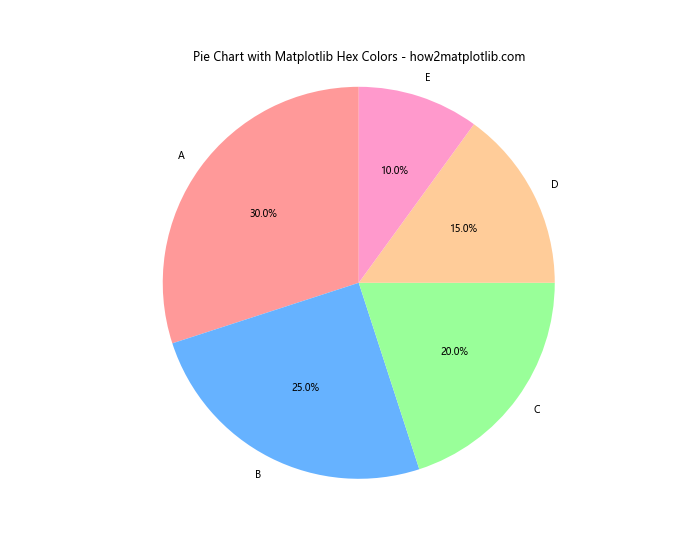
This pie chart example demonstrates how matplotlib hex colors can be used to create visually distinct segments.
Heatmaps
import matplotlib.pyplot as plt
import numpy as np

data = np.random.rand(10, 10)
plt.figure(figsize=(10, 8))
heatmap = plt.imshow(data, cmap='YlOrRd')
plt.colorbar(heatmap)
plt.title('Heatmap with Matplotlib Hex Colors - how2matplotlib.com')
plt.show()
Output:
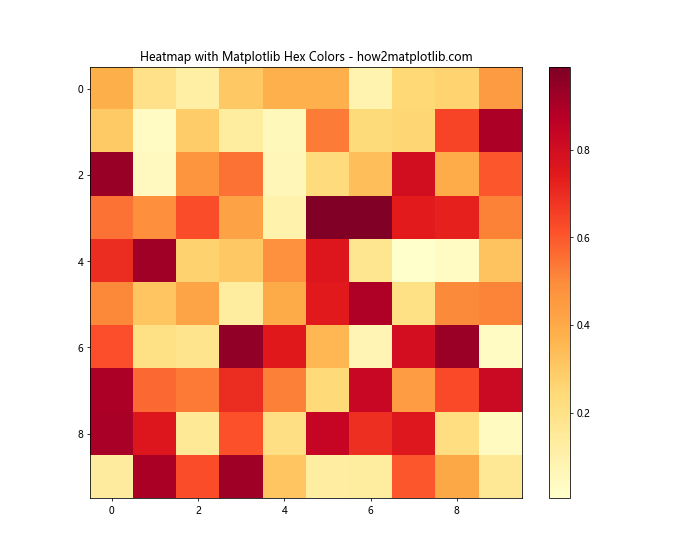
While this heatmap uses a predefined colormap, you can create custom colormaps using matplotlib hex colors for more specific color schemes.
Advanced Techniques with Matplotlib Hex Colors
As you become more comfortable with matplotlib hex colors, you can explore more advanced techniques to enhance your visualizations.
Color Mapping Based on Data Values
import matplotlib.pyplot as plt
import numpy as np

def value_to_color(value, vmin, vmax):
    norm = plt.Normalize(vmin, vmax)
    cmap = plt.cm.get_cmap('viridis')
    return mcolors.to_hex(cmap(norm(value)))

np.random.seed(42)
data = np.random.rand(20)
colors = [value_to_color(v, min(data), max(data)) for v in data]

plt.figure(figsize=(12, 6))
plt.bar(range(len(data)), data, color=colors)
plt.title('Color Mapping Based on Data Values - how2matplotlib.com')
plt.xlabel('Index')
plt.ylabel('Value')
plt.colorbar(plt.cm.ScalarMappable(cmap='viridis', norm=plt.Normalize(min(data), max(data))))
plt.show()
This example demonstrates how to map data values to colors using a colormap and convert them to matplotlib hex colors.
Creating Custom Colormaps
import matplotlib.pyplot as plt
import matplotlib.colors as mcolors
import numpy as np

custom_colors = ['#FF0000', '#00FF00', '#0000FF']
n_bins = 100
custom_cmap = mcolors.LinearSegmentedColormap.from_list('custom', custom_colors, N=n_bins)

data = np.random.rand(10, 10)
plt.figure(figsize=(10, 8))
heatmap = plt.imshow(data, cmap=custom_cmap)
plt.colorbar(heatmap)
plt.title('Custom Colormap with Matplotlib Hex Colors - how2matplotlib.com')
plt.show()
Output:
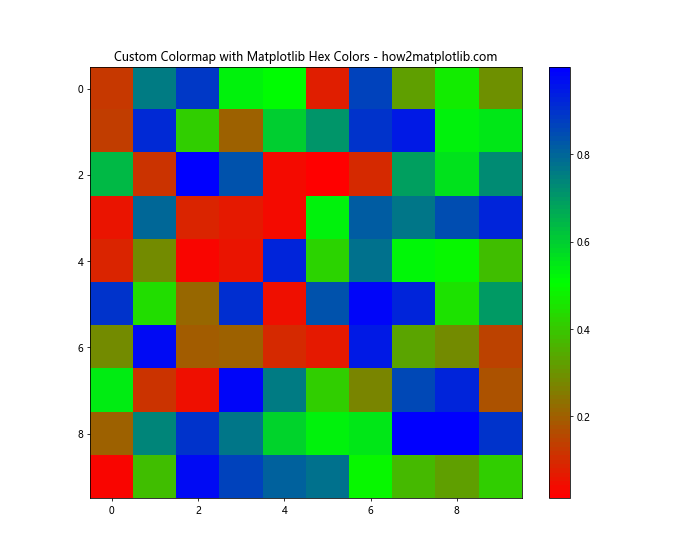
This example shows how to create a custom colormap using matplotlib hex colors, which can be useful for creating unique and brand-specific visualizations.
Best Practices for Using Matplotlib Hex Colors
When working with matplotlib hex colors, keep these best practices in mind:
- Consistency: Use a consistent color scheme across related visualizations.
- Accessibility: Ensure your color choices are accessible to color-blind individuals.
- Contrast: Choose colors with sufficient contrast for readability.
- Meaning: Use colors that convey meaning relevant to your data.
Let’s demonstrate some of these principles:
import matplotlib.pyplot as plt
import matplotlib.colors as mcolors

# Colorblind-friendly palette
cb_colors = ['#FF8C00', '#A034F0', '#159090', '#FFC0CB', '#14D100']

plt.figure(figsize=(12, 6))
for i, color in enumerate(cb_colors):
    plt.bar(i, 1, color=color, width=0.8)

plt.title('Colorblind-Friendly Palette with Matplotlib Hex Colors - how2matplotlib.com')
plt.xlabel('Categories')
plt.ylabel('Value')
plt.xticks(range(5), ['A', 'B', 'C', 'D', 'E'])
plt.show()
Output:
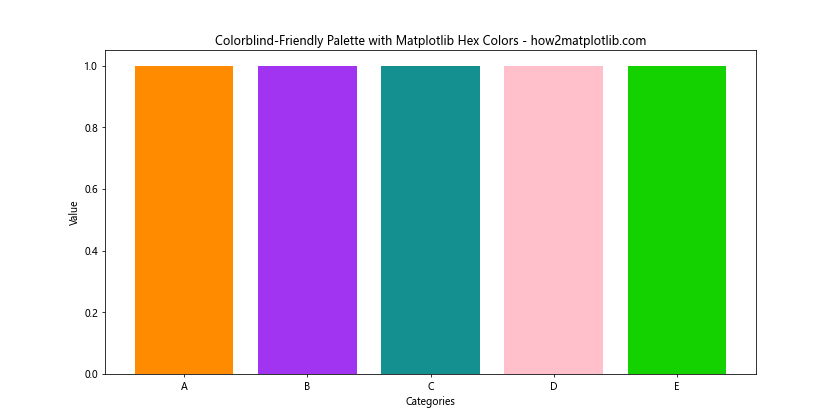
This example uses a colorblind-friendly palette to ensure accessibility in your visualizations.
Troubleshooting Common Issues with Matplotlib Hex Colors
When working with matplotlib hex colors, you might encounter some common issues. Let’s address a few of them:
Invalid Hex Color Codes
import matplotlib.pyplot as plt

def plot_color(color):
    try:
        plt.figure(figsize=(6, 4))
        plt.bar(['Color'], [1], color=color)
        plt.title(f'Valid Color: {color} - how2matplotlib.com')
        plt.ylim(0, 1)
        plt.show()
    except ValueError as e:
        print(f"Error: {e}")

# Valid color
plot_color('#FF5733')

# Invalid color (too short)
plot_color('#F57')

# Invalid color (invalid characters)
plot_color('#GG5733')
This example demonstrates how to handle invalid hex color codes and provides error messages for debugging.
Color Inconsistencies Across Platforms
To ensure color consistency across different platforms, always use the full 6-digit hex code:
import matplotlib.pyplot as plt

plt.figure(figsize=(10, 6))
plt.bar(['Full Hex', 'Shorthand Hex'], [1, 1], color=['#FF9900', '#F90'])
plt.title('Full vs. Shorthand Hex Colors - how2matplotlib.com')
plt.ylim(0, 1.2)
plt.show()
Output:
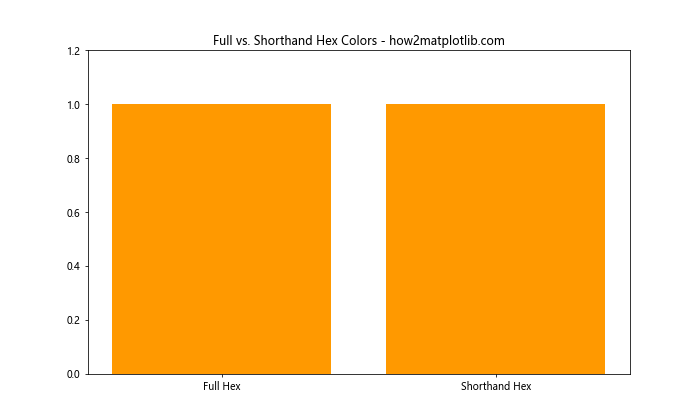
While both colors in this example should appear the same, using the full 6-digit hex code (#FF9900) is recommended for consistency.
Integrating Matplotlib Hex Colors with Other Libraries
Matplotlib hex colors can be integrated with other data visualization libraries for enhanced functionality. Let’s look at an example using Seaborn:
import matplotlib.pyplot as plt
import seaborn as sns
import numpy as np

# Set custom color palette
custom_palette = ['#1A5F7A', '#159895', '#57C5B6', '#002B5B']
sns.set_palette(custom_palette)

# Generate data
categories = ['A', 'B', 'C', 'D']
values = np.random.rand(4, 3)

# Create the plot
plt.figure(figsize=(10, 6))
sns.barplot(x=categories, y=values.mean(axis=1))
plt.title('Seaborn Plot with Custom Matplotlib Hex Colors - how2matplotlib.com')
plt.ylabel('Average Value')
plt.show()
Output:
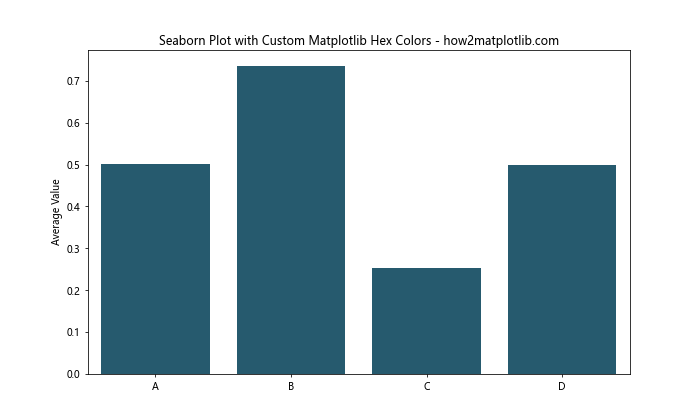
This example demonstrates how to use a custom color palette defined with matplotlib hex colors in a Seaborn plot.
Matplotlib hex colors Conclusion
Matplotlib hex colors are a powerful tool for creating visually appealing and informative data visualizations. By mastering the use of hex colors in matplotlib, you can create custom color schemes, ensure consistency across your plots, and convey additional information through color choices. Remember to consider accessibility and meaning when selecting colors, and don’t be afraid to experiment with different combinations to find what works best for your data and audience.