Matplotlib Heatmap Interpolation: A Comprehensive Guide
Matplotlib heatmap interpolation is a powerful technique for visualizing and analyzing two-dimensional data. This article will explore the various aspects of creating and customizing heatmaps using Matplotlib, with a focus on interpolation methods to enhance the visual representation of data. We’ll cover everything from basic heatmap creation to advanced interpolation techniques, providing detailed examples and explanations along the way.
Understanding Matplotlib Heatmap Interpolation
Heatmaps are an excellent way to represent data where color-coded values are mapped to a two-dimensional grid. Interpolation in the context of heatmaps refers to the process of estimating values between known data points, resulting in a smoother and more visually appealing representation of the data.
Matplotlib, a popular plotting library for Python, offers robust support for creating heatmaps with various interpolation options. Let’s start with a basic example of creating a heatmap without interpolation:
import numpy as np
import matplotlib.pyplot as plt

# Generate sample data
data = np.random.rand(10, 10)

# Create a heatmap
plt.figure(figsize=(10, 8))
plt.imshow(data, cmap='viridis')
plt.colorbar(label='Value')
plt.title('Basic Heatmap - how2matplotlib.com')
plt.xlabel('X-axis')
plt.ylabel('Y-axis')
plt.show()

# Print the data
print("Sample data:")
print(data)
Output:
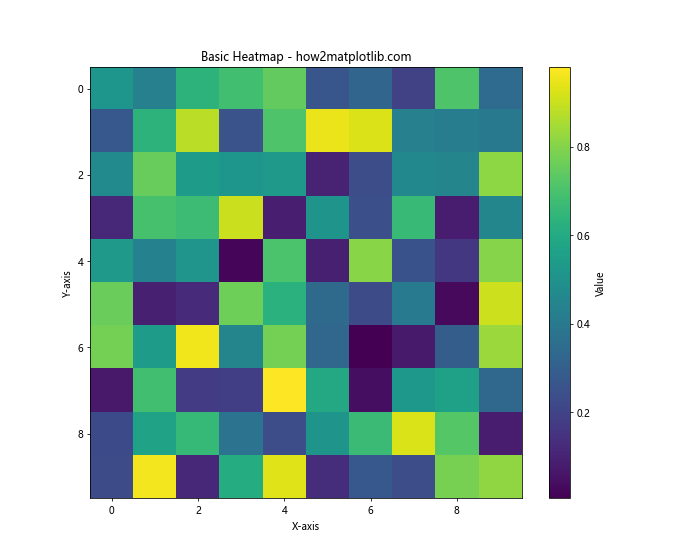
In this example, we create a 10×10 grid of random values and display it as a heatmap using plt.imshow(). The cmap parameter specifies the color scheme, and we add a colorbar to show the value range. This basic heatmap doesn’t use any interpolation, so you’ll see distinct cells representing each data point.
Applying Interpolation to Matplotlib Heatmaps
Now, let’s explore how to apply interpolation to our heatmap:
import numpy as np
import matplotlib.pyplot as plt

# Generate sample data
data = np.random.rand(10, 10)

# Create a heatmap with interpolation
plt.figure(figsize=(10, 8))
plt.imshow(data, cmap='viridis', interpolation='bilinear')
plt.colorbar(label='Value')
plt.title('Heatmap with Bilinear Interpolation - how2matplotlib.com')
plt.xlabel('X-axis')
plt.ylabel('Y-axis')
plt.show()

# Print the interpolation method
print("Interpolation method: bilinear")
Output:
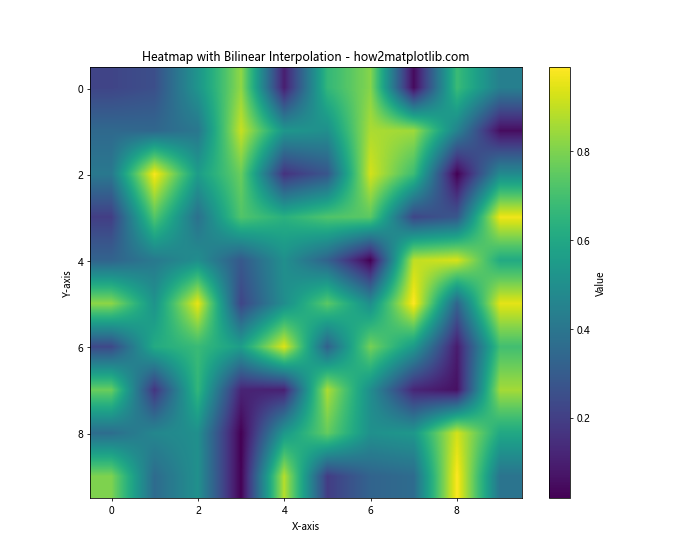
In this example, we’ve added the interpolation='bilinear' parameter to plt.imshow(). Bilinear interpolation is a simple method that estimates values based on a weighted average of the four nearest cell centers. This results in a smoother appearance compared to the non-interpolated version.
Customizing Matplotlib Heatmap Interpolation
To further enhance our heatmaps, we can customize various aspects such as color maps, aspect ratios, and axis labels. Let’s create a more sophisticated example:
import numpy as np
import matplotlib.pyplot as plt

# Generate sample data
x = np.linspace(0, 10, 20)
y = np.linspace(0, 10, 20)
X, Y = np.meshgrid(x, y)
Z = np.sin(X) * np.cos(Y)

# Create a heatmap with custom settings
plt.figure(figsize=(12, 9))
plt.imshow(Z, cmap='coolwarm', interpolation='bicubic', aspect='auto', extent=[0, 10, 0, 10])
plt.colorbar(label='Value')
plt.title('Customized Heatmap with Interpolation - how2matplotlib.com', fontsize=16)
plt.xlabel('X-axis', fontsize=12)
plt.ylabel('Y-axis', fontsize=12)

# Add contour lines
contours = plt.contour(X, Y, Z, colors='black', alpha=0.3)
plt.clabel(contours, inline=True, fontsize=8)

plt.show()

# Print information about the plot
print("Plot details:")
print(f"Data shape: {Z.shape}")
print(f"X range: {x.min()} to {x.max()}")
print(f"Y range: {y.min()} to {y.max()}")
print("Interpolation method: bicubic")
print("Color map: coolwarm")
Output:
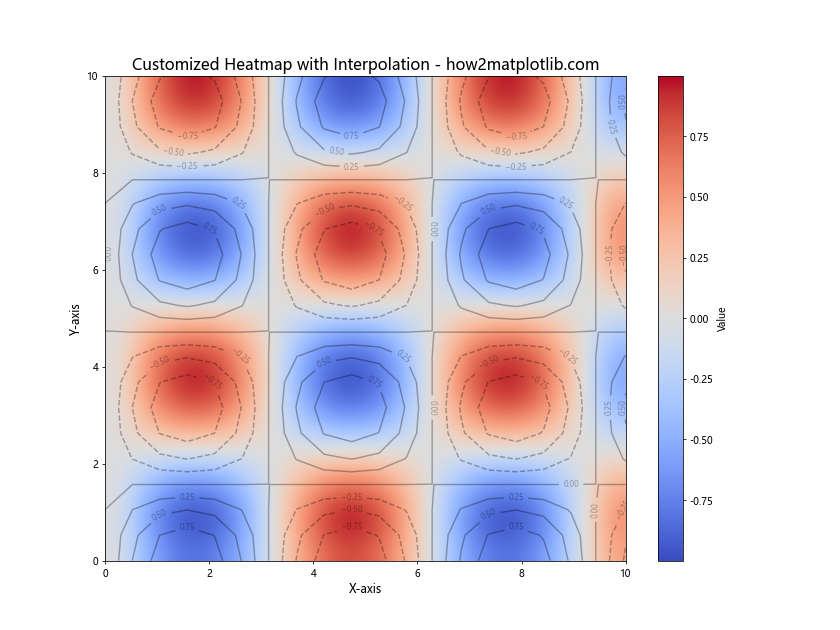
In this example, we’ve created a more complex heatmap using a mathematical function. We’ve customized the following aspects:
- Used a different color map (‘coolwarm’)
- Set the aspect ratio to ‘auto’ for better fitting
- Specified the extent of the plot to match our data range
- Added contour lines with labels for additional information
- Customized font sizes for better readability
Handling Missing Data in Matplotlib Heatmap Interpolation
Real-world data often contains missing values. Let’s see how to handle this situation when creating interpolated heatmaps:
import numpy as np
import matplotlib.pyplot as plt
from matplotlib.colors import LinearSegmentedColormap

# Generate sample data with missing values
data = np.random.rand(10, 10)
mask = np.random.choice([True, False], size=data.shape, p=[0.2, 0.8])
data[mask] = np.nan

# Create a custom colormap with transparency for NaN values
colors = plt.cm.viridis(np.linspace(0, 1, 256))
colors[:, -1] = np.linspace(1, 1, 256)  # Full opacity for all colors
cmap = LinearSegmentedColormap.from_list('custom_viridis', colors)
cmap.set_bad(color='white', alpha=0)  # Set NaN color to transparent

# Create a heatmap with missing data
plt.figure(figsize=(10, 8))
plt.imshow(data, cmap=cmap, interpolation='nearest')
plt.colorbar(label='Value')
plt.title('Heatmap with Missing Data - how2matplotlib.com', fontsize=16)
plt.xlabel('X-axis', fontsize=12)
plt.ylabel('Y-axis', fontsize=12)

# Add text annotations for NaN values
for i in range(data.shape[0]):
    for j in range(data.shape[1]):
        if np.isnan(data[i, j]):
            plt.text(j, i, 'NaN', ha='center', va='center', color='red')

plt.show()

# Print information about the missing data
print("Missing data information:")
print(f"Total cells: {data.size}")
print(f"Missing cells: {np.sum(mask)}")
print(f"Percentage missing: {np.sum(mask) / data.size * 100:.2f}%")
Output:
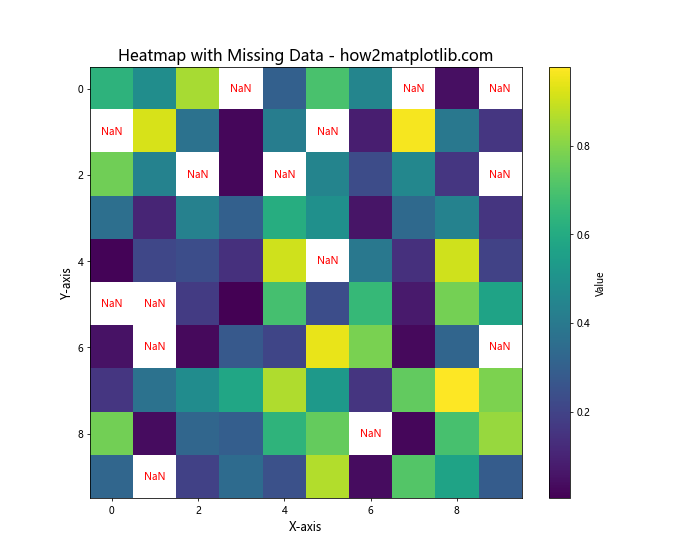
In this example, we’ve introduced missing values (NaN) to our data and handled them in the following ways:
- Created a custom colormap that sets NaN values to transparent.
- Used ‘nearest’ interpolation to avoid interpolating NaN values.
- Added text annotations to clearly mark NaN cells.
This approach allows us to visualize the available data while clearly indicating where data is missing.
Advanced Matplotlib Heatmap Interpolation Techniques
For more complex datasets, we might want to use advanced interpolation techniques. Let’s explore using scipy’s interpolation functions in combination with Matplotlib:
import numpy as np
import matplotlib.pyplot as plt
from scipy import interpolate

# Generate sparse sample data
np.random.seed(0)
x = np.random.rand(20) * 10
y = np.random.rand(20) * 10
z = np.sin(x) * np.cos(y)

# Create a fine grid for interpolation
xi = np.linspace(0, 10, 100)
yi = np.linspace(0, 10, 100)
XI, YI = np.meshgrid(xi, yi)

# Perform griddata interpolation
ZI = interpolate.griddata((x, y), z, (XI, YI), method='cubic')

# Create the heatmap
plt.figure(figsize=(12, 9))
plt.imshow(ZI, extent=[0, 10, 0, 10], origin='lower', cmap='viridis', interpolation='nearest')
plt.colorbar(label='Value')
plt.title('Advanced Interpolation Heatmap - how2matplotlib.com', fontsize=16)
plt.xlabel('X-axis', fontsize=12)
plt.ylabel('Y-axis', fontsize=12)

# Plot original data points
plt.scatter(x, y, c='red', s=50, edgecolor='white', label='Data Points')
plt.legend()

plt.show()

# Print information about the interpolation
print("Interpolation details:")
print(f"Original data points: {len(x)}")
print(f"Interpolated grid size: {ZI.shape}")
print("Interpolation method: cubic")
Output:
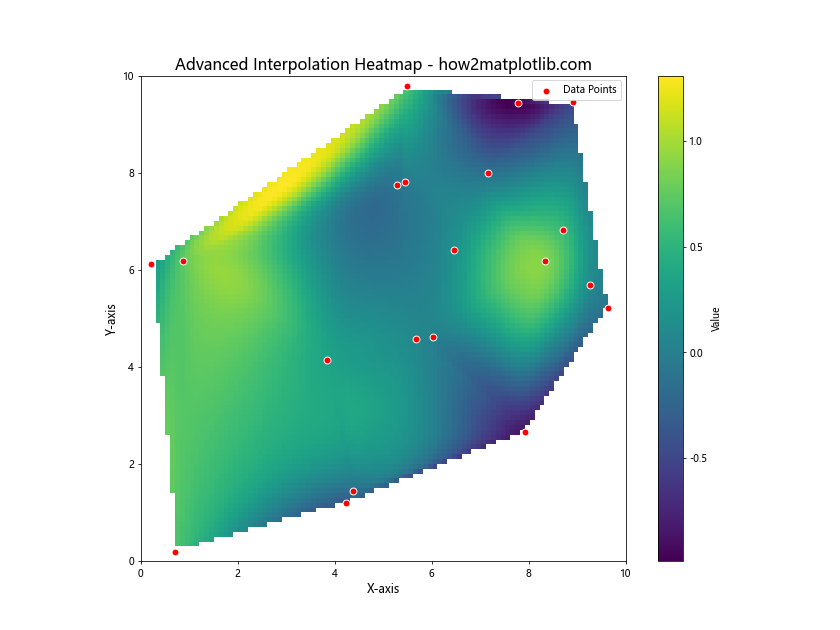
In this advanced example, we’ve used scipy’s griddata function to perform cubic interpolation on scattered data points. This allows us to create a smooth heatmap from sparse, irregularly spaced data. We’ve also added the original data points as a scatter plot overlay to show where the actual measurements were taken.
Animating Matplotlib Heatmap Interpolation
To demonstrate how interpolation can be used in dynamic visualizations, let’s create an animated heatmap:
import numpy as np
import matplotlib.pyplot as plt
from matplotlib.animation import FuncAnimation

# Generate initial data
data = np.random.rand(10, 10)

# Create the figure and axis
fig, ax = plt.subplots(figsize=(10, 8))
ax.set_title('Animated Heatmap - how2matplotlib.com', fontsize=16)

# Create the initial heatmap
im = ax.imshow(data, cmap='viridis', interpolation='bilinear', animated=True)
plt.colorbar(im, label='Value')

# Animation update function
def update(frame):
    # Update data with some random changes
    global data
    data = data * 0.95 + np.random.rand(10, 10) * 0.05
    im.set_array(data)
    return [im]

# Create the animation
anim = FuncAnimation(fig, update, frames=200, interval=50, blit=True)

plt.show()

# Print animation details
print("Animation details:")
print("Number of frames: 200")
print("Interval between frames: 50 ms")
print("Interpolation method: bilinear")
Output:
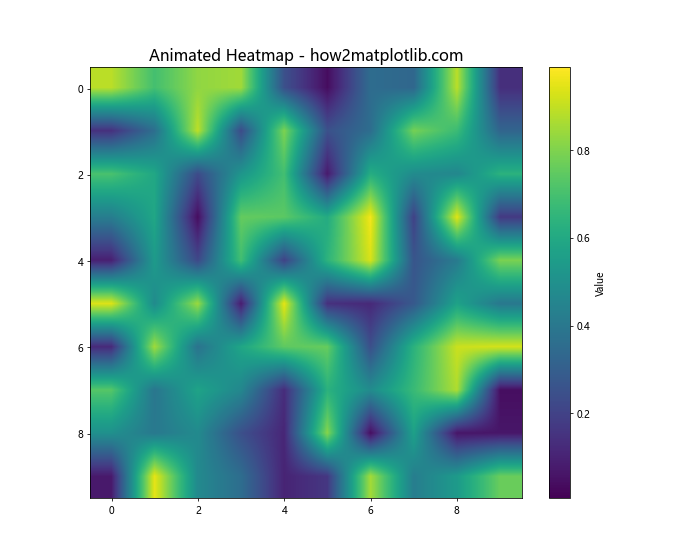
This example creates an animated heatmap where the data is slightly updated in each frame. The FuncAnimation class is used to create the animation, with the update function defining how the data changes over time. The interpolation='bilinear' parameter ensures smooth transitions between frames.
Combining Matplotlib Heatmap Interpolation with Other Plot Types
Heatmaps can be combined with other plot types to create more informative visualizations. Let’s create a 3D surface plot with a corresponding heatmap:
import numpy as np
import matplotlib.pyplot as plt
from mpl_toolkits.mplot3d import Axes3D

# Generate sample data
x = np.linspace(-5, 5, 50)
y = np.linspace(-5, 5, 50)
X, Y = np.meshgrid(x, y)
Z = np.sin(np.sqrt(X**2 + Y**2))

# Create the figure with two subplots
fig = plt.figure(figsize=(15, 6))
fig.suptitle('3D Surface and Heatmap Comparison - how2matplotlib.com', fontsize=16)

# 3D surface plot
ax1 = fig.add_subplot(121, projection='3d')
surf = ax1.plot_surface(X, Y, Z, cmap='viridis', edgecolor='none')
ax1.set_title('3D Surface Plot')
fig.colorbar(surf, ax=ax1, shrink=0.5, aspect=5, label='Value')

# Heatmap with interpolation
ax2 = fig.add_subplot(122)
im = ax2.imshow(Z, extent=[-5, 5, -5, 5], origin='lower', cmap='viridis', interpolation='bicubic')
ax2.set_title('2D Heatmap with Interpolation')
fig.colorbar(im, ax=ax2, shrink=0.5, aspect=5, label='Value')

plt.tight_layout()
plt.show()

# Print plot information
print("Plot details:")
print(f"Data shape: {Z.shape}")
print("Left plot: 3D surface")
print("Right plot: 2D heatmap with bicubic interpolation")
Output:
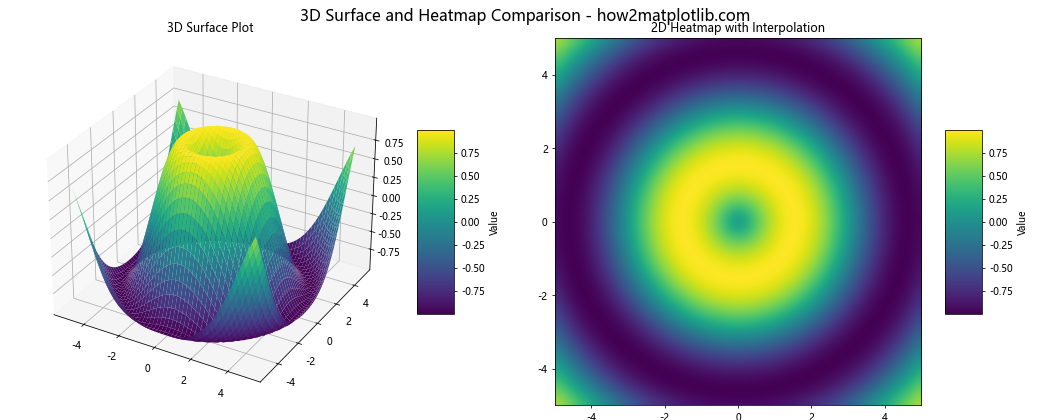
This example creates a side-by-side comparison of a 3D surface plot and a 2D heatmap with interpolation. This allows viewers to see both the overall shape of the data (in 3D) and the detailed color mapping (in 2D).
Optimizing Matplotlib Heatmap Interpolation for Large Datasets
When dealing with large datasets, interpolation can become computationally expensive. Here’s an example of how to optimize heatmap rendering for larger datasets:
import numpy as np
import matplotlib.pyplot as plt
from matplotlib.colors import LinearSegmentedColormap

# Generate a large dataset
data = np.random.rand(1000, 1000)

# Create a custom colormap with fewer colors
n_bins = 100  # Number of color bins
colors = plt.cm.viridis(np.linspace(0, 1, n_bins))
cmap = LinearSegmentedColormap.from_list('custom_viridis', colors, N=n_bins)

# Create the heatmap
plt.figure(figsize=(12, 10))
plt.imshow(data, cmap=cmap, interpolation='nearest')
plt.colorbar(label='Value')
plt.title('Optimized Heatmap for Large Dataset - how2matplotlib.com', fontsize=16)
plt.xlabel('X-axis', fontsize=12)
plt.ylabel('Y-axis', fontsize=12)

# Add text to show data size
plt.text(0.5, -0.1, f'Data size: {data.shape[0]}x{data.shape[1]}', transform=plt.gca().transAxes, ha='center')

plt.show()

# Print optimization details
print("Optimization details:")
print(f"Data shape: {data.shape}")
print(f"Number of color bins: {n_bins}")
print("Interpolation method: nearest")
Output:
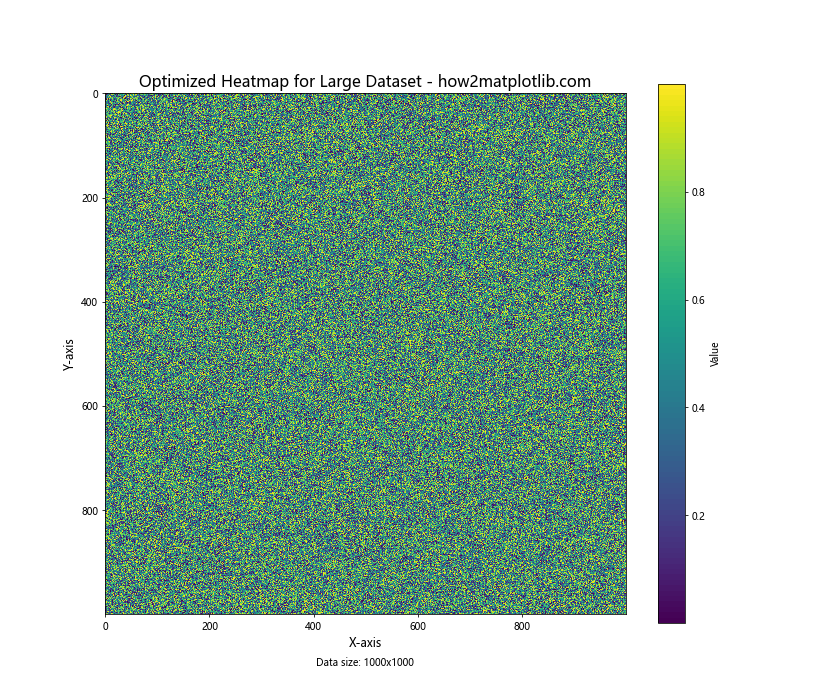
In this example, we’ve optimized the heatmap rendering for a large 1000×1000 dataset by:
- Using a custom colormap with fewer color bins to reduce memory usage.
- Using ‘nearest’ interpolation, which is faster than more complex methods.
- Avoiding unnecessary computations by not applying smoothing or additional effects.
These optimizations allow for faster rendering and lower memory usage when dealing with large datasets.
Matplotlib Heatmap Interpolation with Logarithmic Color Scaling
Sometimes, data may have a large range of values that are better represented on a logarithmic scale. Here’s how to create a heatmap with logarithmic color scaling:
import numpy as np
import matplotlib.pyplot as plt
from matplotlib.colors import LogNorm

# Generate sample data with exponential distribution
data = np.random.exponential(scale=1.0, size=(20, 20))

# Create the heatmap with logarithmic color scaling
plt.figure(figsize=(10, 8))
plt.imshow(data, cmap='viridis', norm=LogNorm(vmin=data.min(), vmax=data.max()), interpolation='bilinear')
plt.colorbar(label='Value (log scale)')
plt.title('Heatmap with Logarithmic Color Scaling - how2matplotlib.com', fontsize=16)
plt.xlabel('X-axis', fontsize=12)
plt.ylabel('Y-axis', fontsize=12)

plt.show()

# Print data statistics
print("Data statistics:")
print(f"Minimum value: {data.min():.4f}")
print(f"Maximum value: {data.max():.4f}")
print(f"Mean value: {data.mean():.4f}")
print(f"Median value: {np.median(data):.4f}")
Output:
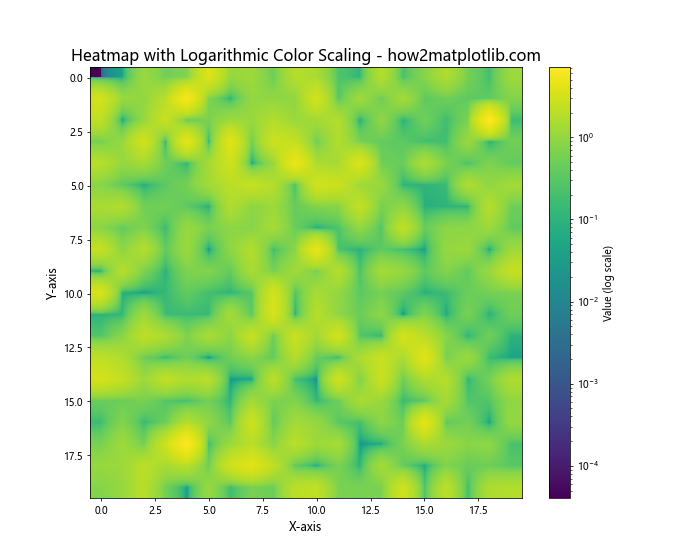
In this example, we use matplotlib.colors.LogNorm to apply logarithmic scaling to the color map. This is particularly useful for data with a wide range of values or when you want to emphasize relative changes in smaller values.
Matplotlib Heatmap Interpolation with Masked Arrays
Sometimes, you may want to exclude certain data points from your heatmap. Matplotlib supports masked arrays, which allow you to create heatmaps with “holes” in the data:
import numpy as np
import matplotlib.pyplot as plt
import numpy.ma as ma

# Generate sample data
data = np.random.rand(20, 20)

# Create a mask (True values will be masked)
mask = np.zeros_like(data, dtype=bool)
mask[5:15, 5:15] = True

# Apply the mask to the data
masked_data = ma.masked_array(data, mask)

# Create the heatmap
plt.figure(figsize=(10, 8))
plt.imshow(masked_data, cmap='viridis', interpolation='nearest')
plt.colorbar(label='Value')
plt.title('Heatmap with Masked Data - how2matplotlib.com', fontsize=16)
plt.xlabel('X-axis', fontsize=12)
plt.ylabel('Y-axis', fontsize=12)

plt.show()

# Print mask information
print("Mask information:")
print(f"Total cells: {data.size}")
print(f"Masked cells: {np.sum(mask)}")
print(f"Percentage masked: {np.sum(mask) / data.size * 100:.2f}%")
Output:
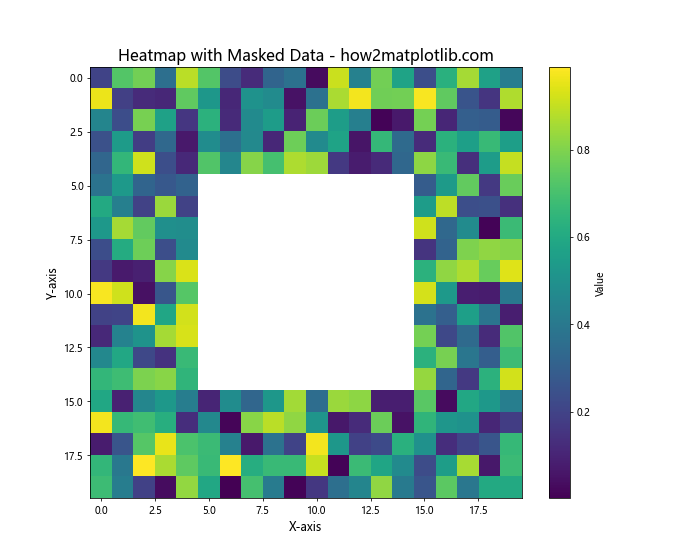
In this example, we create a masked array where a square region in the center is excluded from the heatmap. The masked region will appear as a “hole” in the plot, allowing you to focus on specific areas of interest or exclude unreliable data points.
Creating a Clustered Heatmap with Matplotlib
Clustered heatmaps are useful for visualizing hierarchical relationships in data. Here’s an example of creating a clustered heatmap using Matplotlib and scipy:
import numpy as np
import matplotlib.pyplot as plt
from scipy.cluster import hierarchy
from scipy.spatial import distance

# Generate sample data
np.random.seed(0)
data = np.random.rand(20, 20)

# Perform hierarchical clustering
row_linkage = hierarchy.linkage(distance.pdist(data), method='average')
col_linkage = hierarchy.linkage(distance.pdist(data.T), method='average')

# Reorder data based on clustering
row_order = hierarchy.dendrogram(row_linkage, no_plot=True)['leaves']
col_order = hierarchy.dendrogram(col_linkage, no_plot=True)['leaves']
data_clustered = data[row_order, :][:, col_order]

# Create the clustered heatmap
fig, ax = plt.subplots(figsize=(12, 10))
im = ax.imshow(data_clustered, cmap='viridis', aspect='auto', interpolation='nearest')
plt.colorbar(im, label='Value')
ax.set_title('Clustered Heatmap - how2matplotlib.com', fontsize=16)
ax.set_xlabel('Columns', fontsize=12)
ax.set_ylabel('Rows', fontsize=12)

# Add dendrograms
row_dendrogram = hierarchy.dendrogram(row_linkage, orientation='left', ax=ax, no_labels=True)
col_dendrogram = hierarchy.dendrogram(col_linkage, orientation='top', ax=ax, no_labels=True)

# Adjust layout and display
plt.tight_layout()
plt.show()

# Print clustering information
print("Clustering information:")
print(f"Number of rows: {data.shape[0]}")
print(f"Number of columns: {data.shape[1]}")
print("Clustering method: average linkage")
Output:
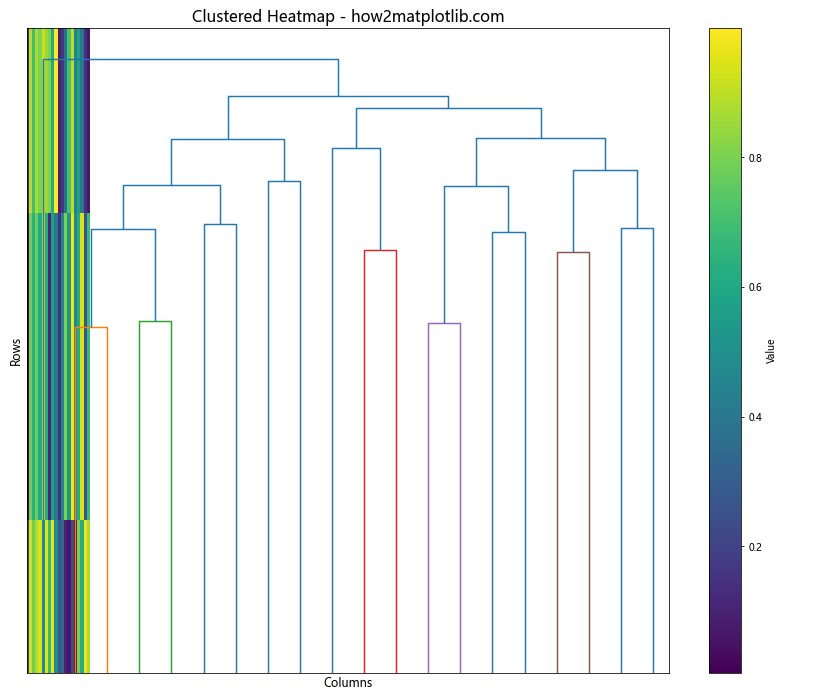
This example performs hierarchical clustering on both rows and columns of the data, then reorders the heatmap based on this clustering. Dendrograms are added to show the hierarchical relationships between rows and columns.
Matplotlib heatmap interpolation Conclusion
Matplotlib heatmap interpolation is a powerful tool for visualizing complex, multi-dimensional data. Throughout this article, we’ve explored various aspects of creating and customizing heatmaps, from basic plots to advanced techniques like clustering and animation. We’ve seen how interpolation can enhance the visual appeal of heatmaps and how different methods can be applied depending on the nature of the data and the desired outcome.
Key takeaways include:
- The importance of choosing the right interpolation method for your data.
- How to handle missing or masked data in heatmaps.
- Techniques for optimizing heatmaps for large datasets.
- Ways to combine heatmaps with other plot types for more comprehensive visualizations.
- Advanced applications like animated heatmaps and clustered heatmaps.
By mastering these techniques, you’ll be well-equipped to create informative and visually appealing heatmaps for a wide range of data visualization tasks. Remember to always consider your data’s characteristics and your audience’s needs when choosing how to represent your data through heatmaps and interpolation.