Mastering Matplotlib Errorbar Markers: A Comprehensive Guide
Matplotlib errorbar markers are essential components in data visualization, allowing you to represent uncertainty or variability in your data points. This comprehensive guide will explore the intricacies of using errorbar markers in Matplotlib, providing you with the knowledge and skills to create informative and visually appealing error plots.
Understanding Matplotlib Errorbar Markers
Errorbar markers in Matplotlib are used to indicate the range of uncertainty or variability associated with data points in a plot. They typically consist of vertical and/or horizontal lines extending from the data points, often capped with short perpendicular lines at their ends. These markers help viewers quickly assess the reliability and spread of the data being presented.
Let’s start with a basic example of how to create an errorbar plot with markers:
import matplotlib.pyplot as plt
import numpy as np

# Generate sample data
x = np.linspace(0, 10, 10)
y = np.sin(x)
yerr = 0.2 * np.random.rand(10)

# Create the errorbar plot
plt.figure(figsize=(10, 6))
plt.errorbar(x, y, yerr=yerr, fmt='o', markersize=8, capsize=5, label='Data')
plt.xlabel('X-axis')
plt.ylabel('Y-axis')
plt.title('Basic Errorbar Plot with Markers - how2matplotlib.com')
plt.legend()
plt.grid(True)
plt.show()

# Print the data
print("X values:", x)
print("Y values:", y)
print("Y error values:", yerr)
Output:
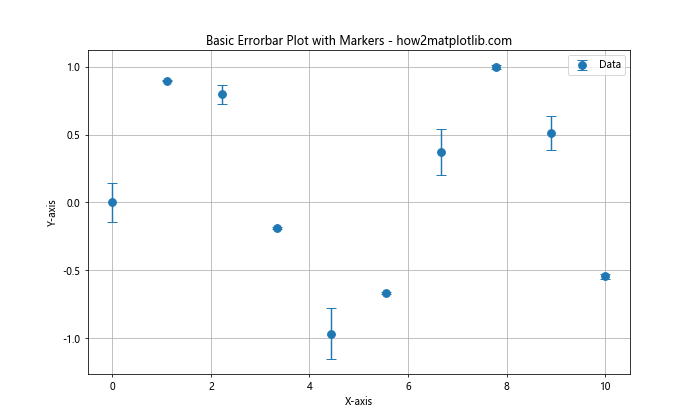
In this example, we create a basic errorbar plot using plt.errorbar(). The fmt='o' parameter specifies that we want to use circular markers for the data points. The markersize parameter sets the size of the markers, while capsize determines the length of the error bar caps. We also add labels, a title, a legend, and a grid to enhance the plot’s readability.
Customizing Matplotlib Errorbar Markers
One of the strengths of Matplotlib is its flexibility in customizing plot elements. Let’s explore various ways to customize errorbar markers:
Marker Styles
Matplotlib offers a wide range of marker styles that you can use for your errorbar plots. Here’s an example showcasing different marker styles:
import matplotlib.pyplot as plt
import numpy as np

# Generate sample data
x = np.arange(5)
y = np.random.rand(5)
yerr = 0.1 * np.random.rand(5)

# Define marker styles
marker_styles = ['o', 's', '^', 'D', 'p']

# Create the errorbar plot with different marker styles
plt.figure(figsize=(12, 6))
for i, marker in enumerate(marker_styles):
    plt.errorbar(x + i*0.1, y, yerr=yerr, fmt=marker, label=f'Style {marker}', capsize=5)

plt.xlabel('X-axis')
plt.ylabel('Y-axis')
plt.title('Errorbar Plot with Different Marker Styles - how2matplotlib.com')
plt.legend()
plt.grid(True)
plt.show()

# Print the data
print("X values:", x)
print("Y values:", y)
print("Y error values:", yerr)
Output:
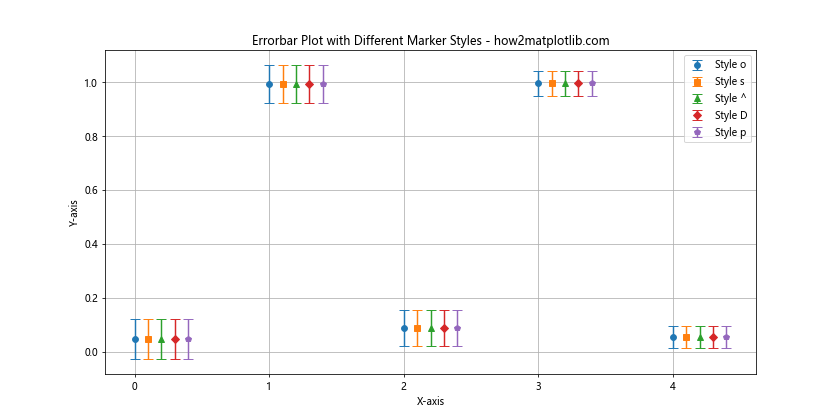
This example demonstrates five different marker styles: circle (‘o’), square (‘s’), triangle (‘^’), diamond (‘D’), and pentagon (‘p’). By using a loop, we create multiple errorbar series with different marker styles, slightly offsetting each series along the x-axis for clarity.
Marker Colors and Sizes
You can further customize the appearance of errorbar markers by adjusting their colors and sizes:
import matplotlib.pyplot as plt
import numpy as np

# Generate sample data
x = np.linspace(0, 10, 5)
y = np.exp(-x/10)
yerr = 0.1 * np.random.rand(5)

# Create the errorbar plot with custom marker colors and sizes
plt.figure(figsize=(10, 6))
plt.errorbar(x, y, yerr=yerr, fmt='o', markersize=12, markerfacecolor='red',
             markeredgecolor='black', markeredgewidth=2, capsize=5,
             ecolor='blue', elinewidth=2, label='Data')

plt.xlabel('X-axis')
plt.ylabel('Y-axis')
plt.title('Errorbar Plot with Custom Marker Colors and Sizes - how2matplotlib.com')
plt.legend()
plt.grid(True)
plt.show()

# Print the data
print("X values:", x)
print("Y values:", y)
print("Y error values:", yerr)
Output:
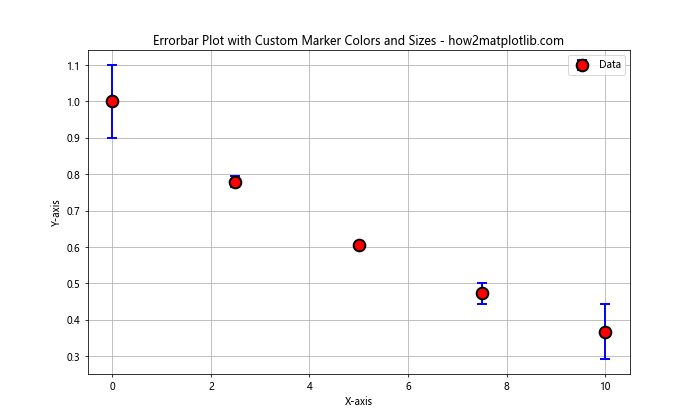
In this example, we use larger markers (markersize=12) with a red face color (markerfacecolor='red') and a black edge (markeredgecolor='black'). We also increase the marker edge width (markeredgewidth=2) for better visibility. The error bars are colored blue (ecolor='blue') and their width is increased (elinewidth=2).
Asymmetric Error Bars
Sometimes, your data may have asymmetric errors. Matplotlib allows you to specify different upper and lower error values:
import matplotlib.pyplot as plt
import numpy as np

# Generate sample data
x = np.linspace(0, 10, 5)
y = np.sin(x)
yerr_lower = 0.1 * np.random.rand(5)
yerr_upper = 0.2 * np.random.rand(5)

# Create the errorbar plot with asymmetric errors
plt.figure(figsize=(10, 6))
plt.errorbar(x, y, yerr=[yerr_lower, yerr_upper], fmt='s', markersize=8,
             capsize=5, label='Asymmetric Errors')

plt.xlabel('X-axis')
plt.ylabel('Y-axis')
plt.title('Errorbar Plot with Asymmetric Errors - how2matplotlib.com')
plt.legend()
plt.grid(True)
plt.show()

# Print the data
print("X values:", x)
print("Y values:", y)
print("Lower Y error values:", yerr_lower)
print("Upper Y error values:", yerr_upper)
Output:
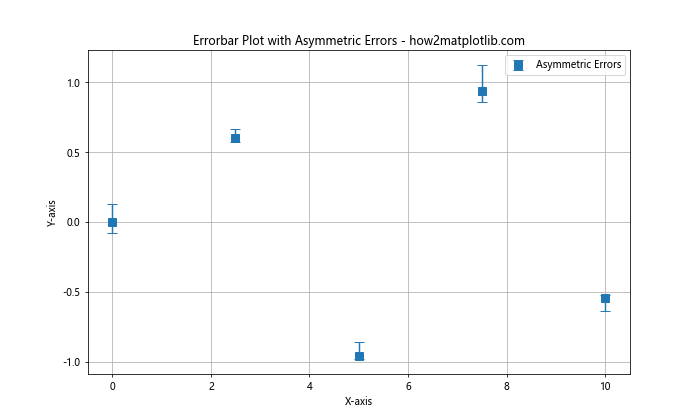
In this example, we create asymmetric error bars by passing a list of two arrays to the yerr parameter. The first array (yerr_lower) represents the lower errors, while the second array (yerr_upper) represents the upper errors.
Advanced Matplotlib Errorbar Marker Techniques
Now that we’ve covered the basics, let’s explore some advanced techniques for working with errorbar markers in Matplotlib.
Combining Errorbar Plots with Other Plot Types
You can combine errorbar plots with other types of plots to create more informative visualizations. Here’s an example that combines an errorbar plot with a line plot:
import matplotlib.pyplot as plt
import numpy as np

# Generate sample data
x = np.linspace(0, 10, 20)
y1 = np.sin(x)
y2 = np.cos(x)
yerr1 = 0.1 * np.random.rand(20)
yerr2 = 0.1 * np.random.rand(20)

# Create the combined plot
plt.figure(figsize=(12, 6))
plt.errorbar(x, y1, yerr=yerr1, fmt='o', markersize=6, capsize=4, label='Sin(x)')
plt.plot(x, y1, 'b-', linewidth=2)
plt.errorbar(x, y2, yerr=yerr2, fmt='s', markersize=6, capsize=4, label='Cos(x)')
plt.plot(x, y2, 'r-', linewidth=2)

plt.xlabel('X-axis')
plt.ylabel('Y-axis')
plt.title('Combined Errorbar and Line Plot - how2matplotlib.com')
plt.legend()
plt.grid(True)
plt.show()

# Print the data
print("X values:", x)
print("Y1 values:", y1)
print("Y2 values:", y2)
print("Y1 error values:", yerr1)
print("Y2 error values:", yerr2)
Output:
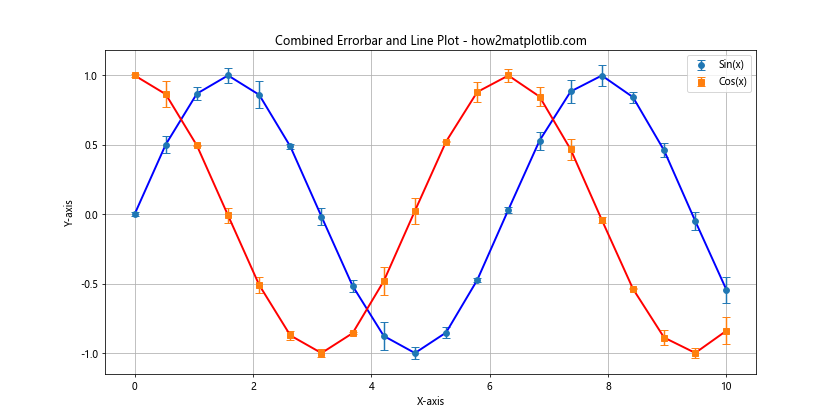
This example creates a plot with two data series, each represented by both an errorbar plot and a line plot. The errorbar markers show the uncertainty in the data points, while the lines help visualize the overall trend.
Using Errorbar Markers in Subplots
When working with multiple datasets, it’s often useful to create subplots. Here’s an example of how to use errorbar markers in a subplot layout:
import matplotlib.pyplot as plt
import numpy as np

# Generate sample data
x = np.linspace(0, 10, 10)
y1 = np.sin(x)
y2 = np.cos(x)
y3 = np.tan(x)
yerr = 0.1 * np.random.rand(10)

# Create the subplot layout
fig, (ax1, ax2, ax3) = plt.subplots(3, 1, figsize=(10, 12), sharex=True)

# Plot data in subplots
ax1.errorbar(x, y1, yerr=yerr, fmt='o', capsize=4, label='Sin(x)')
ax1.set_ylabel('Sin(x)')
ax1.legend()

ax2.errorbar(x, y2, yerr=yerr, fmt='s', capsize=4, label='Cos(x)')
ax2.set_ylabel('Cos(x)')
ax2.legend()

ax3.errorbar(x, y3, yerr=yerr, fmt='^', capsize=4, label='Tan(x)')
ax3.set_ylabel('Tan(x)')
ax3.set_xlabel('X-axis')
ax3.legend()

plt.suptitle('Errorbar Plots in Subplots - how2matplotlib.com', fontsize=16)
plt.tight_layout()
plt.show()

# Print the data
print("X values:", x)
print("Y1 values:", y1)
print("Y2 values:", y2)
print("Y3 values:", y3)
print("Y error values:", yerr)
Output:
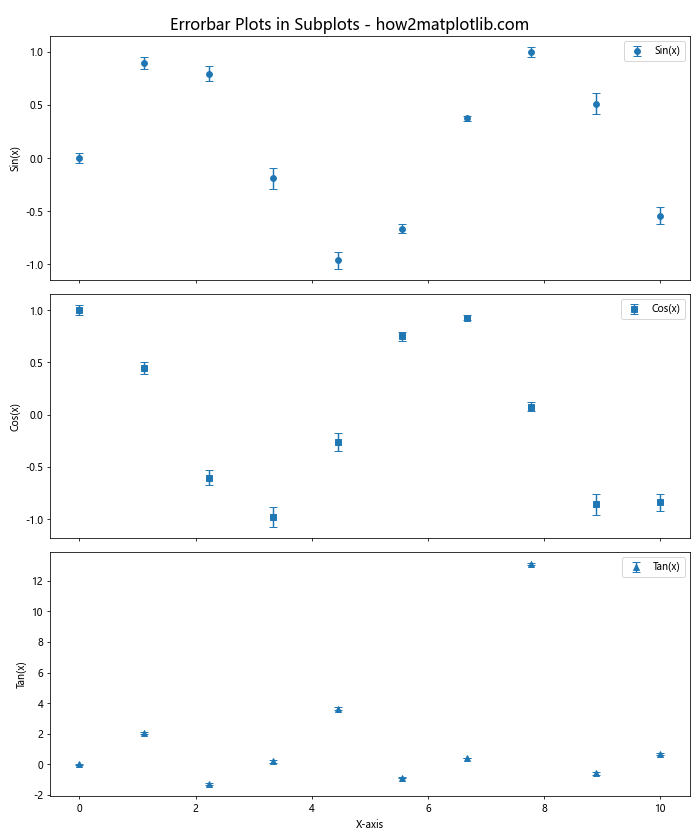
This example creates three subplots, each containing an errorbar plot for a different trigonometric function. The sharex=True parameter ensures that all subplots share the same x-axis scale.
Customizing Error Bar Caps
You can further customize the appearance of error bar caps to make your plots more distinctive:
import matplotlib.pyplot as plt
import numpy as np

# Generate sample data
x = np.linspace(0, 10, 5)
y = np.exp(-x/5)
yerr = 0.1 * np.random.rand(5)

# Create the errorbar plot with custom caps
plt.figure(figsize=(10, 6))
plt.errorbar(x, y, yerr=yerr, fmt='o', markersize=8, capsize=10,
             capthick=2, ecolor='red', elinewidth=2, label='Data')

plt.xlabel('X-axis')
plt.ylabel('Y-axis')
plt.title('Errorbar Plot with Custom Caps - how2matplotlib.com')
plt.legend()
plt.grid(True)
plt.show()

# Print the data
print("X values:", x)
print("Y values:", y)
print("Y error values:", yerr)
Output:
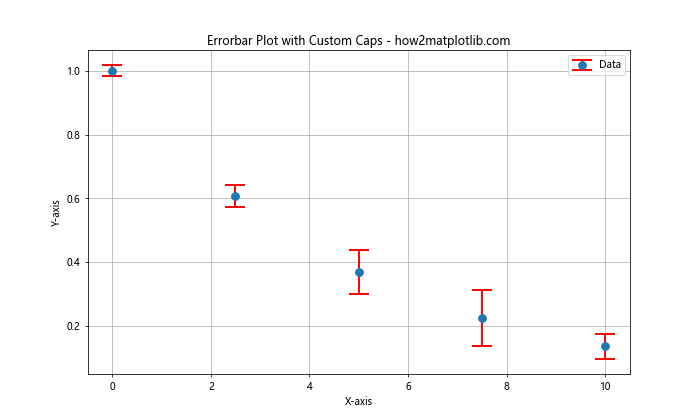
In this example, we use capsize=10 to make the error bar caps longer, and capthick=2 to make them thicker. We also set the error bar color to red (ecolor='red') and increase their width (elinewidth=2) for better visibility.
Handling Large Datasets with Matplotlib Errorbar Markers
When working with large datasets, plotting individual errorbar markers for each data point can become cluttered and computationally expensive. Here are some techniques to handle large datasets effectively:
Using Alpha Transparency
One way to handle overlapping errorbar markers is to use alpha transparency:
import matplotlib.pyplot as plt
import numpy as np

# Generate a large sample dataset
np.random.seed(42)
x = np.linspace(0, 10, 1000)
y = np.sin(x) + 0.1 * np.random.randn(1000)
yerr = 0.2 * np.random.rand(1000)

# Create the errorbar plot with alpha transparency
plt.figure(figsize=(12, 6))
plt.errorbar(x, y, yerr=yerr, fmt='.', markersize=2, capsize=0,
             alpha=0.1, ecolor='gray', label='Data')

plt.xlabel('X-axis')
plt.ylabel('Y-axis')
plt.title('Errorbar Plot with Alpha Transparency - how2matplotlib.com')
plt.legend()
plt.grid(True)
plt.show()

# Print the first few data points
print("First 5 X values:", x[:5])
print("First 5 Y values:", y[:5])
print("First 5 Y error values:", yerr[:5])
Output:
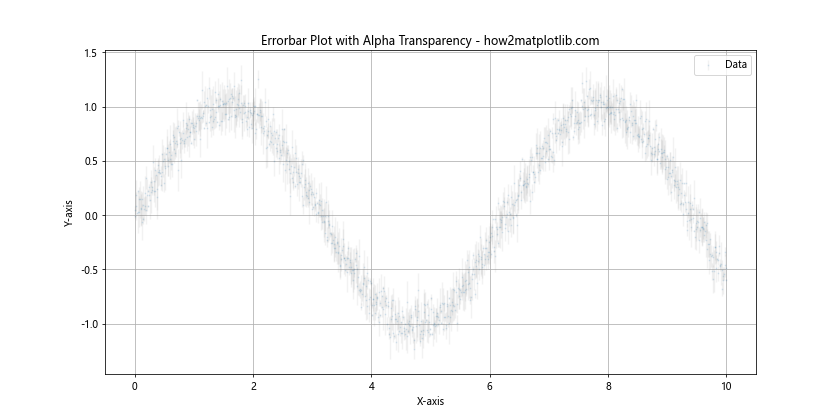
In this example, we use alpha=0.1 to make the errorbar markers semi-transparent. This allows us to see the density of data points in different regions of the plot. We also use smaller markers (markersize=2) and remove the caps (capsize=0) to reduce clutter.
Sampling or Binning Data
For very large datasets, you might want to sample or bin your data before plotting:
import matplotlib.pyplot as plt
import numpy as np

# Generate a large sample dataset
np.random.seed(42)
x = np.linspace(0, 10, 10000)
y = np.sin(x) + 0.1 * np.random.randn(10000)
yerr = 0.2 * np.random.rand(10000)

# Bin the data
bins = np.linspace(0, 10, 50)
digitized = np.digitize(x, bins)
bin_means = [y[digitized == i].mean() for i in range(1, len(bins))]
bin_errors = [yerr[digitized == i].mean() for i in range(1, len(bins))]

# Create the errorbar plot with binned data
plt.figure(figsize=(12, 6))
plt.errorbar(bins[1:], bin_means, yerr=bin_errors, fmt='o', markersize=6,
             capsize=4, label='Binned Data')

plt.xlabel('X-axis')
plt.ylabel('Y-axis')
plt.title('Errorbar Plot with Binned Data - how2matplotlib.com')
plt.legend()
plt.grid(True)
plt.show()

# Print the first few binned data points
print("First 5 bin centers:", bins[1:6])
print("First 5 bin means:", bin_means[:5])
print("First 5 bin errors:", bin_errors[:5])
Output:
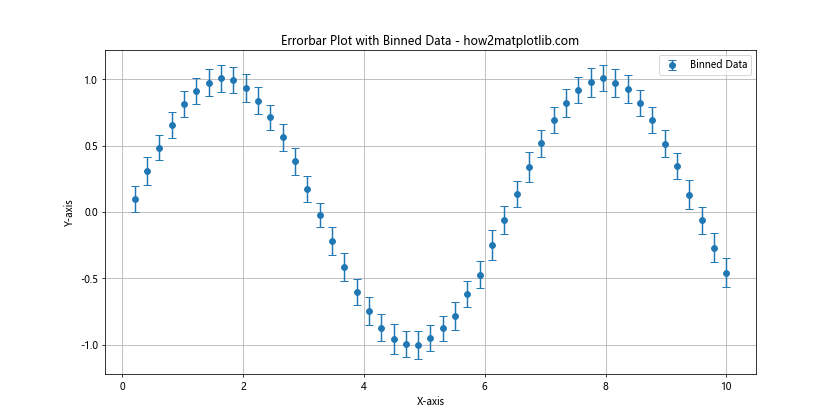
In this example, we bin the data into 50 bins along the x-axis. We then calculate the mean y-value and mean error for each bin. This approach significantly reduces the number of points we need to plot while still representing the overall trend and uncertainty in the data.
Matplotlib Errorbar Markers in 3D Plots
While errorbar markers are most commonly used in 2D plots, Matplotlib also supports errorbar markers in 3D plots. Here’s an example of how to create a 3D errorbar plot:
import matplotlib.pyplot as plt
import numpy as np
from mpl_toolkits.mplot3d import Axes3D

# Generate sample data
np.random.seed(42)
x = np.random.rand(20)
y = np.random.rand(20)
z = np.random.rand(20)
zerr = 0.1 * np.random.rand(20)

# Create the 3D errorbar plot
fig = plt.figure(figsize=(10, 8))
ax = fig.add_subplot(111, projection='3d')

ax.errorbar(x, y, z, zerr=zerr, fmt='o', markersize=8, capsize=4,
             ecolor='red', label='Data Points')

ax.set_xlabel('X-axis')
ax.set_ylabel('Y-axis')
ax.set_zlabel('Z-axis')
ax.set_title('3D Errorbar Plot - how2matplotlib.com')
ax.legend()

plt.show()

# Print the first few data points
print("First 5 X values:", x[:5])
print("First 5 Y values:", y[:5])
print("First 5 Z values:", z[:5])
print("First 5 Z error values:", zerr[:5])
Output:
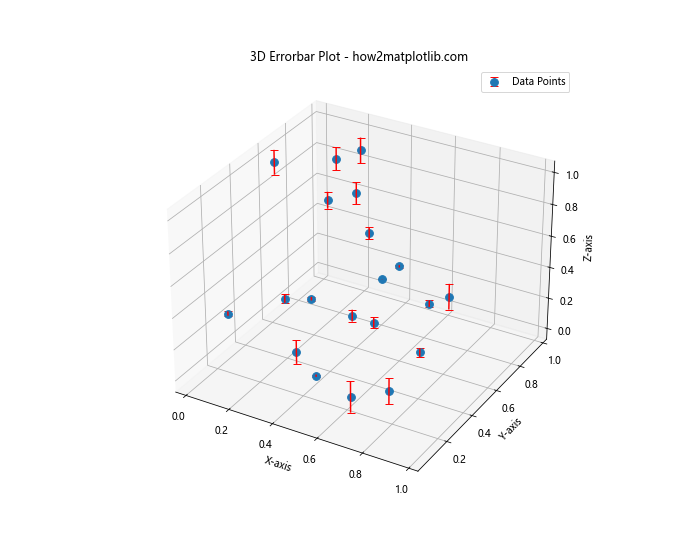
In this 3D errorbar plot example, we use the mpl_toolkits.mplot3d module to create a 3D axis. The errorbar() function is used with the zerr parameter to specify the errors in the z-direction. Note that in 3D plots, you can only show error bars in one direction (typically the z-direction) at a time.
Combining Matplotlib Errorbar Markers with Statistical Information
Errorbar markers are often used to represent statistical information such as confidence intervals or standard deviations. Let’s explore how to combine errorbar markers with statistical calculations:
Plotting Mean and Standard Deviation
Here’s an example of how to plot the mean and standard deviation of multiple measurements:
import matplotlib.pyplot as plt
import numpy as np

# Generate sample data
np.random.seed(42)
x = np.arange(5)
y = np.random.rand(3, 5)

# Calculate mean and standard deviation
y_mean = np.mean(y, axis=0)
y_std = np.std(y, axis=0)

# Create the errorbar plot
plt.figure(figsize=(10, 6))
plt.errorbar(x, y_mean, yerr=y_std, fmt='o', markersize=8, capsize=6,
             label='Mean with Std Dev')

plt.xlabel('X-axis')
plt.ylabel('Y-axis')
plt.title('Mean and Standard Deviation Errorbar Plot - how2matplotlib.com')
plt.legend()
plt.grid(True)
plt.show()

# Print the data
print("X values:", x)
print("Y values:")
print(y)
print("Y mean values:", y_mean)
print("Y standard deviation values:", y_std)
Output:
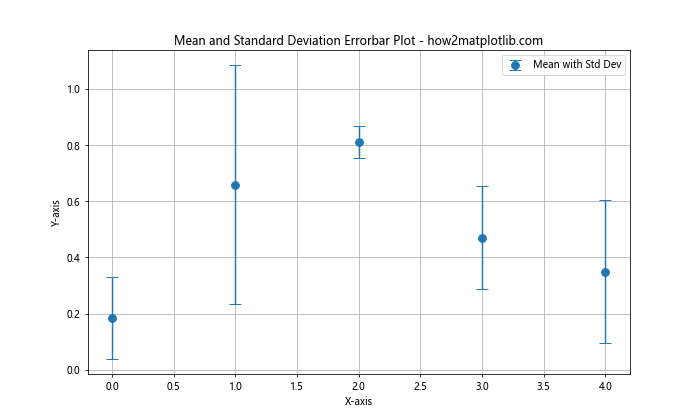
In this example, we generate multiple measurements for each x-value. We then calculate the mean and standard deviation of these measurements using NumPy’s mean() and std() functions. The errorbar plot shows the mean values as markers and the standard deviations as error bars.
Plotting Confidence Intervals
You can also use errorbar markers to represent confidence intervals:
import matplotlib.pyplot as plt
import numpy as np
from scipy import stats

# Generate sample data
np.random.seed(42)
x = np.arange(5)
y = np.random.normal(loc=5, scale=2, size=(100, 5))

# Calculate mean and 95% confidence interval
y_mean = np.mean(y, axis=0)
y_ci = stats.t.interval(alpha=0.95, df=len(y)-1, loc=y_mean, scale=stats.sem(y))

# Create the errorbar plot
plt.figure(figsize=(10, 6))
plt.errorbar(x, y_mean, yerr=(y_mean-y_ci[0], y_ci[1]-y_mean), fmt='o',
             markersize=8, capsize=6, label='Mean with 95% CI')

plt.xlabel('X-axis')
plt.ylabel('Y-axis')
plt.title('Mean and 95% Confidence Interval Errorbar Plot - how2matplotlib.com')
plt.legend()
plt.grid(True)
plt.show()

# Print the data
print("X values:", x)
print("Y mean values:", y_mean)
print("Y 95% confidence interval:", y_ci)
In this example, we use SciPy’s stats.t.interval() function to calculate the 95% confidence interval for our data. The errorbar plot shows the mean values as markers and the confidence intervals as error bars.
Customizing Matplotlib Errorbar Marker Appearance
Matplotlib offers extensive customization options for errorbar markers. Let’s explore some advanced customization techniques:
Using Custom Markers
You can use custom markers for your errorbar plots by defining your own marker shapes:
import matplotlib.pyplot as plt
import numpy as np

# Define a custom marker
custom_marker = {
    'marker': r'$\clubsuit$',
    'markersize': 15,
    'markerfacecolor': 'green',
    'markeredgecolor': 'black',
    'markeredgewidth': 1
}

# Generate sample data
x = np.linspace(0, 10, 10)
y = np.sin(x)
yerr = 0.2 * np.random.rand(10)

# Create the errorbar plot with custom markers
plt.figure(figsize=(10, 6))
plt.errorbar(x, y, yerr=yerr, fmt='', capsize=5, **custom_marker, label='Data')

plt.xlabel('X-axis')
plt.ylabel('Y-axis')
plt.title('Errorbar Plot with Custom Markers - how2matplotlib.com')
plt.legend()
plt.grid(True)
plt.show()

# Print the data
print("X values:", x)
print("Y values:", y)
print("Y error values:", yerr)
Output:
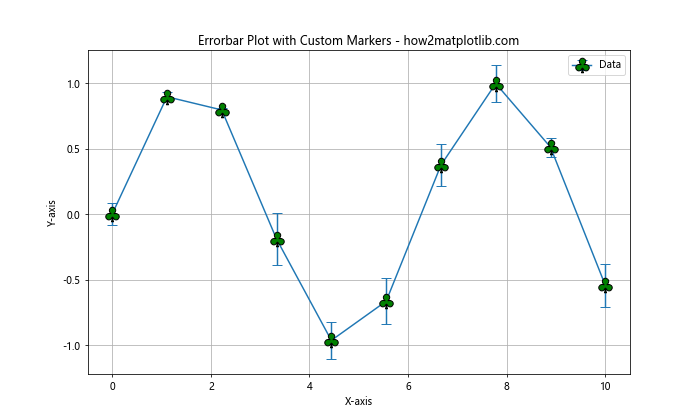
In this example, we define a custom marker using a LaTeX symbol (a club suit). We then pass this custom marker definition to the errorbar() function using the ** operator to unpack the dictionary.
Styling Error Bars
You can further customize the appearance of the error bars themselves:
import matplotlib.pyplot as plt
import numpy as np

# Generate sample data
x = np.linspace(0, 10, 5)
y = np.exp(-x/5)
yerr = 0.1 * np.random.rand(5)

# Create the errorbar plot with styled error bars
plt.figure(figsize=(10, 6))
plt.errorbar(x, y, yerr=yerr, fmt='o', markersize=8,
             capsize=8, capthick=2,
             ecolor='red', elinewidth=2,
             barsabove=True, errorevery=2,
             label='Data')

plt.xlabel('X-axis')
plt.ylabel('Y-axis')
plt.title('Errorbar Plot with Styled Error Bars - how2matplotlib.com')
plt.legend()
plt.grid(True)
plt.show()

# Print the data
print("X values:", x)
print("Y values:", y)
print("Y error values:", yerr)
Output:
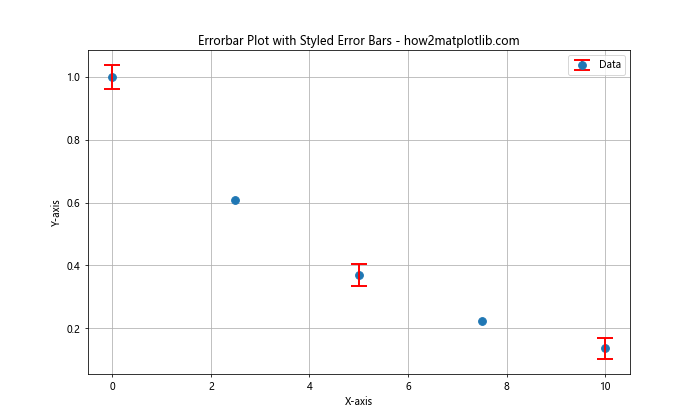
In this example, we use several parameters to style the error bars:
capsizeandcapthickcontrol the size and thickness of the error bar caps.ecolorandelinewidthset the color and width of the error bars.barsabove=Trueplaces the error bars above the markers.errorevery=2only shows error bars for every second data point.
Handling Missing Data in Matplotlib Errorbar Plots
When working with real-world data, you may encounter missing or invalid values. Matplotlib provides ways to handle such cases in errorbar plots:
import matplotlib.pyplot as plt
import numpy as np

# Generate sample data with missing values
x = np.linspace(0, 10, 10)
y = np.sin(x)
y[3] = np.nan  # Set one value as NaN
yerr = 0.1 * np.random.rand(10)
yerr[7] = np.nan  # Set one error value as NaN

# Create the errorbar plot with missing data
plt.figure(figsize=(10, 6))
plt.errorbar(x, y, yerr=yerr, fmt='o', markersize=8, capsize=5,
             label='Data', linestyle='--')

plt.xlabel('X-axis')
plt.ylabel('Y-axis')
plt.title('Errorbar Plot with Missing Data - how2matplotlib.com')
plt.legend()
plt.grid(True)
plt.show()

# Print the data
print("X values:", x)
print("Y values:", y)
print("Y error values:", yerr)
Output:
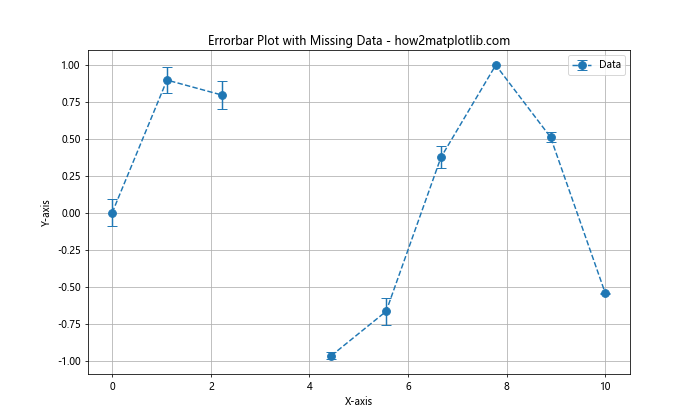
In this example, we intentionally set one y-value and one error value to NaN (Not a Number). Matplotlib automatically handles these missing values by not plotting the corresponding points or error bars.
Matplotlib errorbar markers Conclusion
Matplotlib errorbar markers are powerful tools for visualizing data uncertainty and variability. This comprehensive guide has covered a wide range of techniques for creating, customizing, and working with errorbar plots in various scenarios. From basic plots to advanced customizations, 3D visualizations, and animations, you now have the knowledge to create informative and visually appealing errorbar plots using Matplotlib.
Remember that the key to effective data visualization is not just in the technical implementation, but also in choosing the right representation for your data and audience. Errorbar plots can be particularly useful in scientific and statistical contexts where communicating uncertainty is crucial.
As you continue to work with Matplotlib errorbar markers, don’t hesitate to experiment with different combinations of styles, colors, and layouts to find the best way to represent your specific data. The flexibility of Matplotlib allows for endless possibilities in data visualization, and errorbar markers are just one of the many tools at your disposal.