Matplotlib cmap darker red
Matplotlib is a powerful plotting library for Python that offers a wide range of customization options for creating visually appealing and informative plots. One of the key features of Matplotlib is its ability to use color maps (cmaps) to represent data in various ways. In this article, we will explore the concept of creating and using darker red color maps in Matplotlib, with a focus on how to create custom color maps, modify existing ones, and apply them to different types of plots.
Understanding Color Maps in Matplotlib
Before diving into the specifics of darker red color maps, it’s essential to understand what color maps are and how they work in Matplotlib. A color map is a predefined set of colors that can be used to represent data values in a plot. Color maps are particularly useful for visualizing continuous data, such as in heatmaps, contour plots, or 3D surface plots.
Matplotlib provides a wide range of built-in color maps, including sequential, diverging, and qualitative color maps. However, sometimes you may need to create custom color maps or modify existing ones to better suit your specific visualization needs.
Creating a Custom Darker Red Color Map
To create a custom darker red color map, we can use the LinearSegmentedColormap class from Matplotlib’s colors module. This allows us to define a color map with specific colors at different points along the color scale.
Let’s start with a simple example of creating a custom darker red color map:
import matplotlib.pyplot as plt
import numpy as np
from matplotlib.colors import LinearSegmentedColormap

# Define the colors for our custom color map
colors = ['#800000', '#A00000', '#C00000', '#E00000', '#FF0000']

# Create the custom color map
cmap_name = 'custom_darker_red'
n_bins = 100  # Number of discrete color levels
cmap = LinearSegmentedColormap.from_list(cmap_name, colors, N=n_bins)

# Generate some sample data
data = np.random.rand(10, 10)

# Create a figure and plot the data using the custom color map
fig, ax = plt.subplots(figsize=(8, 6))
im = ax.imshow(data, cmap=cmap)
plt.colorbar(im)

plt.title('Custom Darker Red Color Map - how2matplotlib.com')
plt.show()

print("Custom darker red color map created and applied to the plot.")
Output:
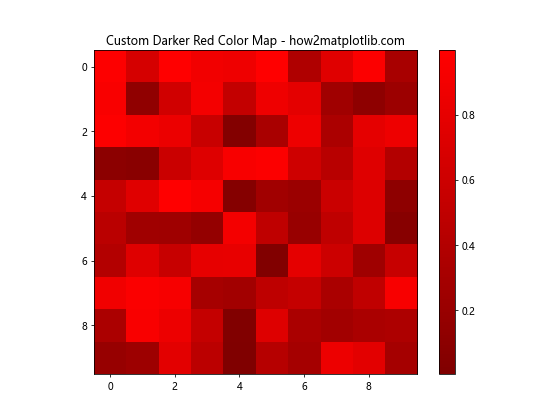
In this example, we define a list of colors ranging from dark red (#800000) to bright red (#FF0000). We then create a custom color map using LinearSegmentedColormap.from_list(), specifying the name of the color map, the list of colors, and the number of discrete color levels.
We generate some random data and use imshow() to create a heatmap-style plot with our custom color map. The colorbar() function adds a color scale to the plot, showing the range of values represented by the color map.
Modifying Existing Color Maps
Matplotlib provides several built-in color maps that can be modified to create darker red variations. One approach is to use the LinearSegmentedColormap.from_list() method with a subset of colors from an existing color map.
Here’s an example of creating a darker red version of the ‘Reds’ color map:
import matplotlib.pyplot as plt
import numpy as np
from matplotlib.colors import LinearSegmentedColormap

# Get the 'Reds' color map
reds = plt.cm.Reds

# Create a darker red version by selecting a subset of colors
darker_reds = LinearSegmentedColormap.from_list('darker_reds', reds(np.linspace(0.2, 0.8, 100)))

# Generate some sample data
x = np.linspace(0, 10, 100)
y = np.linspace(0, 10, 100)
X, Y = np.meshgrid(x, y)
Z = np.sin(X) * np.cos(Y)

# Create a figure and plot the data using the modified color map
fig, ax = plt.subplots(figsize=(10, 8))
im = ax.pcolormesh(X, Y, Z, cmap=darker_reds, shading='auto')
plt.colorbar(im)

plt.title('Modified Darker Reds Color Map - how2matplotlib.com')
plt.show()

print("Modified darker reds color map created and applied to the plot.")
Output:
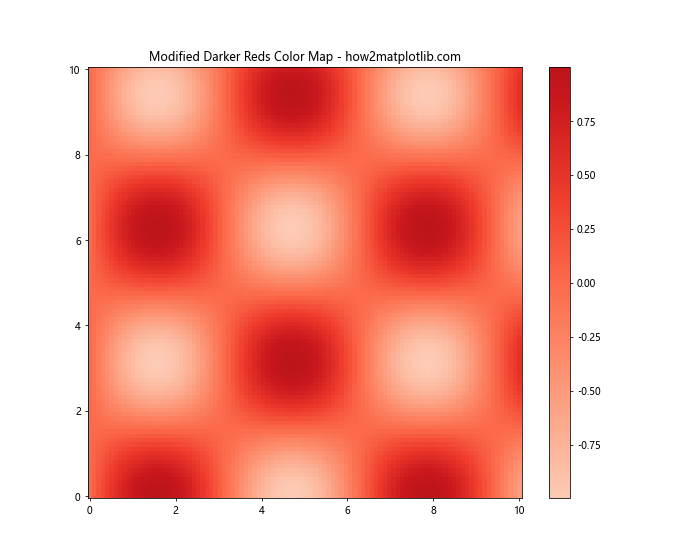
In this example, we start with the built-in ‘Reds’ color map and create a darker version by selecting a subset of colors using np.linspace(0.2, 0.8, 100). This effectively removes the lightest and darkest colors from the original map, resulting in a darker overall appearance.
We then apply this modified color map to a 2D sinusoidal pattern using pcolormesh().
Creating a Diverging Darker Red Color Map
Diverging color maps are useful for highlighting deviations from a central value. We can create a custom diverging color map that emphasizes darker reds for positive values and another color for negative values.
Here’s an example of creating a diverging color map with darker reds and blues:
import matplotlib.pyplot as plt
import numpy as np
from matplotlib.colors import LinearSegmentedColormap

# Define colors for the diverging map
colors = ['#000080', '#0000FF', '#FFFFFF', '#800000', '#FF0000']

# Create the custom diverging color map
cmap_name = 'custom_diverging_darker_red'
n_bins = 100
cmap = LinearSegmentedColormap.from_list(cmap_name, colors, N=n_bins)

# Generate sample data with positive and negative values
x = np.linspace(-5, 5, 100)
y = np.linspace(-5, 5, 100)
X, Y = np.meshgrid(x, y)
Z = X * np.exp(-X**2 - Y**2)

# Create a figure and plot the data using the custom diverging color map
fig, ax = plt.subplots(figsize=(10, 8))
im = ax.pcolormesh(X, Y, Z, cmap=cmap, shading='auto')
plt.colorbar(im)

plt.title('Custom Diverging Darker Red Color Map - how2matplotlib.com')
plt.show()

print("Custom diverging darker red color map created and applied to the plot.")
Output:
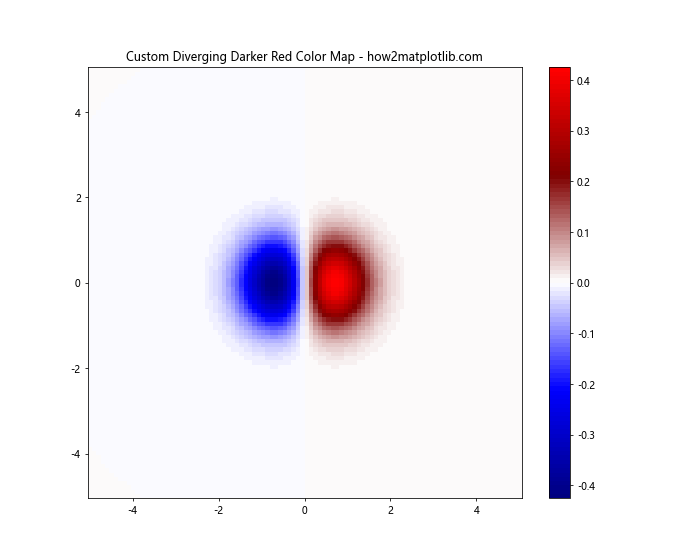
In this example, we create a diverging color map that transitions from dark blue to white to dark red. This color map is then applied to a 2D function that has both positive and negative values, clearly showing the transition between the two.
Applying Darker Red Color Maps to Different Plot Types
Now that we’ve explored various ways to create and modify darker red color maps, let’s look at how to apply them to different types of plots in Matplotlib.
Heatmap with Darker Red Color Map
Heatmaps are an excellent way to visualize 2D data, and darker red color maps can be particularly effective for highlighting high-intensity areas.
import matplotlib.pyplot as plt
import numpy as np
from matplotlib.colors import LinearSegmentedColormap

# Create a custom darker red color map
colors = ['#400000', '#800000', '#C00000', '#FF0000']
cmap_name = 'custom_darker_red'
cmap = LinearSegmentedColormap.from_list(cmap_name, colors, N=100)

# Generate sample data
data = np.random.rand(20, 20)

# Create a figure and plot the heatmap
fig, ax = plt.subplots(figsize=(10, 8))
im = ax.imshow(data, cmap=cmap)
plt.colorbar(im)

# Add labels and title
ax.set_xticks(np.arange(data.shape[1]))
ax.set_yticks(np.arange(data.shape[0]))
ax.set_xticklabels([f'X{i}' for i in range(data.shape[1])])
ax.set_yticklabels([f'Y{i}' for i in range(data.shape[0])])
plt.setp(ax.get_xticklabels(), rotation=45, ha="right", rotation_mode="anchor")

plt.title('Heatmap with Custom Darker Red Color Map - how2matplotlib.com')
plt.tight_layout()
plt.show()

print("Heatmap with custom darker red color map created.")
Output:
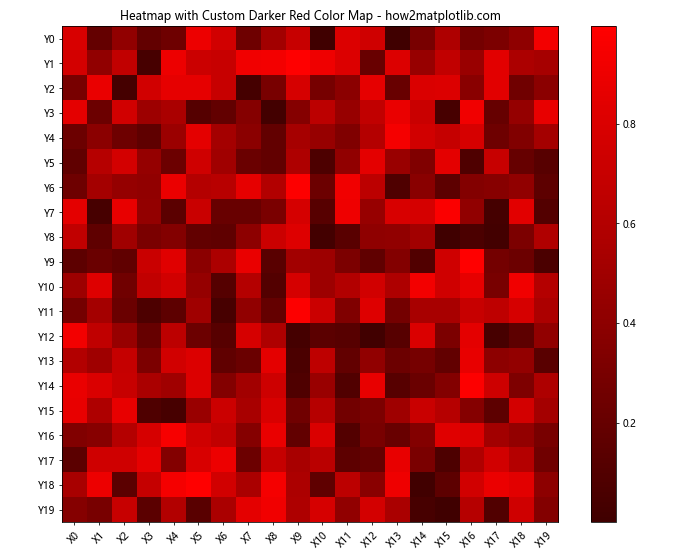
In this example, we create a custom darker red color map and apply it to a heatmap of random data. The imshow() function is used to display the data as a heatmap, and we add labels to the x and y axes for better readability.
3D Surface Plot with Darker Red Color Map
3D surface plots can benefit from darker red color maps to emphasize the height and contours of the surface.
import matplotlib.pyplot as plt
import numpy as np
from matplotlib import cm
from mpl_toolkits.mplot3d import Axes3D

# Generate sample data
X = np.arange(-5, 5, 0.25)
Y = np.arange(-5, 5, 0.25)
X, Y = np.meshgrid(X, Y)
R = np.sqrt(X**2 + Y**2)
Z = np.sin(R)

# Create a figure and 3D axes
fig = plt.figure(figsize=(12, 9))
ax = fig.add_subplot(111, projection='3d')

# Plot the surface with a darker red color map
surf = ax.plot_surface(X, Y, Z, cmap=cm.Reds_r, linewidth=0, antialiased=False)

# Add a color bar
fig.colorbar(surf, shrink=0.5, aspect=5)

# Set labels and title
ax.set_xlabel('X axis')
ax.set_ylabel('Y axis')
ax.set_zlabel('Z axis')
ax.set_title('3D Surface Plot with Darker Red Color Map - how2matplotlib.com')

plt.show()

print("3D surface plot with darker red color map created.")
Output:
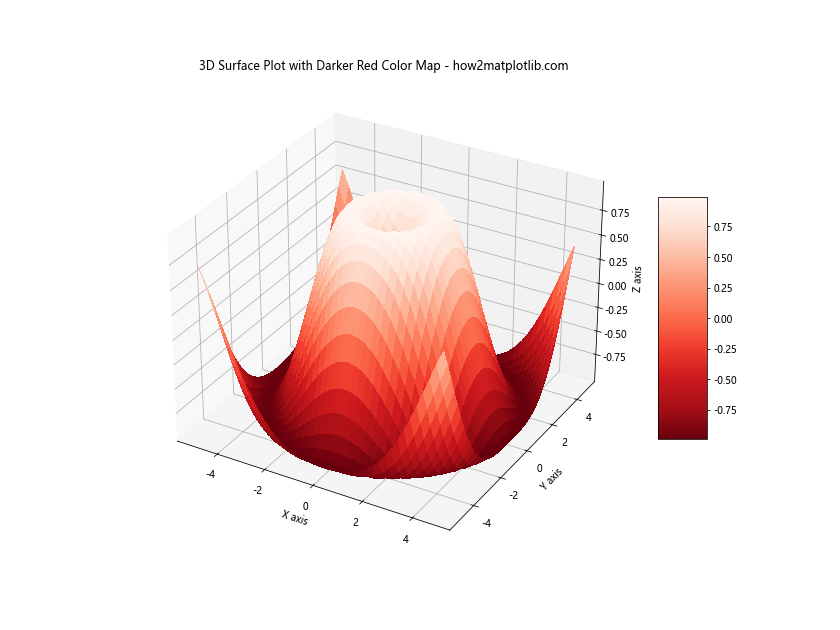
In this example, we use the reversed ‘Reds’ color map (cm.Reds_r) to create a 3D surface plot of a sinusoidal function. The darker reds at the top of the color map help emphasize the peaks of the surface.
Contour Plot with Darker Red Color Map
Contour plots can use darker red color maps to highlight areas of high intensity or value.
import matplotlib.pyplot as plt
import numpy as np
from matplotlib.colors import LinearSegmentedColormap

# Create a custom darker red color map
colors = ['#200000', '#400000', '#600000', '#800000', '#A00000', '#C00000', '#E00000', '#FF0000']
cmap_name = 'custom_darker_red'
cmap = LinearSegmentedColormap.from_list(cmap_name, colors, N=100)

# Generate sample data
x = np.linspace(-3, 3, 100)
y = np.linspace(-3, 3, 100)
X, Y = np.meshgrid(x, y)
Z = np.sin(X) * np.cos(Y)

# Create a figure and plot the contour
fig, ax = plt.subplots(figsize=(10, 8))
contour = ax.contourf(X, Y, Z, 20, cmap=cmap)
plt.colorbar(contour)

# Add labels and title
ax.set_xlabel('X axis')
ax.set_ylabel('Y axis')
plt.title('Contour Plot with Custom Darker Red Color Map - how2matplotlib.com')

plt.show()

print("Contour plot with custom darker red color map created.")
Output:
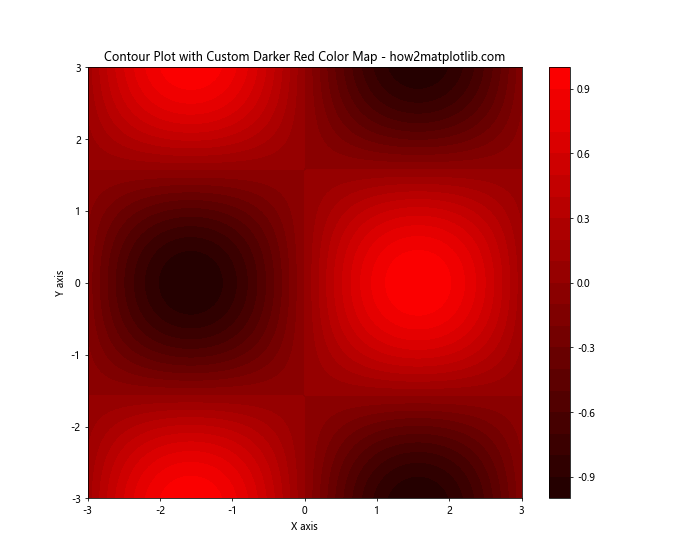
In this example, we create a custom darker red color map with a wider range of red shades. We then use this color map to create a contour plot of a 2D sinusoidal function using contourf().
Scatter Plot with Darker Red Color Gradient
Scatter plots can use darker red color gradients to represent a third dimension of data.
import matplotlib.pyplot as plt
import numpy as np
from matplotlib.colors import LinearSegmentedColormap

# Create a custom darker red color map
colors = ['#400000', '#600000', '#800000', '#A00000', '#C00000', '#E00000', '#FF0000']
cmap_name = 'custom_darker_red'
cmap = LinearSegmentedColormap.from_list(cmap_name, colors, N=100)

# Generate sample data
np.random.seed(42)
x = np.random.rand(100)
y = np.random.rand(100)
z = np.random.rand(100)

# Create a figure and plot the scatter
fig, ax = plt.subplots(figsize=(10, 8))
scatter = ax.scatter(x, y, c=z, s=100, cmap=cmap)
plt.colorbar(scatter)

# Add labels and title
ax.set_xlabel('X axis')
ax.set_ylabel('Y axis')
plt.title('Scatter Plot with Custom Darker Red Color Gradient - how2matplotlib.com')

plt.show()

print("Scatter plot with custom darker red color gradient created.")
Output:
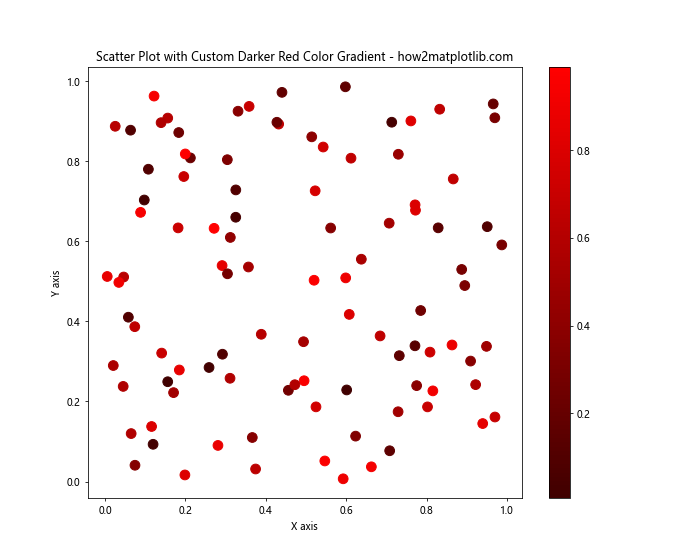
In this example, we create a scatter plot where the color of each point is determined by a third variable (z) using our custom darker red color map. This allows us to visualize three dimensions of data in a 2D plot.
Advanced Techniques for Darker Red Color Maps
Now that we’ve covered the basics of creating and applying darker red color maps, let’s explore some more advanced techniques and customizations.
Combining Multiple Color Maps
Sometimes, you may want to create a color map that combines darker reds with other colors. We can achieve this by concatenating multiple color maps.
import matplotlib.pyplot as plt
import numpy as np
from matplotlib.colors import LinearSegmentedColormap

# Create custom color maps
darker_reds = LinearSegmentedColormap.from_list('darker_reds', ['#400000', '#800000', '#C00000', '#FF0000'], N=50)
blues = plt.cm.Blues

# Combine the color maps
colors_reds = darker_reds(np.linspace(0, 1, 100))
colors_blues = blues(np.linspace(0, 1, 100))
colors = np.vstack((colors_blues, colors_reds))
combined_cmap = LinearSegmentedColormap.from_list('combined_cmap', colors)

# Generate sample data
x = np.linspace(-5, 5, 100)
y = np.linspace(-5, 5, 100)
X, Y = np.meshgrid(x, y)
Z = np.sin(X) * np.cos(Y)

# Create a figure and plot the data using the combined color map
fig, ax = plt.subplots(figsize=(10, 8))
im = ax.pcolormesh(X, Y, Z, cmap=combined_cmap, shading='auto')
plt.colorbar(im)

plt.title('Combined Darker Red and Blue Color Map - how2matplotlib.com')
plt.show()

print("Combined darker red and blue color map created and applied to the plot.")
Output:
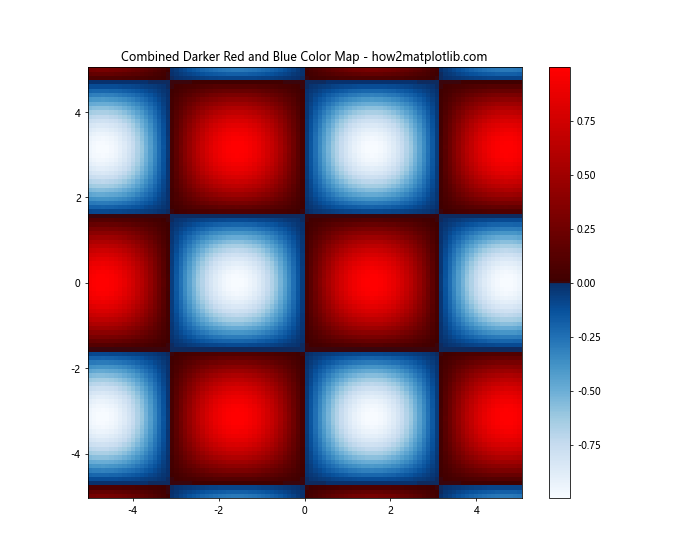
In this example, we create a custom darker red color map and combine it with the built-in ‘Blues’ color map. This results in a color map that transitions from blue to darker red, which can be useful for visualizing data with both positive and negative values.
Creating a Discrete Darker Red Color Map
Sometimes, you may want to use a discrete color map with a specific number of darker red shades. This can be useful for categorical data or when you want to emphasize distinct levels in your data.
import matplotlib.pyplot as plt
import numpy as np
from matplotlib.colors import LinearSegmentedColormap, BoundaryNorm

# Create a custom discrete darker red color map
colors = ['#400000', '#600000', '#800000', '#A00000', '#C00000', '#E00000', '#FF0000']
n_bins = len(colors)
cmap = LinearSegmentedColormap.from_list('discrete_darker_red', colors, N=n_bins)

# Generate sample data
np.random.seed(42)
data = np.random.randint(0, n_bins, size=(20, 20))

# Create a figure and plot the data using the discrete darker red color map
fig, ax = plt.subplots(figsize=(10, 8))
bounds = np.arange(n_bins + 1)
norm = BoundaryNorm(bounds, cmap.N)
im = ax.imshow(data, cmap=cmap, norm=norm)
cbar = plt.colorbar(im, ticks=bounds[:-1] + 0.5)
cbar.set_ticklabels(range(n_bins))

plt.title('Discrete Darker Red Color Map - how2matplotlib.com')
plt.show()

print("Discrete darker red color map created and applied to the plot.")
Output:
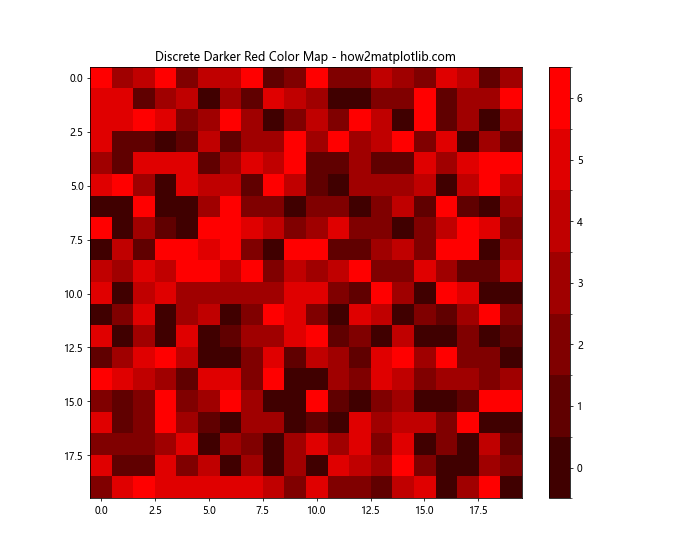
In this example, we create a discrete darker red color map with a specific number of colors. We use BoundaryNorm to ensure that each integer value in our data corresponds to a distinct color. The resulting plot shows a heatmap-like visualization with discrete color levels.
Customizing Darker Red Color Maps for Specific Use Cases
Different visualization scenarios may require specific customizations of darker red color maps. Let’s explore a few use cases and how to tailor the color maps for each.
Heat Index Visualization
When visualizing heat index or temperature data, a darker red color map that transitions from cool to hot colors can be effective.
import matplotlib.pyplot as plt
import numpy as np
from matplotlib.colors import LinearSegmentedColormap

# Create a custom heat index color map
colors = ['#0000FF', '#00FFFF', '#00FF00', '#FFFF00', '#FF8000', '#FF0000', '#800000']
cmap = LinearSegmentedColormap.from_list('heat_index', colors, N=100)

# Generate sample temperature data
x = np.linspace(0, 10, 100)
y = np.linspace(0, 10, 100)
X, Y = np.meshgrid(x, y)
Z = 20 + 10 * np.sin(X) * np.cos(Y)  # Temperature in Celsius

# Create a figure and plot the data
fig, ax = plt.subplots(figsize=(10, 8))
im = ax.pcolormesh(X, Y, Z, cmap=cmap, shading='auto')
cbar = plt.colorbar(im)
cbar.set_label('Temperature (°C)')

plt.title('Heat Index Visualization - how2matplotlib.com')
plt.show()

print("Heat index visualization with custom color map created.")
Output:
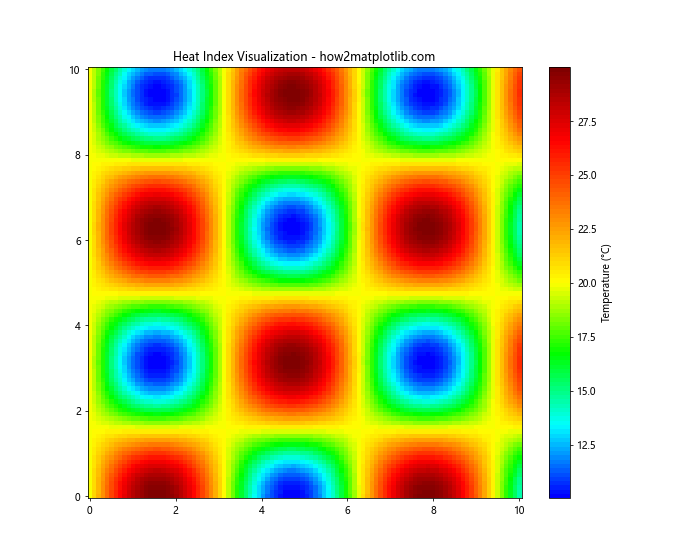
In this example, we create a color map that transitions from blue (cool) to dark red (hot), which is intuitive for temperature-related visualizations. The resulting plot shows a temperature distribution that’s easy to interpret at a glance.
Risk Assessment Visualization
For risk assessment visualizations, a color map that emphasizes high-risk areas with darker reds can be useful.
import matplotlib.pyplot as plt
import numpy as np
from matplotlib.colors import LinearSegmentedColormap

# Create a custom risk assessment color map
colors = ['#FFFFFF', '#FFCCCC', '#FF9999', '#FF6666', '#FF3333', '#FF0000', '#CC0000', '#990000', '#660000']
cmap = LinearSegmentedColormap.from_list('risk_assessment', colors, N=100)

# Generate sample risk data
np.random.seed(42)
risk_data = np.random.beta(2, 5, size=(20, 20))

# Create a figure and plot the data
fig, ax = plt.subplots(figsize=(10, 8))
im = ax.imshow(risk_data, cmap=cmap)
cbar = plt.colorbar(im)
cbar.set_label('Risk Level')

# Add labels
for i in range(20):
    for j in range(20):
        ax.text(j, i, f'{risk_data[i, j]:.2f}', ha='center', va='center', color='black')

plt.title('Risk Assessment Visualization - how2matplotlib.com')
plt.show()

print("Risk assessment visualization with custom color map created.")
Output:
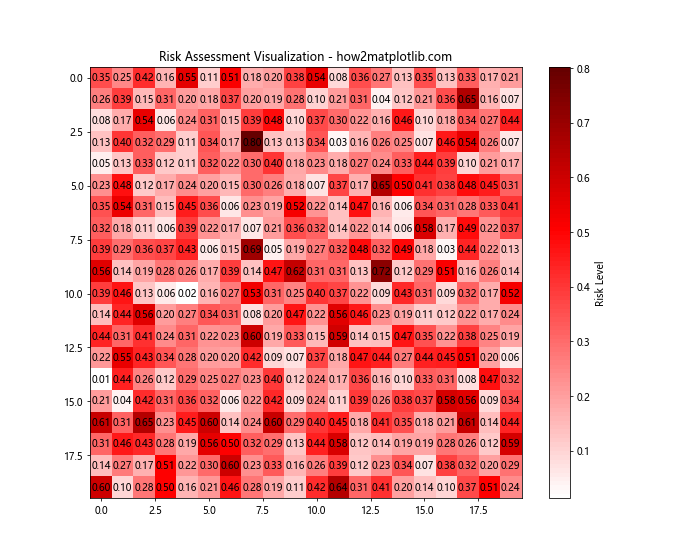
In this example, we create a color map that transitions from white (low risk) to very dark red (high risk). The resulting heatmap clearly shows areas of higher risk with darker shades of red, making it easy to identify critical areas in a risk assessment scenario.
Blood Flow Visualization
For medical visualizations such as blood flow, a pulsating darker red color map can be created to simulate the flow of blood.
import matplotlib.pyplot as plt
import numpy as np
from matplotlib.colors import LinearSegmentedColormap
from matplotlib.animation import FuncAnimation

# Create a custom blood flow color map
colors = ['#200000', '#400000', '#600000', '#800000', '#A00000', '#C00000', '#E00000', '#FF0000']
cmap = LinearSegmentedColormap.from_list('blood_flow', colors, N=100)

# Generate sample blood flow data
x = np.linspace(0, 10, 100)
y = np.linspace(0, 10, 100)
X, Y = np.meshgrid(x, y)

# Create a figure and initial plot
fig, ax = plt.subplots(figsize=(10, 8))
im = ax.imshow(np.zeros_like(X), cmap=cmap, animated=True)
plt.colorbar(im)

# Animation update function
def update(frame):
    Z = np.sin(X + frame/10) * np.cos(Y + frame/10) + 1
    im.set_array(Z)
    return [im]

# Create the animation
anim = FuncAnimation(fig, update, frames=100, interval=50, blit=True)

plt.title('Blood Flow Visualization - how2matplotlib.com')
plt.show()

print("Blood flow visualization with animated darker red color map created.")
Output:
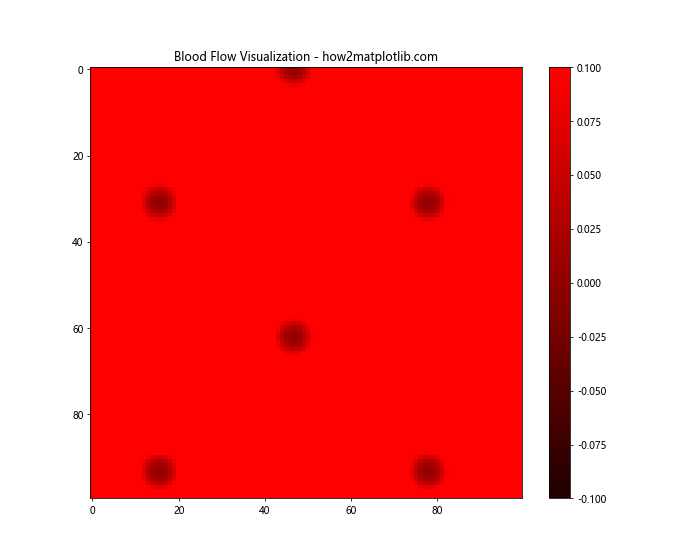
In this example, we create an animated visualization that simulates blood flow using a darker red color map. The animation shows a pulsating pattern that mimics the flow of blood through vessels, with darker reds representing areas of higher blood concentration or flow.
Combining Darker Red Color Maps with Other Visualization Techniques
Darker red color maps can be combined with other visualization techniques to create more informative and visually appealing plots. Let’s explore a few examples.
Darker Red Color Map with Contour Lines
Combining a darker red color map with contour lines can help emphasize the structure of the data while using color to represent intensity.
import matplotlib.pyplot as plt
import numpy as np
from matplotlib.colors import LinearSegmentedColormap

# Create a custom darker red color map
colors = ['#400000', '#600000', '#800000', '#A00000', '#C00000', '#E00000', '#FF0000']
cmap = LinearSegmentedColormap.from_list('darker_red', colors, N=100)

# Generate sample data
x = np.linspace(-3, 3, 100)
y = np.linspace(-3, 3, 100)
X, Y = np.meshgrid(x, y)
Z = np.sin(X) * np.cos(Y) * np.exp(-(X**2 + Y**2) / 10)

# Create a figure and plot the data
fig, ax = plt.subplots(figsize=(10, 8))
im = ax.imshow(Z, extent=[-3, 3, -3, 3], origin='lower', cmap=cmap)
cs = ax.contour(X, Y, Z, colors='white', linewidths=0.5)
ax.clabel(cs, inline=True, fontsize=8, fmt='%.2f')

plt.colorbar(im)
plt.title('Darker Red Color Map with Contour Lines - how2matplotlib.com')
plt.show()

print("Darker red color map with contour lines created.")
Output:
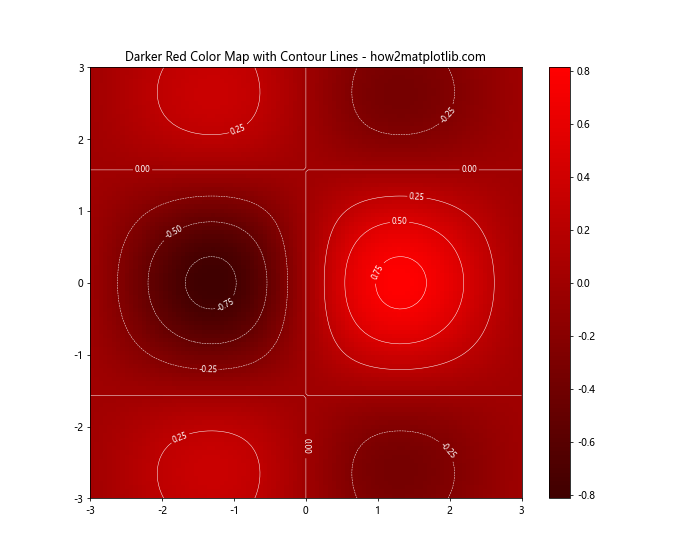
In this example, we combine a darker red color map with white contour lines. The color map represents the intensity of the data, while the contour lines help visualize the shape and structure of the underlying function.
Darker Red Color Map with Hillshading
For topographical data or 3D surfaces, combining a darker red color map with hillshading can create a more three-dimensional appearance.
import matplotlib.pyplot as plt
import numpy as np
from matplotlib.colors import LinearSegmentedColormap
from matplotlib.colors import LightSource

# Create a custom darker red color map
colors = ['#400000', '#600000', '#800000', '#A00000', '#C00000', '#E00000', '#FF0000']
cmap = LinearSegmentedColormap.from_list('darker_red', colors, N=100)

# Generate sample topographical data
x = np.linspace(-6, 6, 100)
y = np.linspace(-6, 6, 100)
X, Y = np.meshgrid(x, y)
Z = np.sin(np.sqrt(X**2 + Y**2))

# Create a light source for hillshading
ls = LightSource(azdeg=315, altdeg=45)

# Create a figure and plot the data with hillshading
fig, ax = plt.subplots(figsize=(10, 8))
rgb = ls.shade(Z, cmap=cmap, vert_exag=0.1, blend_mode='soft')
im = ax.imshow(rgb, extent=[-6, 6, -6, 6], origin='lower')

plt.colorbar(im)
plt.title('Darker Red Color Map with Hillshading - how2matplotlib.com')
plt.show()

print("Darker red color map with hillshading created.")
Output:
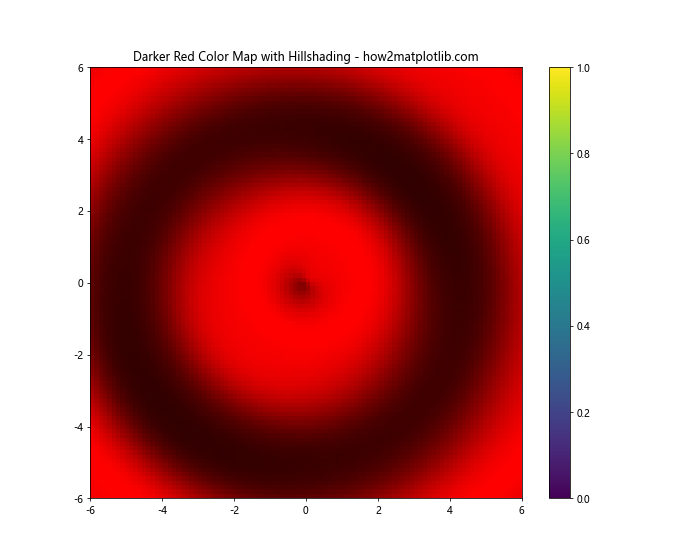
In this example, we use the LightSource class to create a hillshading effect on our topographical data. The darker red color map is then applied to this shaded surface, creating a 3D-like appearance that helps visualize the terrain more effectively.
Darker Red Color Map in Polar Coordinates
Darker red color maps can also be effective in polar coordinate systems, which are useful for circular or radial data.
import matplotlib.pyplot as plt
import numpy as np
from matplotlib.colors import LinearSegmentedColormap

# Create a custom darker red color map
colors = ['#400000', '#600000', '#800000', '#A00000', '#C00000', '#E00000', '#FF0000']
cmap = LinearSegmentedColormap.from_list('darker_red', colors, N=100)

# Generate sample data in polar coordinates
r = np.linspace(0, 2, 100)
theta = np.linspace(0, 2*np.pi, 100)
R, Theta = np.meshgrid(r, theta)
Z = R * np.sin(Theta * 5)

# Create a figure with polar projection
fig, ax = plt.subplots(figsize=(10, 8), subplot_kw=dict(projection='polar'))
im = ax.pcolormesh(Theta, R, Z, cmap=cmap, shading='auto')

plt.colorbar(im)
plt.title('Darker Red Color Map in Polar Coordinates - how2matplotlib.com')
plt.show()

print("Darker red color map in polar coordinates created.")
Output:
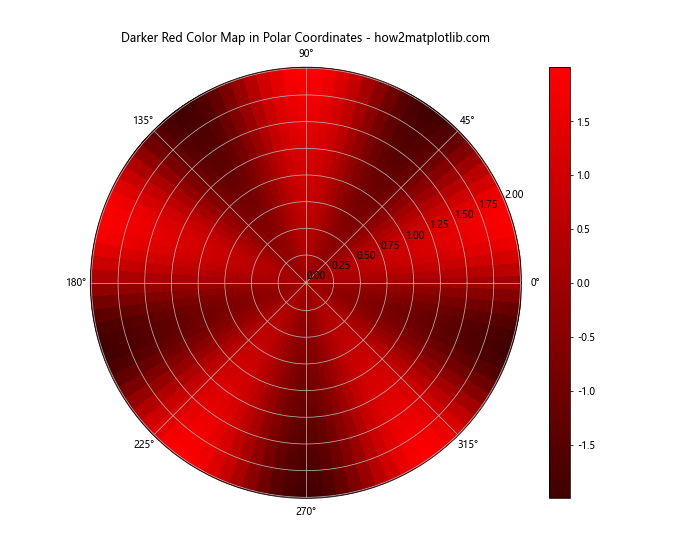
In this example, we create a polar plot using a darker red color map. This type of visualization can be useful for data with a circular or radial nature, such as wind direction and speed, or temporal data over a day or year.
Best Practices for Using Darker Red Color Maps
When using darker red color maps in your visualizations, it’s important to keep a few best practices in mind:
- Consider your audience: Make sure the color map is accessible to colorblind individuals. You may need to adjust the color map or add additional visual cues like contour lines.
Provide context: Always include a color bar or legend to help viewers interpret the values represented by the color map.
Choose appropriate data ranges: Adjust the color scale to highlight the most important parts of your data. You may need to use normalization techniques or adjust the minimum and maximum values.
Use complementary elements: Combine the color map with other visual elements like contour lines, labels, or annotations to enhance understanding.
Be consistent: If you’re creating multiple plots for comparison, use the same color map across all plots to maintain consistency.
Consider the background: Ensure that the darker red colors are visible against your plot’s background. You may need to adjust the background color or add a border around your plot.
Test different color map variations: Experiment with different shades of red and color transitions to find the most effective representation for your specific data.
Matplotlib cmap darker red Conclusion
Darker red color maps in Matplotlib offer a powerful tool for visualizing data, particularly when you want to emphasize intensity or highlight critical areas in your plots. By understanding how to create, customize, and apply these color maps, you can create more effective and visually appealing data visual