Matplotlib Cmap Blues
Matplotlib is a powerful data visualization library in Python, and one of its key features is the ability to use color maps (cmaps) to represent data effectively. The “Blues” colormap is a popular choice for many types of visualizations, particularly when representing data that ranges from low to high values or when emphasizing cooler tones. In this comprehensive guide, we’ll explore the Matplotlib Cmap Blues in depth, covering its characteristics, applications, and various ways to implement it in your visualizations.
Understanding the Blues Colormap
The Blues colormap is a sequential colormap that transitions from light blue to dark blue. It’s particularly useful for representing continuous data where higher values should be emphasized with darker shades. The colormap starts with a very light blue (almost white) and gradually intensifies to a deep, rich blue.
Let’s begin by visualizing the Blues colormap:
import matplotlib.pyplot as plt
import numpy as np

# Create a sample array
data = np.linspace(0, 1, 256).reshape(1, -1)
data = np.vstack((data, data))

# Create the figure and axis
fig, ax = plt.subplots(figsize=(10, 2))

# Display the colormap
im = ax.imshow(data, cmap='Blues', aspect='auto')

# Add a colorbar
cbar = plt.colorbar(im, ax=ax, orientation='horizontal', label='Blues Colormap')

# Set title
ax.set_title('Matplotlib Blues Colormap - how2matplotlib.com')

# Remove ticks
ax.set_xticks([])
ax.set_yticks([])

# Show the plot
plt.show()

# Print output
print("The Blues colormap visualization has been displayed.")
Output:

This code creates a simple visualization of the Blues colormap. It uses imshow() to display a gradient of the colormap and adds a colorbar to show the range of values.
Applying Blues Colormap to Different Plot Types
The Blues colormap can be applied to various types of plots in Matplotlib. Let’s explore some common plot types and how to incorporate the Blues colormap.
Heatmap with Blues Colormap
Heatmaps are excellent for displaying 2D data, and the Blues colormap can effectively represent intensity or frequency.
import matplotlib.pyplot as plt
import numpy as np

# Generate sample data
data = np.random.rand(10, 10)

# Create the heatmap
fig, ax = plt.subplots(figsize=(10, 8))
im = ax.imshow(data, cmap='Blues')

# Add colorbar
cbar = plt.colorbar(im)
cbar.set_label('Value')

# Customize the plot
ax.set_title('Heatmap with Blues Colormap - how2matplotlib.com')
ax.set_xlabel('X-axis')
ax.set_ylabel('Y-axis')

# Show the plot
plt.show()
Output:

This example creates a heatmap using random data. The imshow() function is used with the ‘Blues’ colormap to display the data. A colorbar is added to show the range of values.
Scatter Plot with Blues Colormap
Scatter plots can use the Blues colormap to represent a third dimension of data through color.
import matplotlib.pyplot as plt
import numpy as np

# Generate sample data
np.random.seed(42)
x = np.random.rand(100)
y = np.random.rand(100)
z = np.random.rand(100)

# Create the scatter plot
fig, ax = plt.subplots(figsize=(10, 8))
scatter = ax.scatter(x, y, c=z, cmap='Blues', s=100)

# Add colorbar
cbar = plt.colorbar(scatter)
cbar.set_label('Z Value')

# Customize the plot
ax.set_title('Scatter Plot with Blues Colormap - how2matplotlib.com')
ax.set_xlabel('X-axis')
ax.set_ylabel('Y-axis')

# Show the plot
plt.show()

# Print output
print("Scatter plot with Blues colormap has been displayed.")
Output:
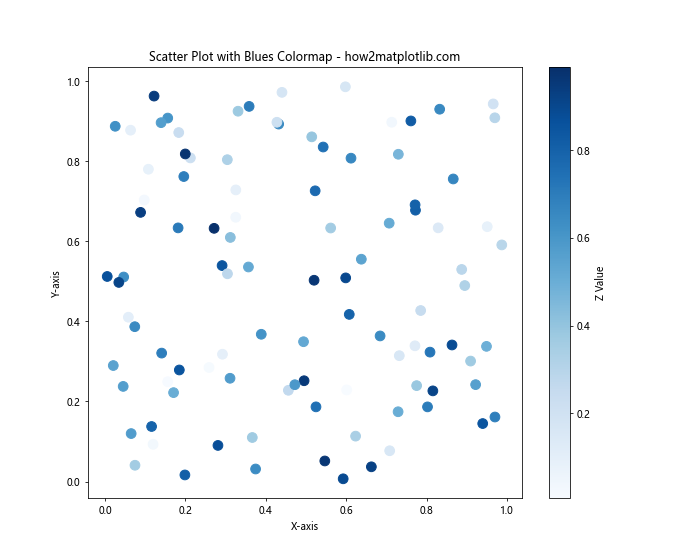
In this scatter plot, the x and y coordinates are random, and the z values (represented by color) are also random. The scatter() function uses the ‘Blues’ colormap to color the points based on their z values.
Contour Plot with Blues Colormap
Contour plots are great for showing isolines of 3D surfaces, and the Blues colormap can help distinguish different levels.
import matplotlib.pyplot as plt
import numpy as np

# Generate sample data
x = np.linspace(-3, 3, 100)
y = np.linspace(-3, 3, 100)
X, Y = np.meshgrid(x, y)
Z = np.sin(X) * np.cos(Y)

# Create the contour plot
fig, ax = plt.subplots(figsize=(10, 8))
contour = ax.contourf(X, Y, Z, cmap='Blues', levels=20)

# Add colorbar
cbar = plt.colorbar(contour)
cbar.set_label('Z Value')

# Customize the plot
ax.set_title('Contour Plot with Blues Colormap - how2matplotlib.com')
ax.set_xlabel('X-axis')
ax.set_ylabel('Y-axis')

# Show the plot
plt.show()

# Print output
print("Contour plot with Blues colormap has been displayed.")
Output:

This contour plot uses a mathematical function to generate 3D data. The contourf() function creates a filled contour plot using the Blues colormap, with 20 levels of contours.
Customizing the Blues Colormap
While the default Blues colormap is useful in many situations, Matplotlib provides ways to customize it for specific needs.
Reversing the Blues Colormap
Sometimes, you might want to reverse the direction of the colormap, starting with dark blue and ending with light blue.
import matplotlib.pyplot as plt
import numpy as np

# Generate sample data
data = np.random.rand(10, 10)

# Create the heatmap with reversed Blues colormap
fig, ax = plt.subplots(figsize=(10, 8))
im = ax.imshow(data, cmap='Blues_r')

# Add colorbar
cbar = plt.colorbar(im)
cbar.set_label('Value')

# Customize the plot
ax.set_title('Heatmap with Reversed Blues Colormap - how2matplotlib.com')
ax.set_xlabel('X-axis')
ax.set_ylabel('Y-axis')

# Show the plot
plt.show()

# Print output
print("Heatmap with reversed Blues colormap has been displayed.")
Output:

By appending ‘_r’ to the colormap name (‘Blues_r’), we reverse the colormap. This can be useful when you want to emphasize lower values with darker colors.
Creating a Custom Blues-based Colormap
You can create a custom colormap based on Blues by selecting specific colors from the Blues spectrum.
import matplotlib.pyplot as plt
import numpy as np
from matplotlib.colors import LinearSegmentedColormap

# Define custom colors from the Blues spectrum
colors = ['#f7fbff', '#deebf7', '#c6dbef', '#9ecae1', '#6baed6', '#4292c6', '#2171b5', '#08519c', '#08306b']
n_bins = len(colors)
cmap_name = 'custom_blues'
cm = LinearSegmentedColormap.from_list(cmap_name, colors, N=n_bins)

# Generate sample data
data = np.random.rand(10, 10)

# Create the heatmap with custom Blues colormap
fig, ax = plt.subplots(figsize=(10, 8))
im = ax.imshow(data, cmap=cm)

# Add colorbar
cbar = plt.colorbar(im)
cbar.set_label('Value')

# Customize the plot
ax.set_title('Heatmap with Custom Blues Colormap - how2matplotlib.com')
ax.set_xlabel('X-axis')
ax.set_ylabel('Y-axis')

# Show the plot
plt.show()

# Print output
print("Heatmap with custom Blues-based colormap has been displayed.")
Output:

This example creates a custom colormap using specific shades of blue. The LinearSegmentedColormap.from_list() function is used to create the colormap from the list of colors.
Blues Colormap in 3D Plots
The Blues colormap can also be effectively used in 3D plots to represent data depth or intensity.
3D Surface Plot with Blues Colormap
import matplotlib.pyplot as plt
import numpy as np

# Generate sample data
x = np.linspace(-5, 5, 100)
y = np.linspace(-5, 5, 100)
X, Y = np.meshgrid(x, y)
Z = np.sin(np.sqrt(X**2 + Y**2))

# Create the 3D surface plot
fig = plt.figure(figsize=(12, 8))
ax = fig.add_subplot(111, projection='3d')
surf = ax.plot_surface(X, Y, Z, cmap='Blues', linewidth=0, antialiased=False)

# Add colorbar
cbar = fig.colorbar(surf, shrink=0.5, aspect=5)
cbar.set_label('Z Value')

# Customize the plot
ax.set_title('3D Surface Plot with Blues Colormap - how2matplotlib.com')
ax.set_xlabel('X-axis')
ax.set_ylabel('Y-axis')
ax.set_zlabel('Z-axis')

# Show the plot
plt.show()

# Print output
print("3D surface plot with Blues colormap has been displayed.")
Output:
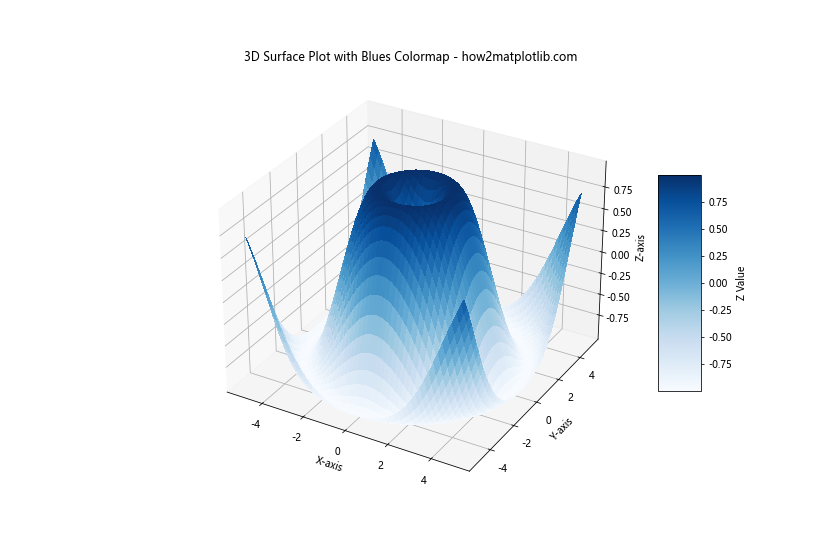
This 3D surface plot uses the Blues colormap to represent the height (Z-value) of the surface. The plot_surface() function creates the 3D surface, with the colormap applied to show the variation in height.
Blues Colormap in Geographic Plots
The Blues colormap is particularly useful for geographic plots, especially when representing water-related data or cool temperature ranges.
Choropleth Map with Blues Colormap
import matplotlib.pyplot as plt
import numpy as np

# Create a simple map (this is a placeholder for actual geographic data)
n_regions = 50
map_data = np.random.rand(n_regions)

# Create the choropleth map
fig, ax = plt.subplots(figsize=(12, 8))
im = ax.imshow(map_data.reshape(5, 10), cmap='Blues')

# Add colorbar
cbar = plt.colorbar(im)
cbar.set_label('Value')

# Customize the plot
ax.set_title('Choropleth Map with Blues Colormap - how2matplotlib.com')
ax.set_xticks([])
ax.set_yticks([])

# Show the plot
plt.show()

# Print output
print("Choropleth map with Blues colormap has been displayed.")
Output:

This example creates a simple choropleth map using random data. In a real-world scenario, you would use actual geographic data, but this demonstrates how the Blues colormap can be applied to such maps.
Combining Blues with Other Colormaps
Sometimes, combining the Blues colormap with other colormaps can create interesting and informative visualizations.
Diverging Colormap with Blues
import matplotlib.pyplot as plt
import numpy as np
from matplotlib.colors import LinearSegmentedColormap

# Create a diverging colormap using Blues and Reds
colors_blues = plt.cm.Blues(np.linspace(0.2, 1, 128))
colors_reds = plt.cm.Reds(np.linspace(0, 0.8, 128))
colors = np.vstack((colors_blues, colors_reds[::-1]))
diverging_map = LinearSegmentedColormap.from_list('diverging_blues_reds', colors)

# Generate sample data
data = np.random.randn(20, 20)

# Create the heatmap with diverging colormap
fig, ax = plt.subplots(figsize=(10, 8))
im = ax.imshow(data, cmap=diverging_map)

# Add colorbar
cbar = plt.colorbar(im)
cbar.set_label('Value')

# Customize the plot
ax.set_title('Heatmap with Diverging Blues-Reds Colormap - how2matplotlib.com')
ax.set_xlabel('X-axis')
ax.set_ylabel('Y-axis')

# Show the plot
plt.show()

# Print output
print("Heatmap with diverging Blues-Reds colormap has been displayed.")
Output:
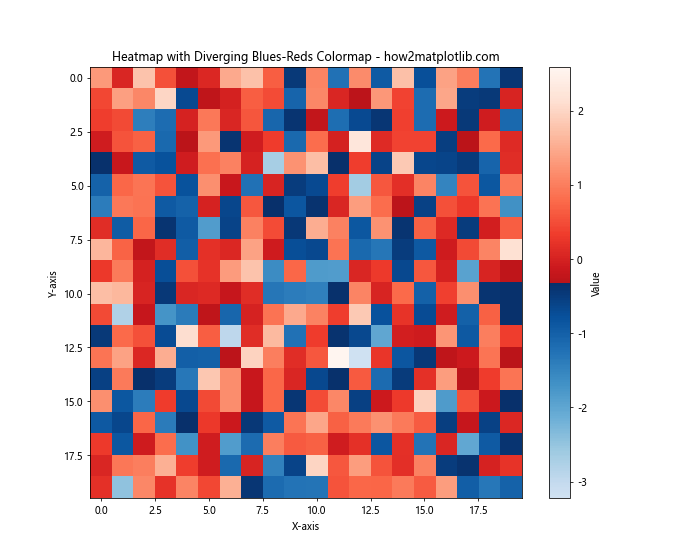
This example creates a diverging colormap that transitions from blue to red, with white in the middle. This type of colormap is useful for data that has a meaningful center point, such as temperature anomalies.
Blues Colormap in Animated Plots
The Blues colormap can also be used effectively in animated plots to show changes over time.
Animated Heatmap with Blues Colormap
import matplotlib.pyplot as plt
import numpy as np
from matplotlib.animation import FuncAnimation

# Generate initial random data
data = np.random.rand(10, 10)

# Create the figure and axis
fig, ax = plt.subplots(figsize=(10, 8))
im = ax.imshow(data, cmap='Blues', animated=True)
cbar = plt.colorbar(im)
cbar.set_label('Value')

# Function to update the data
def update(frame):
    data = np.random.rand(10, 10)
    im.set_array(data)
    return [im]

# Create the animation
anim = FuncAnimation(fig, update, frames=200, interval=50, blit=True)

# Customize the plot
ax.set_title('Animated Heatmap with Blues Colormap - how2matplotlib.com')
ax.set_xlabel('X-axis')
ax.set_ylabel('Y-axis')

# Show the plot
plt.show()

# Print output
print("Animated heatmap with Blues colormap has been displayed.")
Output:
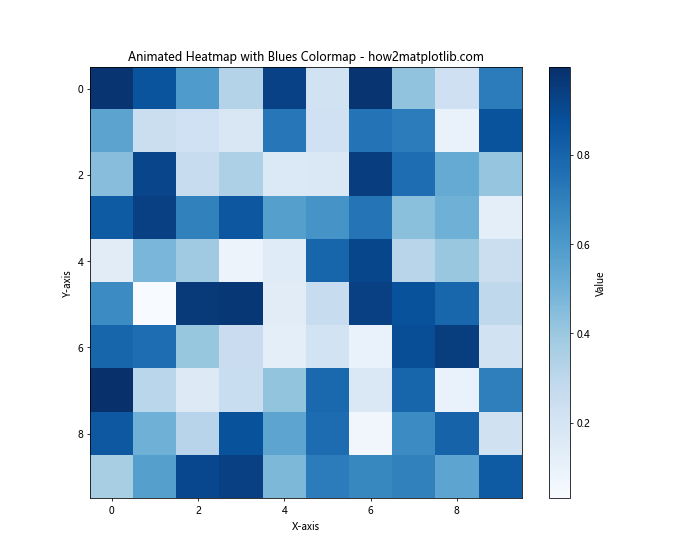
This code creates an animated heatmap where the data changes randomly over time. The Blues colormap is used to represent the changing values.
Blues Colormap in Subplots
When working with multiple plots, the Blues colormap can be applied consistently across subplots for a cohesive look.
Multiple Subplots with Blues Colormap
import matplotlib.pyplot as plt
import numpy as np

# Generate sample data
data1 = np.random.rand(10, 10)
data2 = np.random.rand(10, 10)
data3 = np.random.rand(10, 10)
data4 = np.random.rand(10, 10)

# Create the figure and subplots
fig, axs = plt.subplots(2, 2, figsize=(12, 10))

# Plot heatmaps in each subplot
im1 = axs[0, 0].imshow(data1, cmap='Blues')
im2 = axs[0, 1].imshow(data2, cmap='Blues')
im3 = axs[1, 0].imshow(data3, cmap='Blues')
im4 = axs[1, 1].imshow(data4, cmap='Blues')

# Add colorbars
for ax, im in zip(axs.flat, [im1, im2, im3, im4]):
    plt.colorbar(im, ax=ax)

# Customize the plots
fig.suptitle('Multiple Heatmaps with Blues Colormap - how2matplotlib.com', fontsize=16)
for ax, label in zip(axs.flat, ['A', 'B', 'C', 'D']):
    ax.set_title(f'Subplot {label}')

# Adjust layout
plt.tight_layout()

# Show the plot
plt.show()

# Print output
print("Multiple subplots with Blues colormap have been displayed.")
Output:

This example creates four subplots, each containing a heatmap using the Blues colormap. This approach is useful for comparing different datasets or aspects of data while maintaining a consistent color scheme.
Blues Colormap with Different Normalization
The way data is mapped to colors can be adjusted using different normalization techniques. This can be particularly useful when working with the Blues colormap to highlight specific ranges of data.
Blues Colormap with LogNorm
import matplotlib.pyplot as plt
import numpy as np
from matplotlib.colors import LogNorm

# Generate sample data with exponential distribution
data = np.random.exponential(scale=1.0, size=(20, 20))

# Create the heatmap with LogNorm
fig, ax = plt.subplots(figsize=(10, 8))
im = ax.imshow(data, cmap='Blues', norm=LogNorm(vmin=data.min(), vmax=data.max()))

# Add colorbar
cbar = plt.colorbar(im)
cbar.set_label('Value (log scale)')

# Customize the plot
ax.set_title('Heatmap with Blues Colormap and LogNorm - how2matplotlib.com')
ax.set_xlabel('X-axis')
ax.set_ylabel('Y-axis')

# Show the plot
plt.show()
Output:
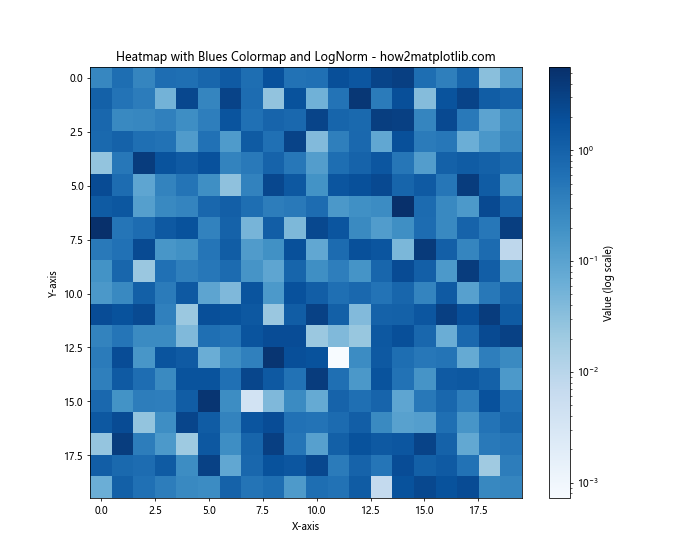
This example uses LogNorm to apply a logarithmic scaling to the data before mapping it to the Blues colormap. This is particularly useful for data with a large range of values or exponential distribution, as it helps to visualize both small and large values effectively.
Blues Colormap with SymLogNorm
For data that includes both positive and negative values, the SymLogNorm can be useful:
import matplotlib.pyplot as plt
import numpy as np
from matplotlib.colors import SymLogNorm

# Generate sample data with both positive and negative values
data = np.random.normal(loc=0, scale=10, size=(20, 20))

# Create the heatmap with SymLogNorm
fig, ax = plt.subplots(figsize=(10, 8))
im = ax.imshow(data, cmap='Blues', norm=SymLogNorm(linthresh=0.1, linscale=1, vmin=-100, vmax=100))

# Add colorbar
cbar = plt.colorbar(im)
cbar.set_label('Value (symlog scale)')

# Customize the plot
ax.set_title('Heatmap with Blues Colormap and SymLogNorm - how2matplotlib.com')
ax.set_xlabel('X-axis')
ax.set_ylabel('Y-axis')

# Show the plot
plt.show()
Output:
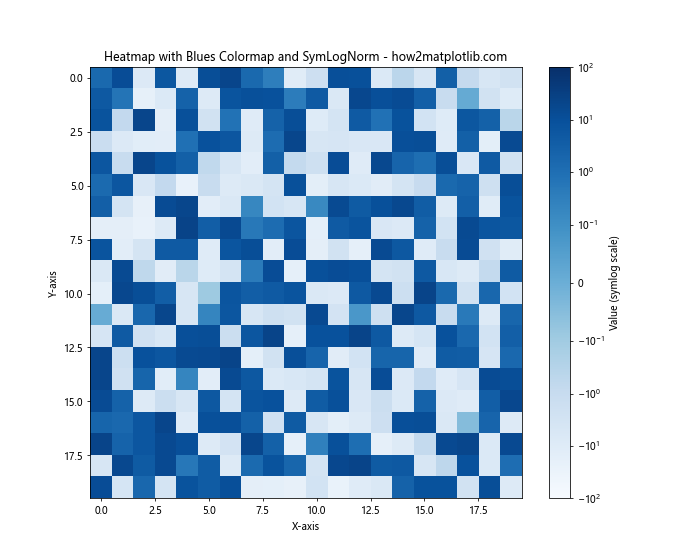
This example uses SymLogNorm to apply a symmetric logarithmic scaling to the data. This is useful for data that has both positive and negative values, and where you want to emphasize values close to zero.
Blues Colormap in Polar Plots
The Blues colormap can also be effectively used in polar plots to represent data in a circular format.
Polar Heatmap with Blues Colormap
import matplotlib.pyplot as plt
import numpy as np

# Generate sample data
r = np.linspace(0, 2, 100)
theta = np.linspace(0, 2*np.pi, 100)
r, theta = np.meshgrid(r, theta)
values = np.sin(5*theta) * (r**2)

# Create the polar plot
fig, ax = plt.subplots(subplot_kw=dict(projection='polar'), figsize=(10, 8))
im = ax.pcolormesh(theta, r, values, cmap='Blues')

# Add colorbar
cbar = plt.colorbar(im, ax=ax)
cbar.set_label('Value')

# Customize the plot
ax.set_title('Polar Heatmap with Blues Colormap - how2matplotlib.com')

# Show the plot
plt.show()
Output:
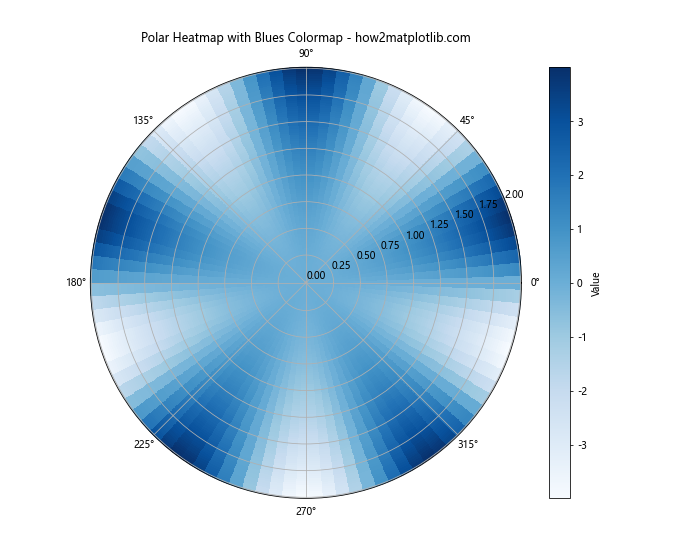
This example creates a polar heatmap using the Blues colormap. The pcolormesh() function is used to create the heatmap in polar coordinates. This type of visualization can be useful for data with a circular or periodic nature.
Blues Colormap with Transparency
Adding transparency to the Blues colormap can be useful when overlaying the colormap on other visualizations or background images.
Scatter Plot with Transparent Blues Colormap
import matplotlib.pyplot as plt
import numpy as np

# Generate sample data
np.random.seed(42)
x = np.random.rand(100)
y = np.random.rand(100)
z = np.random.rand(100)

# Create custom colormap with transparency
blues_alpha = plt.cm.Blues(np.arange(plt.cm.Blues.N))
blues_alpha[:,-1] = np.linspace(0, 1, plt.cm.Blues.N)
cmap_blues_alpha = plt.cm.colors.ListedColormap(blues_alpha)

# Create the scatter plot
fig, ax = plt.subplots(figsize=(10, 8))
scatter = ax.scatter(x, y, c=z, cmap=cmap_blues_alpha, s=100)

# Add colorbar
cbar = plt.colorbar(scatter)
cbar.set_label('Z Value')

# Customize the plot
ax.set_title('Scatter Plot with Transparent Blues Colormap - how2matplotlib.com')
ax.set_xlabel('X-axis')
ax.set_ylabel('Y-axis')

# Add a background image (simulated with a gradient)
gradient = np.linspace(0, 1, 100).reshape(1, -1)
ax.imshow(gradient, extent=[0, 1, 0, 1], aspect='auto', alpha=0.3, cmap='YlOrRd')

# Show the plot
plt.show()
Output:
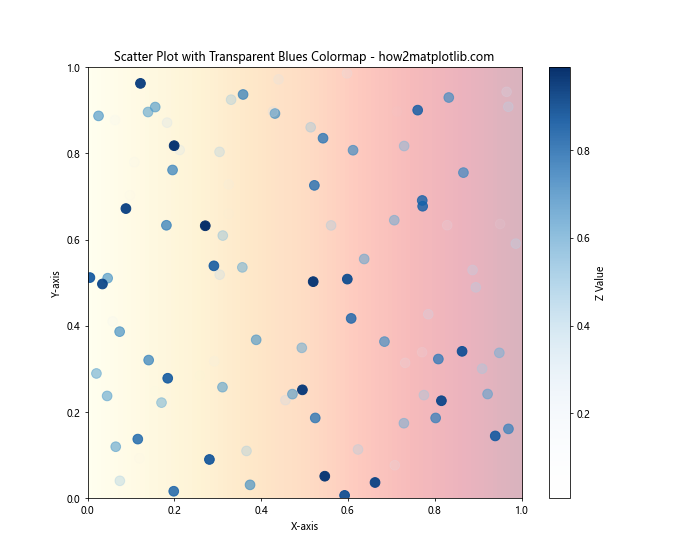
This example creates a scatter plot using a modified Blues colormap with transparency. The transparency is added by modifying the alpha channel of the colormap. A background gradient is added to demonstrate how the transparent colormap allows the background to show through.
Blues Colormap in Streamplot
The Blues colormap can be effectively used in streamplots to visualize vector fields.
Streamplot with Blues Colormap
import matplotlib.pyplot as plt
import numpy as np

# Generate sample vector field data
Y, X = np.mgrid[-3:3:100j, -3:3:100j]
U = -1 - X**2 + Y
V = 1 + X - Y**2
speed = np.sqrt(U**2 + V**2)

# Create the streamplot
fig, ax = plt.subplots(figsize=(10, 8))
strm = ax.streamplot(X, Y, U, V, color=speed, cmap='Blues', linewidth=2, arrowsize=2)

# Add colorbar
cbar = fig.colorbar(strm.lines)
cbar.set_label('Speed')

# Customize the plot
ax.set_title('Streamplot with Blues Colormap - how2matplotlib.com')
ax.set_xlabel('X-axis')
ax.set_ylabel('Y-axis')

# Show the plot
plt.show()
Output:
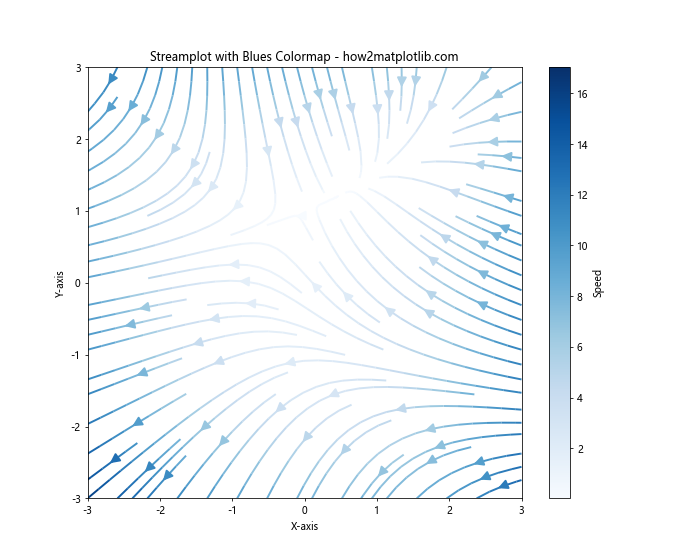
This example creates a streamplot where the color of the streamlines is determined by the speed of the vector field, using the Blues colormap. This type of visualization is useful for showing both the direction and magnitude of a vector field.
Blues Colormap in Violin Plots
While not as common, the Blues colormap can also be applied to statistical plots like violin plots to add an extra dimension of information.
Violin Plot with Blues Colormap
import matplotlib.pyplot as plt
import numpy as np

# Generate sample data
np.random.seed(10)
data = [np.random.normal(0, std, 100) for std in range(1, 5)]

# Create the violin plot
fig, ax = plt.subplots(figsize=(10, 6))
parts = ax.violinplot(data, showmeans=False, showmedians=False)

# Color the violin plots using Blues colormap
for i, pc in enumerate(parts['bodies']):
    pc.set_facecolor(plt.cm.Blues(i / len(data)))
    pc.set_edgecolor('black')
    pc.set_alpha(0.7)

# Customize the plot
ax.set_title('Violin Plot with Blues Colormap - how2matplotlib.com')
ax.set_xlabel('Distribution')
ax.set_ylabel('Value')
ax.set_xticks(range(1, len(data) + 1))
ax.set_xticklabels([f'D{i}' for i in range(1, len(data) + 1)])

# Show the plot
plt.show()
Output:
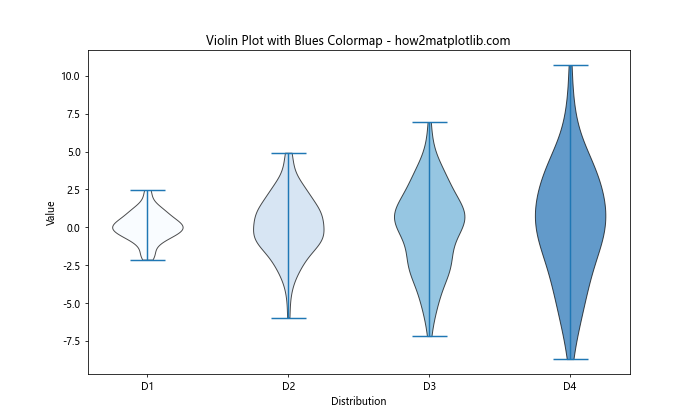
This example creates a violin plot where each violin is colored using a different shade from the Blues colormap. This can be useful for showing multiple distributions and adding a visual cue to differentiate between them.
Matplotlib Cmap Blues Conclusion
The Matplotlib Cmap Blues is a versatile and effective colormap for a wide range of data visualization tasks. Its sequential nature makes it particularly suitable for representing continuous data, especially when you want to emphasize higher values with darker shades of blue.
Throughout this guide, we’ve explored various applications of the Blues colormap, from basic heatmaps to more complex 3D plots and animated visualizations. We’ve also seen how it can be customized, combined with other colormaps, and applied with different normalization techniques to suit specific data visualization needs.
When using the Blues colormap, consider the nature of your data and the message you want to convey. For data with a natural progression from low to high values, the default Blues colormap works well. For data with a central point of interest, consider using a diverging colormap that incorporates Blues.
Remember that while the Blues colormap is excellent for many applications, it’s always important to choose a colormap that best represents your data and is accessible to your audience, including those who may have color vision deficiencies.
By mastering the use of the Blues colormap and understanding its applications, you can create more effective and visually appealing data visualizations using Matplotlib.