Matplotlib Add Title to Legend
Matplotlib is a powerful data visualization library in Python that allows users to create a wide variety of plots and charts. One of the essential features of Matplotlib is the ability to add legends to plots, which help viewers understand the different elements in a graph. Adding a title to the legend can further enhance the clarity and informativeness of your visualizations. In this comprehensive guide, we’ll explore various methods and techniques for adding titles to legends in Matplotlib, along with detailed examples and explanations.
Understanding Legends in Matplotlib
Before diving into adding titles to legends, it’s important to understand what legends are and how they function in Matplotlib. A legend is a key that explains the meaning of different elements in a plot, such as lines, markers, or colors. Legends typically appear as a box containing labels and corresponding visual elements (e.g., line styles or markers) that match those used in the plot.
In Matplotlib, legends are created using the legend() method, which can be called on either the axes object or the figure object. By default, Matplotlib automatically generates legend entries based on the labels provided when plotting data. However, you can also manually specify legend entries using the label parameter when creating plot elements.
Basic Legend Creation
Let’s start with a basic example of creating a legend in Matplotlib:
import matplotlib.pyplot as plt
import numpy as np

# Generate sample data
x = np.linspace(0, 10, 100)
y1 = np.sin(x)
y2 = np.cos(x)

# Create the plot
plt.figure(figsize=(10, 6))
plt.plot(x, y1, label='Sine')
plt.plot(x, y2, label='Cosine')

# Add a legend
plt.legend()

# Add labels and title
plt.xlabel('X-axis')
plt.ylabel('Y-axis')
plt.title('Sine and Cosine Functions - how2matplotlib.com')

# Display the plot
plt.show()

# Print output
print("Legend added successfully")
Output:
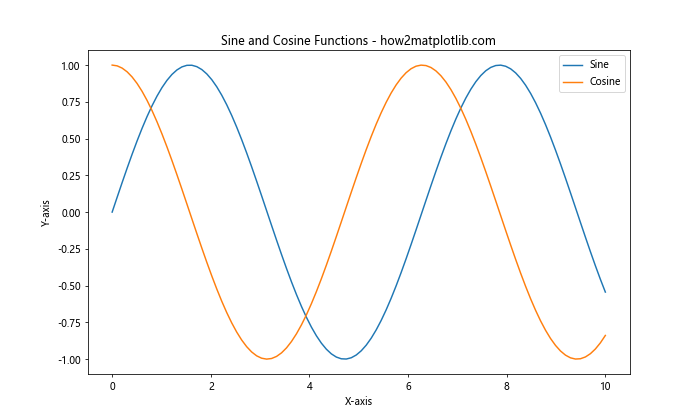
In this example, we create a simple plot with two lines representing sine and cosine functions. The label parameter is used when plotting each line to specify the legend entries. The plt.legend() call then creates the legend based on these labels.
Adding a Title to the Legend
Now that we understand how to create a basic legend, let’s explore different methods for adding a title to the legend.
Method 1: Using the title Parameter
The simplest way to add a title to a legend is by using the title parameter in the legend() method. This parameter allows you to specify a string that will appear as the title of the legend.
import matplotlib.pyplot as plt
import numpy as np

# Generate sample data
x = np.linspace(0, 10, 100)
y1 = np.sin(x)
y2 = np.cos(x)

# Create the plot
plt.figure(figsize=(10, 6))
plt.plot(x, y1, label='Sine')
plt.plot(x, y2, label='Cosine')

# Add a legend with a title
plt.legend(title='Trigonometric Functions')

# Add labels and title
plt.xlabel('X-axis')
plt.ylabel('Y-axis')
plt.title('Sine and Cosine Functions with Legend Title - how2matplotlib.com')

# Display the plot
plt.show()

# Print output
print("Legend with title added successfully")
Output:
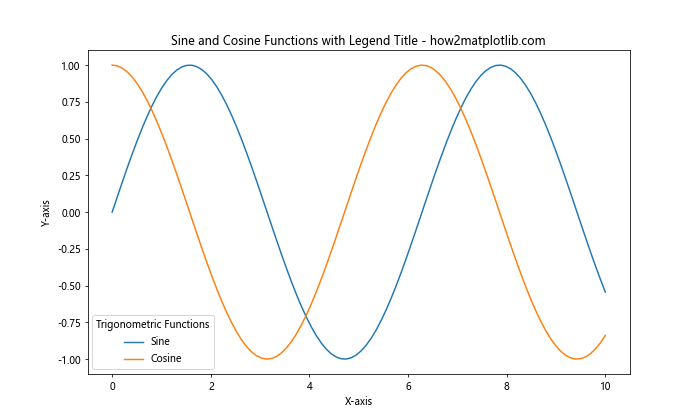
In this example, we’ve added the title parameter to the legend() method, specifying “Trigonometric Functions” as the legend title. This creates a simple title above the legend entries.
Method 2: Customizing Legend Title Properties
While the title parameter is straightforward, you might want more control over the appearance of the legend title. Matplotlib allows you to customize various properties of the legend title, such as font size, weight, and color.
import matplotlib.pyplot as plt
import numpy as np

# Generate sample data
x = np.linspace(0, 10, 100)
y1 = np.sin(x)
y2 = np.cos(x)

# Create the plot
plt.figure(figsize=(10, 6))
plt.plot(x, y1, label='Sine')
plt.plot(x, y2, label='Cosine')

# Add a legend with a customized title
legend = plt.legend(title='Trigonometric Functions')
plt.setp(legend.get_title(), fontsize='large', fontweight='bold', color='red')

# Add labels and title
plt.xlabel('X-axis')
plt.ylabel('Y-axis')
plt.title('Sine and Cosine Functions with Customized Legend Title - how2matplotlib.com')

# Display the plot
plt.show()

# Print output
print("Legend with customized title added successfully")
Output:
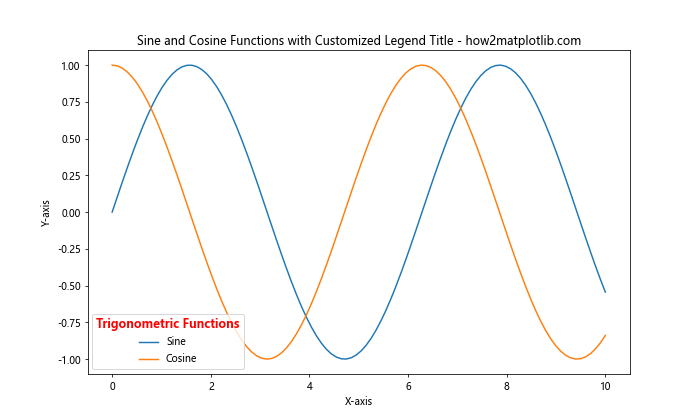
In this example, we first create the legend with a title using the legend() method. Then, we use plt.setp() to modify the properties of the legend title. We increase the font size, make it bold, and change its color to red.
Method 3: Using ax.legend() for More Control
When working with subplots or when you need more fine-grained control over your plots, it’s often better to use the ax.legend() method instead of plt.legend(). This allows you to work with specific axes objects and provides more flexibility.
import matplotlib.pyplot as plt
import numpy as np

# Generate sample data
x = np.linspace(0, 10, 100)
y1 = np.sin(x)
y2 = np.cos(x)

# Create the plot
fig, ax = plt.subplots(figsize=(10, 6))
ax.plot(x, y1, label='Sine')
ax.plot(x, y2, label='Cosine')

# Add a legend with a title
legend = ax.legend(title='Trigonometric Functions')
legend.get_title().set_fontweight('bold')

# Add labels and title
ax.set_xlabel('X-axis')
ax.set_ylabel('Y-axis')
ax.set_title('Sine and Cosine Functions with Legend Title (ax.legend) - how2matplotlib.com')

# Display the plot
plt.show()

# Print output
print("Legend with title added using ax.legend() successfully")
Output:
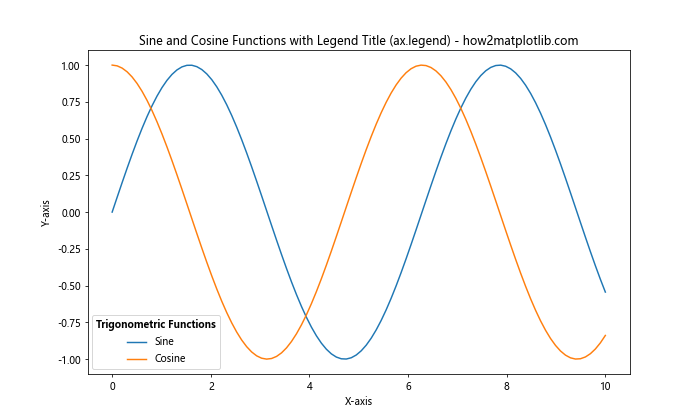
In this example, we create a figure and axes object explicitly using plt.subplots(). We then use ax.legend() to add the legend and its title. This approach gives us more control over individual plot elements and is particularly useful when working with multiple subplots.
Method 4: Adding a Title to a Pre-existing Legend
Sometimes, you might want to add a title to a legend that has already been created. Matplotlib allows you to do this by accessing the legend object and modifying its properties.
import matplotlib.pyplot as plt
import numpy as np

# Generate sample data
x = np.linspace(0, 10, 100)
y1 = np.sin(x)
y2 = np.cos(x)

# Create the plot
fig, ax = plt.subplots(figsize=(10, 6))
ax.plot(x, y1, label='Sine')
ax.plot(x, y2, label='Cosine')

# Add a legend without a title
legend = ax.legend()

# Add a title to the existing legend
legend.set_title("Trigonometric Functions")
legend.get_title().set_fontsize('large')

# Add labels and title
ax.set_xlabel('X-axis')
ax.set_ylabel('Y-axis')
ax.set_title('Sine and Cosine Functions with Added Legend Title - how2matplotlib.com')

# Display the plot
plt.show()

# Print output
print("Title added to pre-existing legend successfully")
Output:
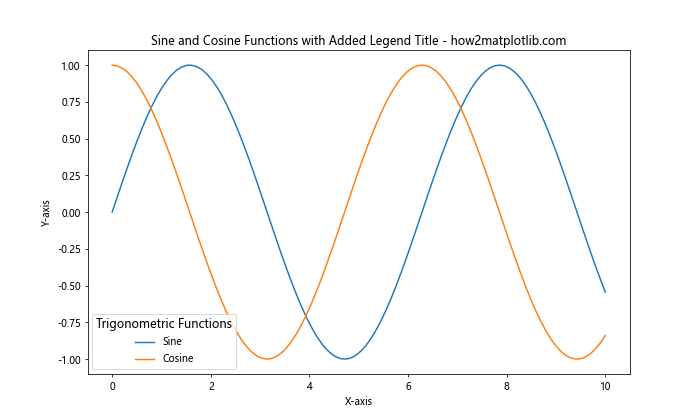
In this example, we first create a legend without a title using ax.legend(). We then use the set_title() method of the legend object to add a title. Additionally, we customize the font size of the title using get_title().set_fontsize().
Method 5: Using a Custom Legend Title
For even more customization, you can create a custom legend title using text objects. This approach gives you full control over the positioning and styling of the legend title.
import matplotlib.pyplot as plt
import numpy as np

# Generate sample data
x = np.linspace(0, 10, 100)
y1 = np.sin(x)
y2 = np.cos(x)

# Create the plot
fig, ax = plt.subplots(figsize=(10, 6))
ax.plot(x, y1, label='Sine')
ax.plot(x, y2, label='Cosine')

# Add a legend without a title
legend = ax.legend(loc='upper right')

# Add a custom legend title
ax.text(0.95, 0.95, 'Trigonometric Functions',
        transform=ax.transAxes,
        fontsize=12, fontweight='bold',
        ha='right', va='top')

# Add labels and title
ax.set_xlabel('X-axis')
ax.set_ylabel('Y-axis')
ax.set_title('Sine and Cosine Functions with Custom Legend Title - how2matplotlib.com')

# Display the plot
plt.show()

# Print output
print("Custom legend title added successfully")
Output:
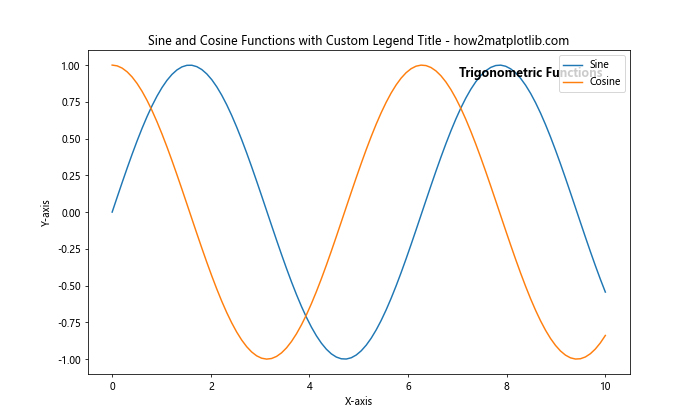
In this example, we create a legend without a title and then use ax.text() to add a custom text object that serves as the legend title. This method allows for precise positioning and extensive customization of the title’s appearance.
Advanced Legend Title Techniques
Now that we’ve covered the basics of adding titles to legends, let’s explore some more advanced techniques and scenarios.
Multiple Legends with Titles
In some cases, you might want to have multiple legends in a single plot, each with its own title. Matplotlib allows you to create and position multiple legends independently.
import matplotlib.pyplot as plt
import numpy as np

# Generate sample data
x = np.linspace(0, 10, 100)
y1 = np.sin(x)
y2 = np.cos(x)
y3 = np.tan(x)
y4 = x**2

# Create the plot
fig, ax = plt.subplots(figsize=(12, 8))
line1, = ax.plot(x, y1, label='Sine')
line2, = ax.plot(x, y2, label='Cosine')
line3, = ax.plot(x, y3, label='Tangent')
line4, = ax.plot(x, y4, label='Quadratic')

# Create first legend
legend1 = ax.legend(handles=[line1, line2], title='Trigonometric Functions', loc='upper left')
ax.add_artist(legend1)  # Add the first legend to the axes

# Create second legend
legend2 = ax.legend(handles=[line3, line4], title='Other Functions', loc='upper right')

# Add labels and title
ax.set_xlabel('X-axis')
ax.set_ylabel('Y-axis')
ax.set_title('Multiple Functions with Multiple Legends - how2matplotlib.com')

# Display the plot
plt.show()

# Print output
print("Multiple legends with titles added successfully")
Output:
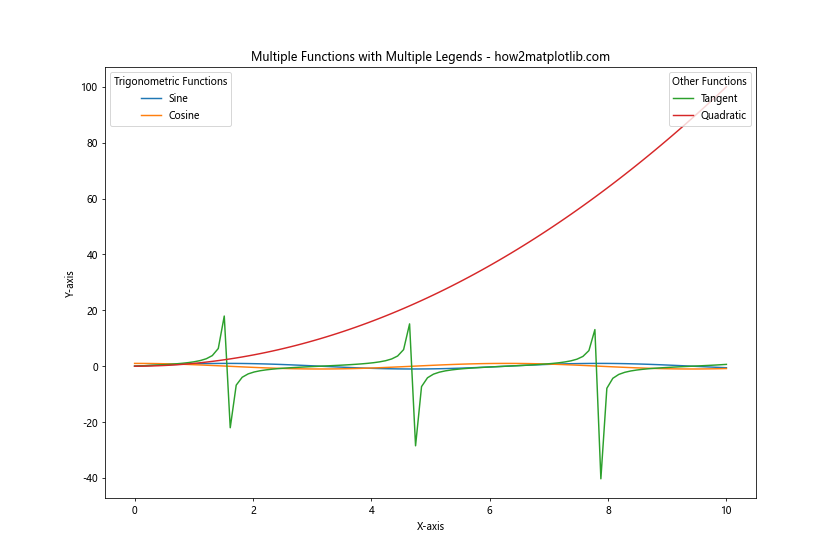
In this example, we create two separate legends, each with its own title and set of plot elements. We use ax.add_artist() to add the first legend to the axes, which allows us to create a second legend without overwriting the first one.
Legend Title with Multiple Lines
Sometimes, you might need a legend title that spans multiple lines. You can achieve this by using the newline character \n in your title string.
import matplotlib.pyplot as plt
import numpy as np

# Generate sample data
x = np.linspace(0, 10, 100)
y1 = np.sin(x)
y2 = np.cos(x)

# Create the plot
fig, ax = plt.subplots(figsize=(10, 6))
ax.plot(x, y1, label='Sine')
ax.plot(x, y2, label='Cosine')

# Add a legend with a multi-line title
legend = ax.legend(title='Trigonometric Functions\nSine and Cosine')
legend.get_title().set_fontsize('large')
legend.get_title().set_fontweight('bold')

# Add labels and title
ax.set_xlabel('X-axis')
ax.set_ylabel('Y-axis')
ax.set_title('Sine and Cosine Functions with Multi-line Legend Title - how2matplotlib.com')

# Display the plot
plt.show()

# Print output
print("Legend with multi-line title added successfully")
Output:
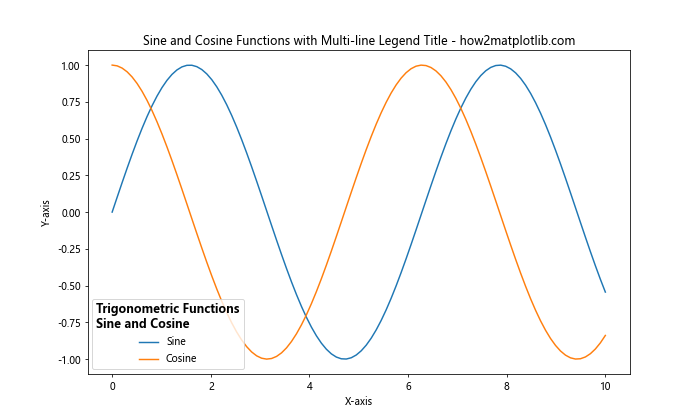
In this example, we use \n in the legend title to create a two-line title. We also customize the font size and weight of the title for better visibility.
Customizing Legend Title Alignment
By default, the legend title is centered above the legend entries. However, you can customize the alignment of the title to better suit your plot’s layout.
import matplotlib.pyplot as plt
import numpy as np

# Generate sample data
x = np.linspace(0, 10, 100)
y1 = np.sin(x)
y2 = np.cos(x)

# Create the plot
fig, ax = plt.subplots(figsize=(10, 6))
ax.plot(x, y1, label='Sine')
ax.plot(x, y2, label='Cosine')

# Add a legend with a left-aligned title
legend = ax.legend(title='Trigonometric Functions', title_fontsize='large')
legend._loc = 2  # Upper left location
plt.setp(legend.get_title(), multialignment='left')

# Add labels and title
ax.set_xlabel('X-axis')
ax.set_ylabel('Y-axis')
ax.set_title('Sine and Cosine Functions with Left-Aligned Legend Title - how2matplotlib.com')

# Display the plot
plt.show()

# Print output
print("Legend with left-aligned title added successfully")
Output:
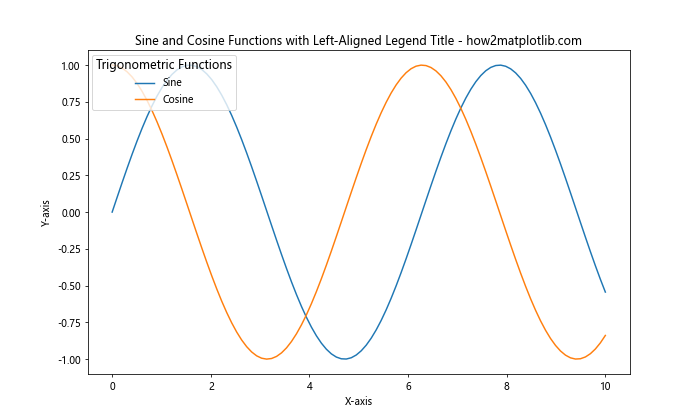
In this example, we use plt.setp() to set the multialignment property of the legend title to ‘left’. This aligns the title text to the left edge of the legend box.
Adding Icons or Symbols to Legend Titles
To make your legend titles more visually appealing or informative, you can add icons or symbols using Unicode characters or custom markers.
import matplotlib.pyplot as plt
import numpy as np

# Generate sample data
x = np.linspace(0, 10, 100)
y1 = np.sin(x)
y2 = np.cos(x)

# Create the plot
fig, ax = plt.subplots(figsize=(10, 6))
ax.plot(x, y1, label='Sine')
ax.plot(x, y2, label='Cosine')

# Add a legend with a title containing an icon
legend = ax.legend(title='★ Trigonometric Functions ★')
legend.get_title().set_fontweight('bold')

# Add labels and title
ax.set_xlabel('X-axis')
ax.set_ylabel('Y-axis')
ax.set_title('Sine and Cosine Functions with Iconic Legend Title - how2matplotlib.com')

# Display the plot
plt.show()

# Print output
print("Legend with iconic title added successfully")
Output:
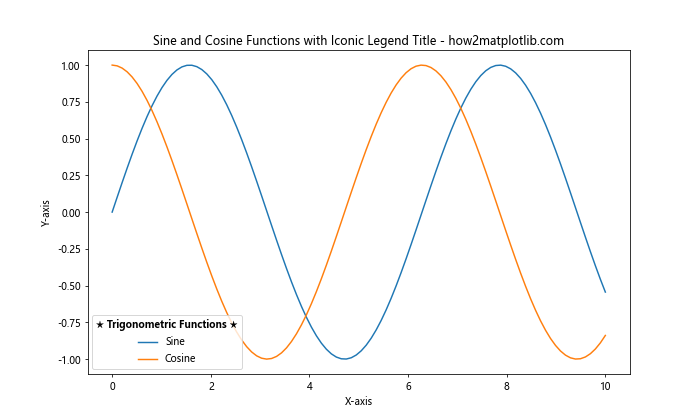
In this example, we’ve added star symbols (★) to the legend title using Unicode characters. This technique can be used with various symbols to enhance the visual appeal of your legend titles.
Dynamic Legend Titles
In some cases, you might want to create legend titles that dynamically reflect the content of your data. This can be particularly useful when working with data that changes over time or across different plot iterations.
import matplotlib.pyplot as plt
import numpy as np

# Generate sample data
x = np.linspace(0, 10, 100)
y1 = np.sin(x)
y2 = np.cos(x)

# Calculate some statistics
max_val = max(np.max(y1), np.max(y2))
min_val = min(np.min(y1), np.min(y2))

# Create the plot
fig, ax = plt.subplots(figsize=(10, 6))
ax.plot(x, y1, label='Sine')
ax.plot(x, y2, label='Cosine')

# Add a legend with a dynamic title
legend_title = f"Trigonometric Functions\nMax: {max_val:.2f}, Min: {min_val:.2f}"
legend = ax.legend(title=legend_title)
legend.get_title().set_fontsize('small')

# Add labels and title
ax.set_xlabel('X-axis')
ax.set_ylabel('Y-axis')
ax.set_title('Sine and Cosine Functions with Dynamic Legend Title - how2matplotlib.com')

# Display the plot
plt.show()

# Print output
print("Legend with dynamic title added successfully")
Output:
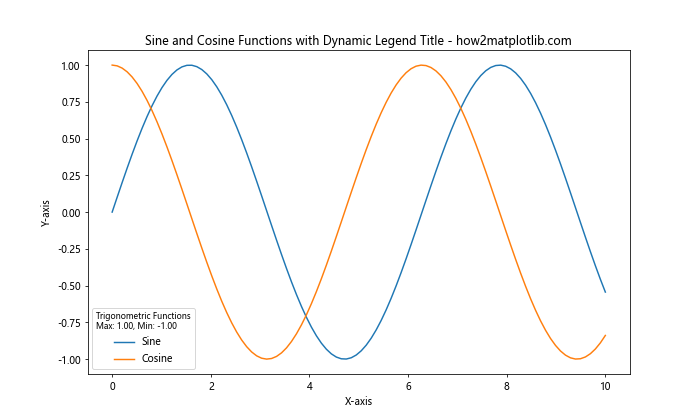
In this example, we calculate the maximum and minimum values of our data and incorporate them into the legend title. This approach can be extended to include other relevant statistics or information that changes based on the data being plotted.
Legend Titles in Subplots
When working with multiple subplots, you might want to add titled legends to each subplot. Here’s how you can achieve this:
import matplotlib.pyplot as plt
import numpy as np

# Generate sample data
x = np.linspace(0, 10, 100)
y1 = np.sin(x)
y2 = np.cos(x)
y3 = np.tan(x)
y4 = x**2

# Create the plot with subplots
fig, (ax1, ax2) = plt.subplots(1, 2, figsize=(15, 6))

# First subplot
ax1.plot(x, y1, label='Sine')
ax1.plot(x, y2, label='Cosine')
legend1 = ax1.legend(title='Trigonometric Functions')
legend1.get_title().set_fontweight('bold')
ax1.set_title('Subplot 1: Sine and Cosine - how2matplotlib.com')

# Second subplot
ax2.plot(x, y3, label='Tangent')
ax2.plot(x, y4, label='Quadratic')
legend2 = ax2.legend(title='Other Functions')
legend2.get_title().set_fontweight('bold')
ax2.set_title('Subplot 2: Tangent and Quadratic - how2matplotlib.com')

# Adjust layout and display the plot
plt.tight_layout()
plt.show()

# Print output
print("Legends with titles added to subplots successfully")
Output:
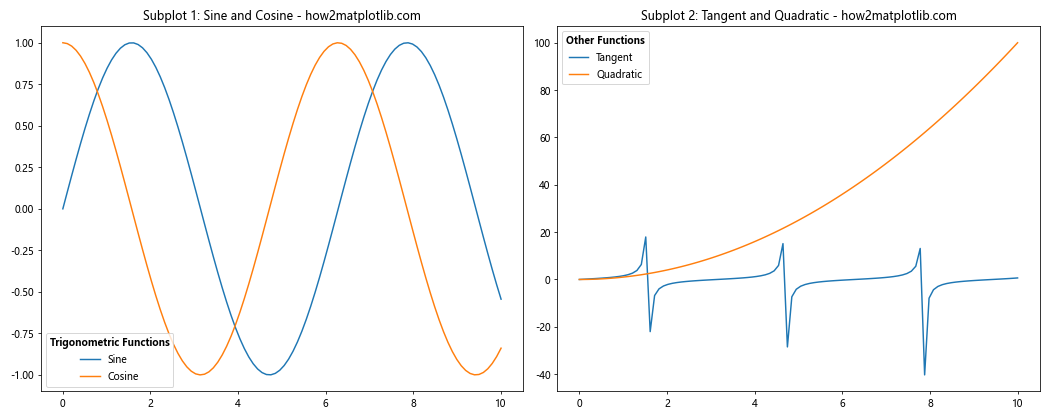
In this example, we create two subplots, each with its own legend and title. This approach allows you to organize complex data visualizations while maintaining clear and informative legends for each subplot.
Customizing Legend Title Position
While the default position of the legend title is above the legend entries, you can customize this position for a unique layout.
import matplotlib.pyplot as plt
import numpy as np

# Generate sample data
x = np.linspace(0, 10, 100)
y1 = np.sin(x)
y2 = np.cos(x)

# Create the plot
fig, ax = plt.subplots(figsize=(10, 6))
ax.plot(x, y1, label='Sine')
ax.plot(x, y2, label='Cosine')

# Add a legend with a custom-positioned title
legend = ax.legend(bbox_to_anchor=(1.05, 1), loc='upper left')
plt.text(1.05, 1.05, 'Trigonometric Functions', transform=ax.transAxes,
         fontsize=12, fontweight='bold', ha='left', va='bottom')

# Add labels and title
ax.set_xlabel('X-axis')
ax.set_ylabel('Y-axis')
ax.set_title('Sine and Cosine Functions with Custom Legend Title Position - how2matplotlib.com')

# Adjust layout and display the plot
plt.tight_layout()
plt.show()

# Print output
print("Legend with custom-positioned title added successfully")
Output:
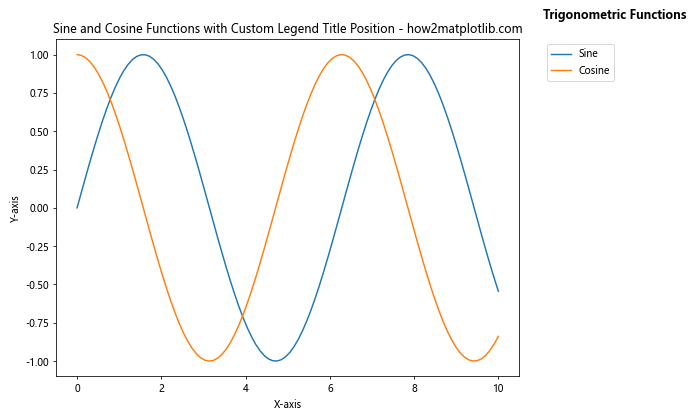
In this example, we position the legend outside the plot area using bbox_to_anchor and then add a custom text object for the title. This allows for more flexible positioning of both the legend and its title.
Best Practices for Legend Titles
When adding titles to legends in Matplotlib, consider the following best practices:
- Keep titles concise: Legend titles should be brief and to the point, providing just enough context to understand the legend entries.
Use appropriate font sizes: Ensure that the title is readable but not overpowering. Generally, the title should be slightly larger or bolder than the legend entries.
Consider color and contrast: Make sure the title is easily distinguishable from the background and other plot elements.
Be consistent: If you have multiple plots or subplots, maintain a consistent style for legend titles across all of them.
Use LaTeX for mathematical expressions: When including equations or mathematical symbols, use LaTeX formatting for clarity and professional appearance.
Position carefully: Place the legend and its title where they don’t obscure important parts of the plot.
Use dynamic titles when appropriate: For plots that change based on data, consider using dynamic titles that reflect the current state of the data.
Test for readability: Always check how your legend titles look at different plot sizes and on different display devices.
Matplotlib Add Title to Legend Conclusion
Adding titles to legends in Matplotlib is a powerful way to enhance the clarity and informativeness of your data visualizations. From simple title additions to complex customizations and animations, Matplotlib provides a wide range of options for creating professional-looking legend titles. By mastering these techniques, you can create more effective and visually appealing plots that clearly communicate your data insights. Remember to consider your audience and the purpose of your visualization when designing legend titles, and don’t hesitate to experiment with different styles and approaches to find what works best for your specific needs. As you continue to work with Matplotlib, you’ll discover even more ways to customize and enhance your plots. The flexibility and depth of Matplotlib make it an invaluable tool for data scientists, researchers, and anyone working with data visualization in Python.