Matplotlib Figure Title
In data visualization, it is crucial to provide proper titles to your figures to convey the intended message effectively. Matplotlib, a popular data visualization library in Python, offers various ways to add titles to your plots.
Adding a Simple Title in Matplotlib
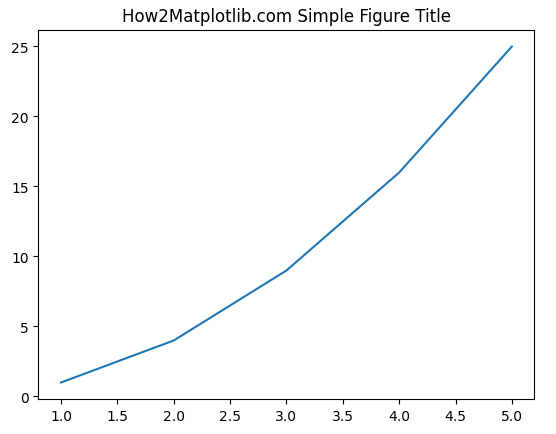
The most common way to add a title to a matplotlib figure is by using the title() function. It allows you to specify the title text, and you can further customize its appearance by modifying parameters like font size and font weight.
Here’s an example of how you can add a simple title to a figure:
import matplotlib.pyplot as plt

# Create a figure
fig, ax = plt.subplots()

# Plot some data
x = [1, 2, 3, 4, 5]
y = [1, 4, 9, 16, 25]
ax.plot(x, y)

# Add a title
ax.set_title("How2Matplotlib.com Simple Figure Title")

# Display the figure
plt.show()
The code above will produce the following figure:
Adding a Multiline Title in Matplotlib
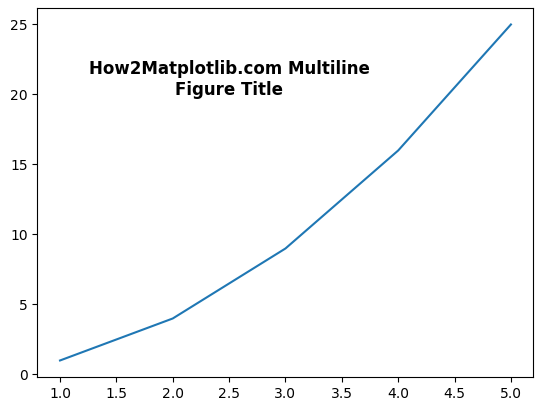
Matplotlib also allows you to create a title with multiple lines using the text() function. You can achieve this by inserting newline characters ('\n') in your title text.
import matplotlib.pyplot as plt

# Create a figure
fig, ax = plt.subplots()

# Plot some data
x = [1, 2, 3, 4, 5]
y = [1, 4, 9, 16, 25]
ax.plot(x, y)

# Add a multiline title
title_text = "How2Matplotlib.com Multiline\nFigure Title"
ax.text(2.5, 20, title_text, ha='center', fontsize=12, fontweight='bold')

# Display the figure
plt.show()
In this example, we have added a title with two lines: “Multiline” and “Figure Title.” The text() function also allows you to customize the font size, font weight, and alignment.
Customizing the Title Appearance in Matplotlib
Apart from the basic customization options mentioned above, you can further modify various aspects to make your title stand out. Some useful parameters for modifying the title appearance include:
fontsize: Sets the font size (in points) of the title.fontweight: Specifies the font weight of the title (e.g., “bold,” “normal”).color: Changes the color of the title text.verticalalignment: Adjusts the vertical alignment of the title text within the available space.
Let’s see how you can use these parameters to customize the title appearance:
import matplotlib.pyplot as plt

# Create a figure
fig, ax = plt.subplots()

# Plot some data
x = [1, 2, 3, 4, 5]
y = [1, 4, 9, 16, 25]
ax.plot(x, y)

# Add a customized title
title_text = "How2Matplotlib.com Customized Figure Title"
ax.set_title(title_text, fontsize=16, fontweight='bold', color='blue', verticalalignment='bottom')

# Display the figure
plt.show()
In this example, we have increased the font size to 16 points, set the font weight to “bold,” changed the title color to blue, and aligned it to the bottom.

Matplotlib Figure Title Code Examples
Here are some additional code examples demonstrating different ways to add titles to matplotlib figures:
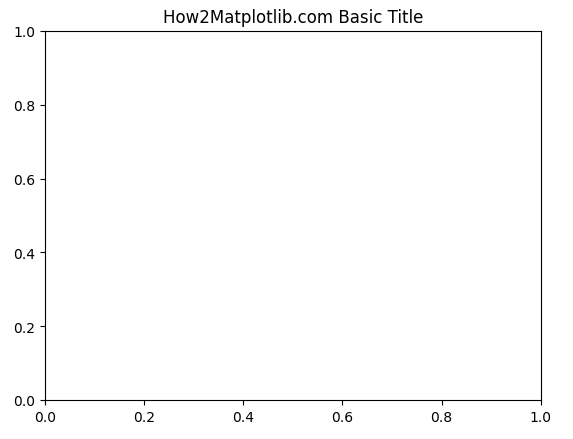
Example 1: Basic Title
import matplotlib.pyplot as plt

fig, ax = plt.subplots()
ax.set_title("How2Matplotlib.com Basic Title")
plt.show()
Output:
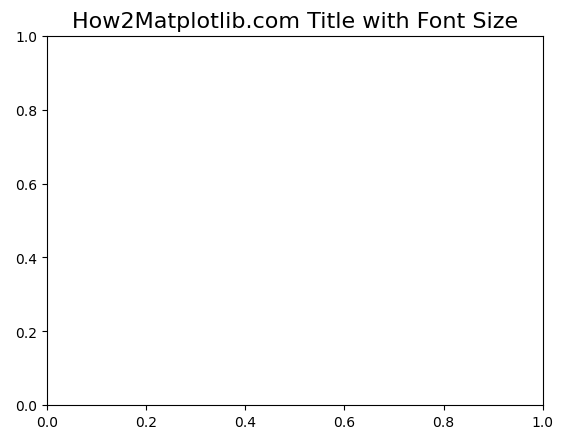
Example 2: Title with Font Size
import matplotlib.pyplot as plt

fig, ax = plt.subplots()
ax.set_title("How2Matplotlib.com Title with Font Size", fontsize=16)
plt.show()
Output:
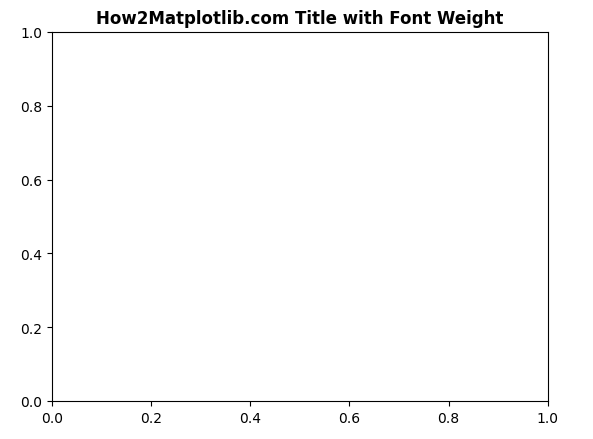
Example 3: Title with Font Weight
import matplotlib.pyplot as plt

fig, ax = plt.subplots()
ax.set_title("How2Matplotlib.com Title with Font Weight", fontweight='bold')
plt.show()
Output:
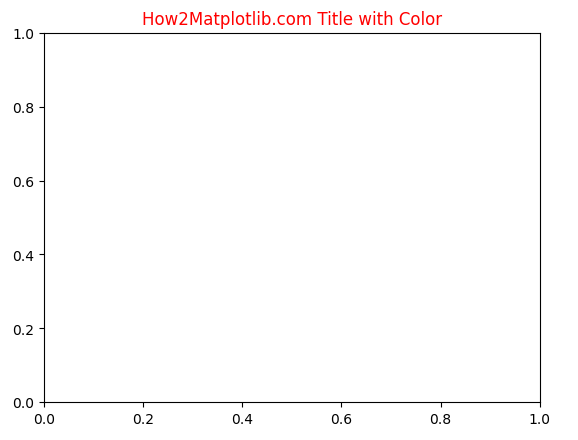
Example 4: Title with Color
import matplotlib.pyplot as plt

fig, ax = plt.subplots()
ax.set_title("How2Matplotlib.com Title with Color", color='red')
plt.show()
Output:
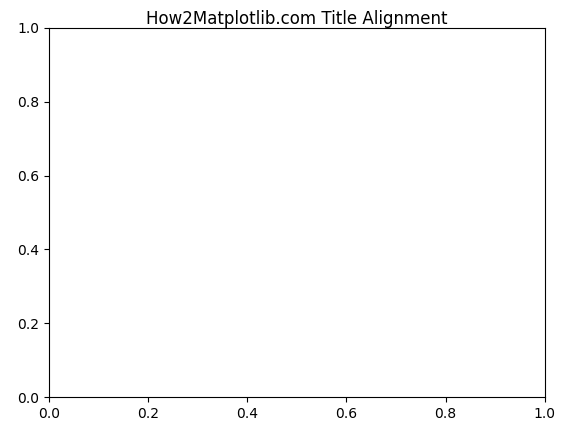
Example 5: Title Alignment
import matplotlib.pyplot as plt

fig, ax = plt.subplots()
ax.set_title("How2Matplotlib.com Title Alignment", verticalalignment='top')
plt.show()
Output:
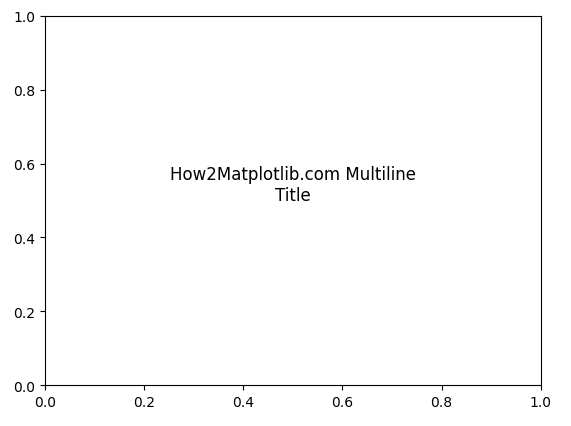
Example 6: Multiline Title
import matplotlib.pyplot as plt

fig, ax = plt.subplots()
title_text = "How2Matplotlib.com Multiline\nTitle"
ax.text(0.5, 0.5, title_text, ha='center', fontsize=12)
plt.show()
Output:
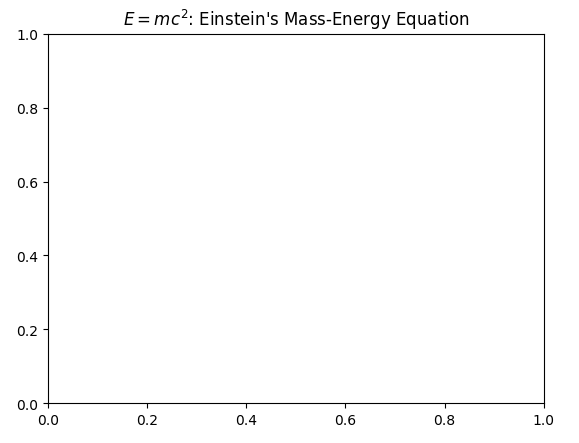
Example 7: Title with LaTeX Expression
import matplotlib.pyplot as plt

fig, ax = plt.subplots()
ax.set_title(r"$E=mc^2$: Einstein's Mass-Energy Equation")
plt.show()
Output:
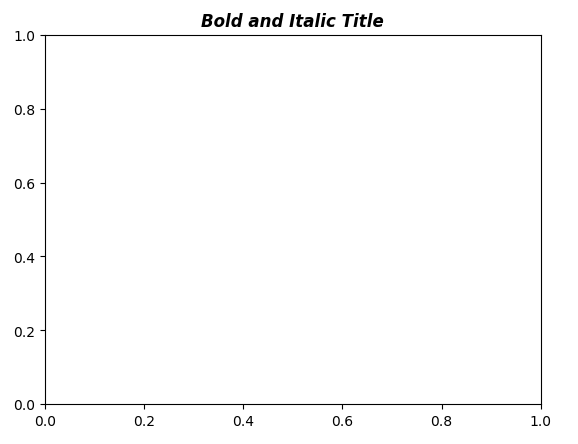
Example 8: Title with Bold and Italic Font
import matplotlib.pyplot as plt

fig, ax = plt.subplots()
ax.set_title("Bold and Italic Title", fontstyle='italic', fontweight='bold')
plt.show()
Output:
Example 9: Title with Rotated Text
import matplotlib.pyplot as plt

fig, ax = plt.subplots()
ax.set_title("How2Matplotlib.com Title with Rotated Text", rotation=45)
plt.show()
Output:

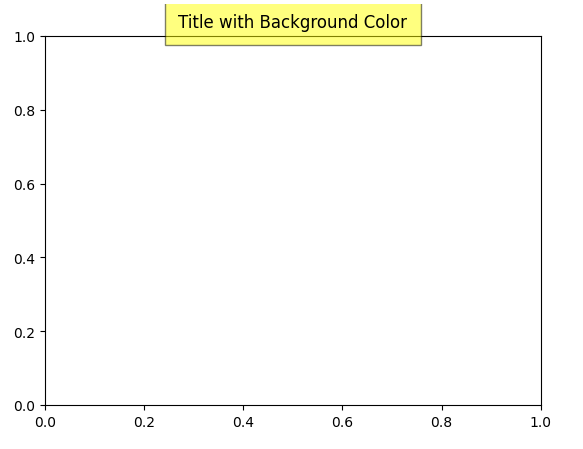
Example 10: Title with Background Color
import matplotlib.pyplot as plt

fig, ax = plt.subplots()
ax.set_title("Title with Background Color", bbox={'facecolor':'yellow', 'alpha':0.5, 'pad':10})
plt.show()
Output:
Matplotlib Figure Title Conclusion
Adding appropriate titles to your matplotlib figures not only provides essential information but also enhances the overall aesthetics of your visualizations. By leveraging the various customization options available, you can create eye-catching titles that effectively convey your intended message. Experiment with different combinations to find the style that best suits your data visualization needs.