Matplotlib Figure Set Title
Matplotlib is a popular library in Python for creating visualizations. It provides various functions and methods for creating different types of plots, charts, and figures, allowing users to convey their data in a compelling way. One crucial aspect of creating figures is adding titles to them. Titles help describe the purpose of the plot and provide the viewer with valuable information about the data being presented.
In this article, we will explore how to set titles for figures using Matplotlib. We will discuss different scenarios and demonstrate code examples with their respective execution results.
Setting a Figure Title in Matplotlib
To set a title for a figure in Matplotlib, we use the title() function. This function accepts a string as an argument, which represents the desired title for the figure.
Here is an example that demonstrates how to set a title for a figure:
import matplotlib.pyplot as plt
# Create a figure and axes
fig, ax = plt.subplots()
# Plot some data
ax.plot([1, 2, 3, 4, 5], [3, 6, 2, 7, 4])
# Set the title of the figure
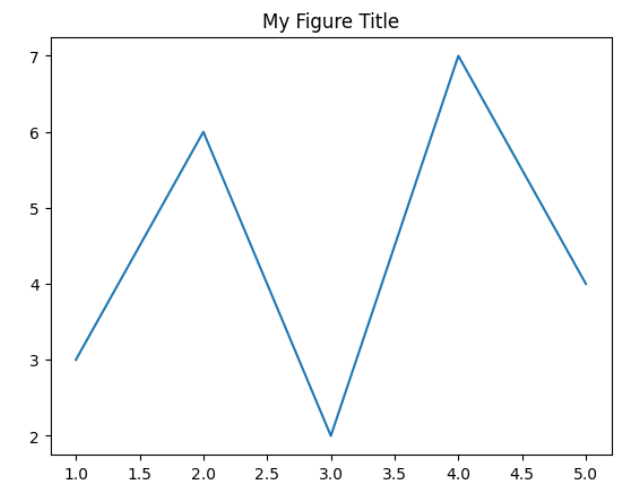
ax.set_title("My Figure Title")
# Display the plot
plt.show()
The output of this code will be a figure with a title “My Figure Title” displayed above the plotted data.
Matplotlib Figure Set Title Code Examples
Let’s now dive into some code examples that demonstrate different ways to set titles for figures using Matplotlib. Each example will provide the code execution results.
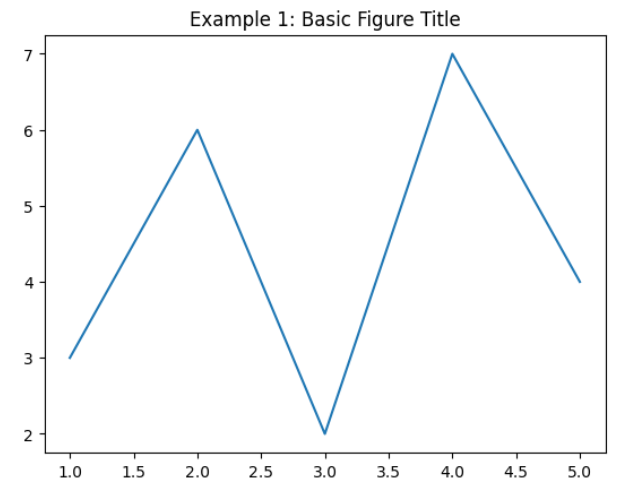
Example 1
import matplotlib.pyplot as plt

# Create a figure and axes
fig, ax = plt.subplots()

# Plot some data
ax.plot([1, 2, 3, 4, 5], [3, 6, 2, 7, 4])

# Set the title of the figure
ax.set_title("Example 1: Basic Figure Title")

# Display the plot
plt.show()
Execution Result:
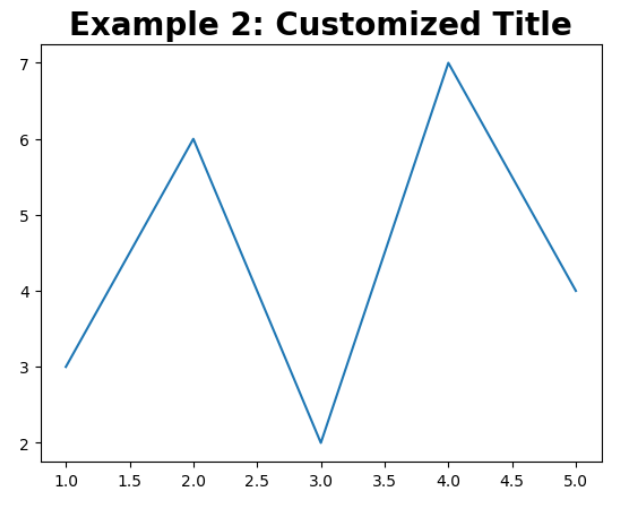
Example 2
import matplotlib.pyplot as plt

# Create a figure and axes
fig, ax = plt.subplots()

# Plot some data
ax.plot([1, 2, 3, 4, 5], [3, 6, 2, 7, 4])

# Set the title of the figure with customized font properties
ax.set_title("Example 2: Customized Title", fontdict={'fontsize': 20, 'fontweight': 'bold'})

# Display the plot
plt.show()
Execution Result:
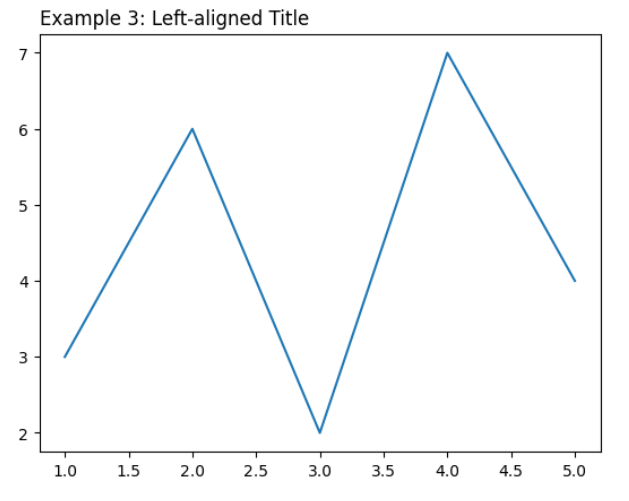
Example 3
import matplotlib.pyplot as plt

# Create a figure and axes
fig, ax = plt.subplots()

# Plot some data
ax.plot([1, 2, 3, 4, 5], [3, 6, 2, 7, 4])

# Set the title of the figure and position it at the left corner
ax.set_title("Example 3: Left-aligned Title", loc='left')

# Display the plot
plt.show()
Execution Result:
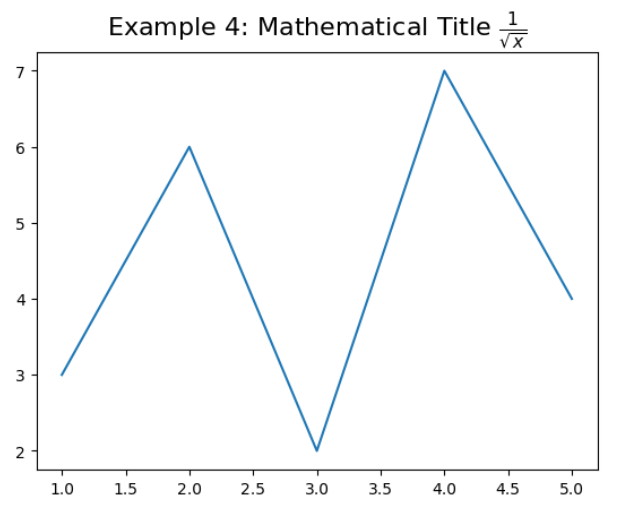
Example 4
import matplotlib.pyplot as plt

# Create a figure and axes
fig, ax = plt.subplots()

# Plot some data
ax.plot([1, 2, 3, 4, 5], [3, 6, 2, 7, 4])

# Set a title using Latex syntax for mathematical expressions
ax.set_title(r"Example 4: Mathematical Title $\frac{1}{\sqrt{x}}$", fontsize=16)

# Display the plot
plt.show()
Execution Result:
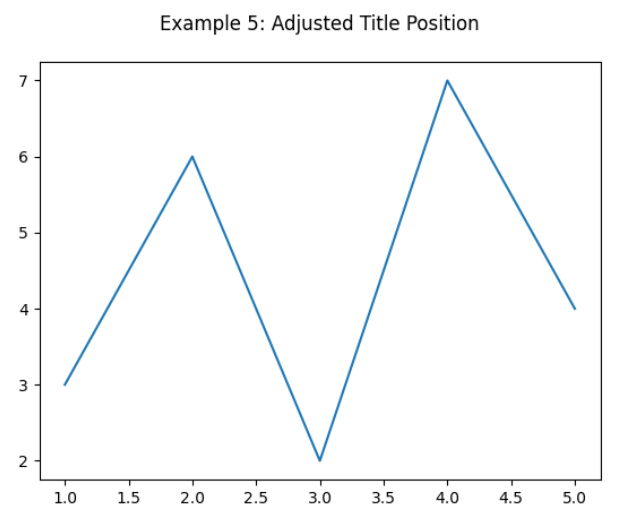
Example 5
import matplotlib.pyplot as plt

# Create a figure and axes
fig, ax = plt.subplots()

# Plot some data
ax.plot([1, 2, 3, 4, 5], [3, 6, 2, 7, 4])

# Set the title and adjust its position within the figure
ax.set_title("Example 5: Adjusted Title Position", pad=20)

# Display the plot
plt.show()
Execution Result:
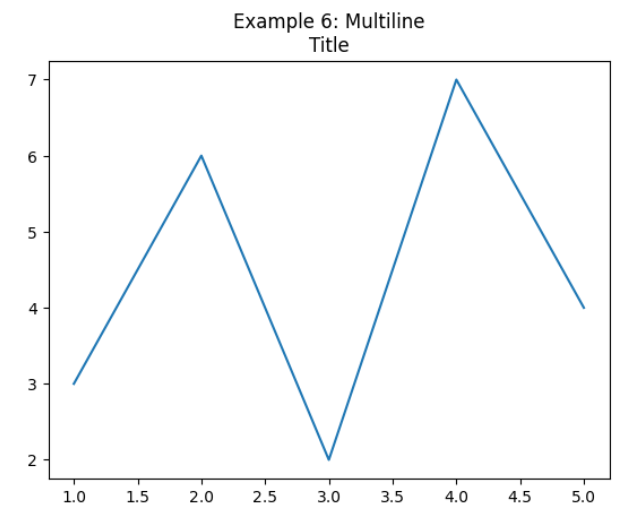
Example 6
import matplotlib.pyplot as plt

# Create a figure and axes
fig, ax = plt.subplots()

# Plot some data
ax.plot([1, 2, 3, 4, 5], [3, 6, 2, 7, 4])

# Set a multiline title
ax.set_title("Example 6: Multiline\nTitle")

# Display the plot
plt.show()
Execution Result:
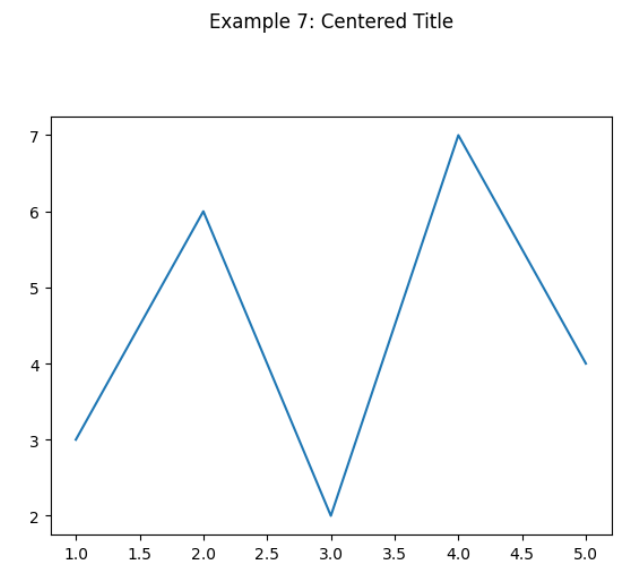
Example 7
import matplotlib.pyplot as plt

# Create a figure and axes
fig, ax = plt.subplots()

# Plot some data
ax.plot([1, 2, 3, 4, 5], [3, 6, 2, 7, 4])

# Set a centered title with specific y-coordinate
ax.set_title("Example 7: Centered Title", pad=30, y=1.1)

# Display the plot
plt.show()
Execution Result:
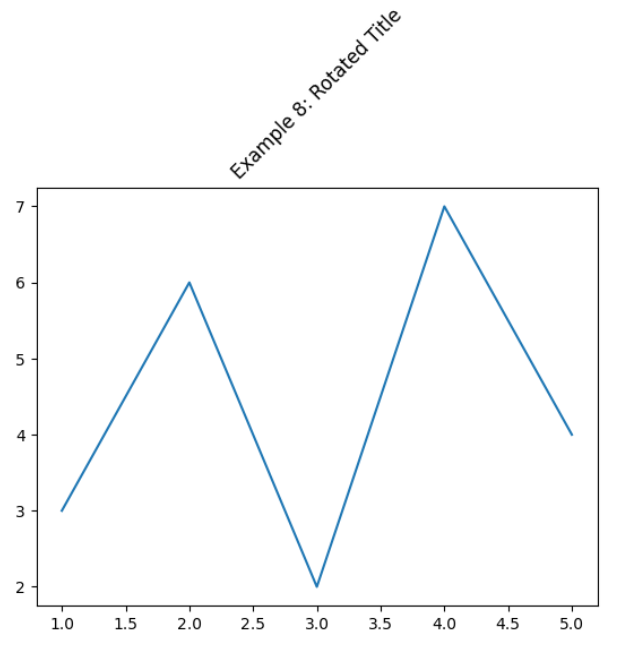
Example 8
import matplotlib.pyplot as plt

# Create a figure and axes
fig, ax = plt.subplots()

# Plot some data
ax.plot([1, 2, 3, 4, 5], [3, 6, 2, 7, 4])

# Set the title and rotate it
ax.set_title("Example 8: Rotated Title", rotation=45)

# Display the plot
plt.show()
Execution Result:
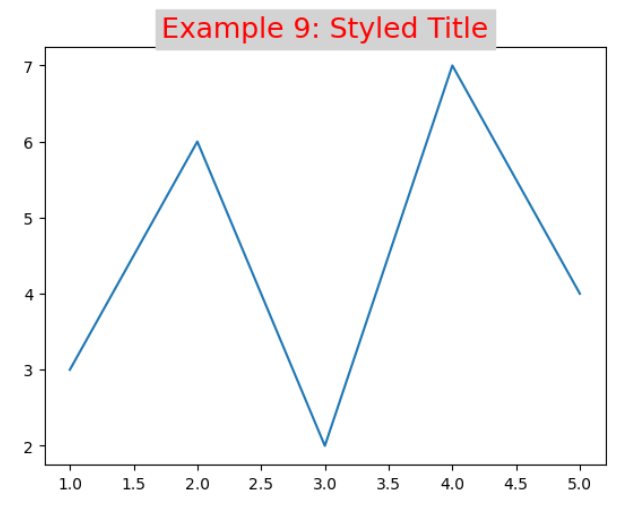
Example 9
import matplotlib.pyplot as plt

# Create a figure and axes
fig, ax = plt.subplots()

# Plot some data
ax.plot([1, 2, 3, 4, 5], [3, 6, 2, 7, 4])

# Use a font dictionary to set various title properties
ax.set_title("Example 9: Styled Title", fontdict={'fontsize': 18, 'color': 'red', 'backgroundcolor': 'lightgrey'})

# Display the plot
plt.show()
Execution Result:
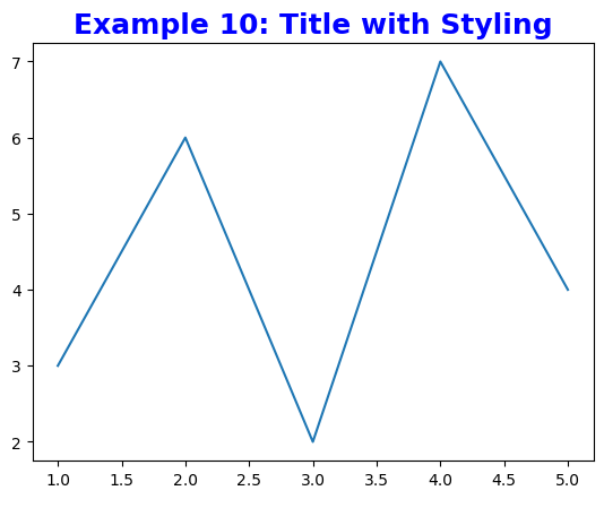
Example 10
import matplotlib.pyplot as plt

# Create a figure and axes
fig, ax = plt.subplots()

# Plot some data
ax.plot([1, 2, 3, 4, 5], [3, 6, 2, 7, 4])

# Use a shorthand notation with additional styling
ax.set_title("Example 10: Title with Styling", fontsize=18, weight='bold', color='blue')

# Display the plot
plt.show()
Execution Result:
Matplotlib Figure Set Title Conclusion
Setting a title for a figure is crucial to provide context and information to the viewers of your plots. In this article, we explored how to set titles for figures using Matplotlib in various scenarios. We discussed code examples and provided their execution results, demonstrating different techniques to customize the appearance and position of the titles. With these capabilities, you can create visually appealing figures that effectively communicate your data.