Matplotlib Figure Save
Matplotlib is a powerful and comprehensive data visualization library in Python. It provides a wide range of tools and functionalities to create high-quality plots and figures for various purposes. One of the essential features of Matplotlib is the ability to save figures into different file formats. In this article, we will explore how to save Matplotlib figures using the savefig() function and discuss different file formats supported by Matplotlib.
Saving Figures with Matplotlib
To save a figure using Matplotlib, we use the savefig() function. This function allows us to specify the filename and format of the file we want to save. The general syntax is as follows:
plt.savefig(filename, format='file_format')
Let’s dive into some code examples to understand this better.
Code Example 1: Saving a Figure as PNG
import matplotlib.pyplot as plt

x = [1, 2, 3, 4, 5]
y = [2, 4, 6, 8, 10]

plt.plot(x, y)
plt.xlabel('X-axis')
plt.ylabel('Y-axis')
plt.title('My First Plot')

plt.savefig('my_plot.png', format='png')
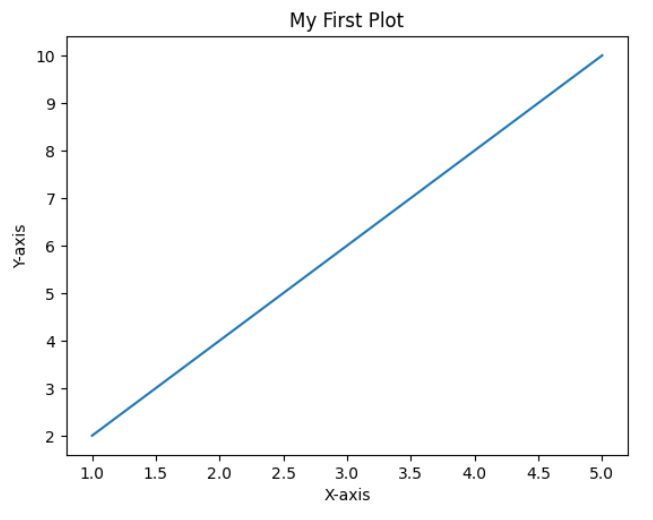
In this example, we create a simple line plot using Matplotlib. We set the x and y coordinates and then use the plot() function to plot the data. After adding labels and a title, we save the figure as “my_plot.png” in PNG format using the savefig() function.
Code Example 2: Saving a Figure as PDF
import matplotlib.pyplot as plt

x = [1, 2, 3, 4, 5]
y = [2, 4, 6, 8, 10]

plt.plot(x, y)
plt.xlabel('X-axis')
plt.ylabel('Y-axis')
plt.title('My Second Plot')

plt.savefig('my_plot.pdf', format='pdf')
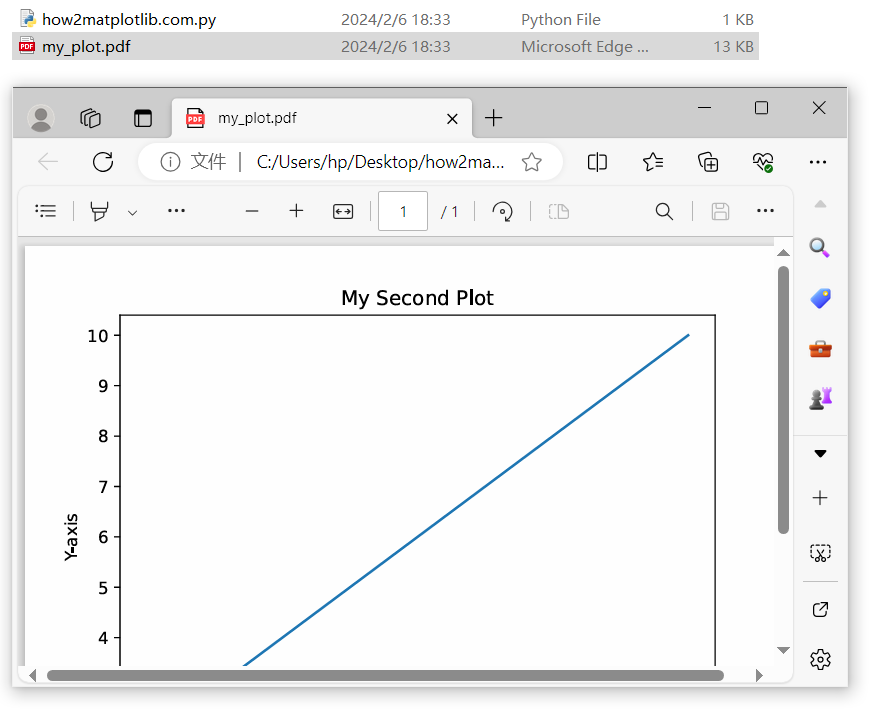
In this example, we plot the same data as before but save it in PDF format by specifying the format parameter as 'pdf' in the savefig() function.
Code Example 3: Saving a Figure as JPEG
import matplotlib.pyplot as plt

x = [1, 2, 3, 4, 5]
y = [2, 4, 6, 8, 10]

plt.plot(x, y)
plt.xlabel('X-axis')
plt.ylabel('Y-axis')
plt.title('My Third Plot')

plt.savefig('my_plot.jpg', format='jpeg')
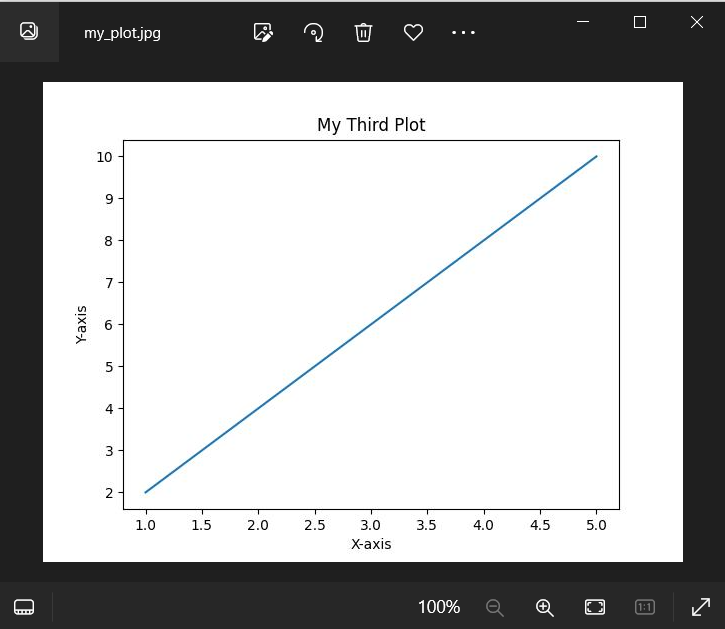
Here, we create a line plot and save it in JPEG format using the savefig() function with the format parameter set to 'jpeg'.
Code Example 4: Saving a Figure with Custom DPI
import matplotlib.pyplot as plt

x = [1, 2, 3, 4, 5]
y = [2, 4, 6, 8, 10]

plt.plot(x, y)
plt.xlabel('X-axis')
plt.ylabel('Y-axis')
plt.title('My Fourth Plot')

plt.savefig('my_plot.png', dpi=300)
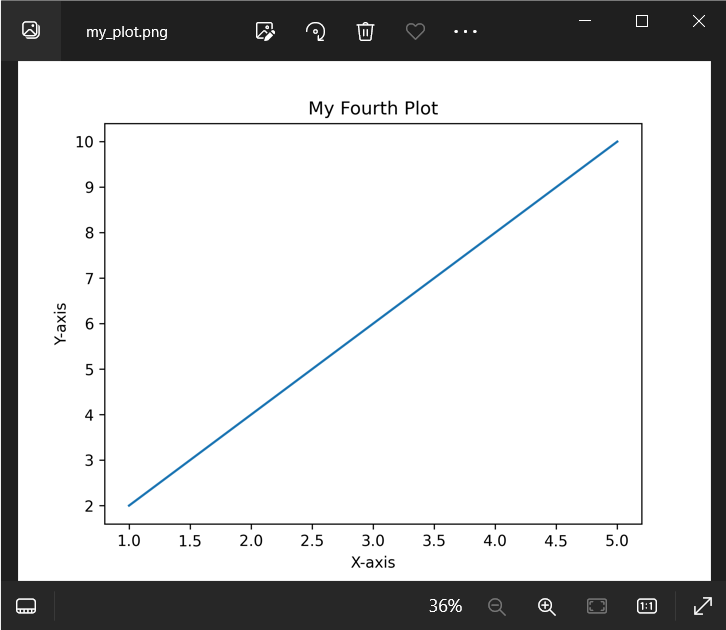
In this example, we save a figure in PNG format but specify a custom DPI (dots per inch) value of 300 using the dpi parameter. This can be useful when we need high-resolution figures for printing or other purposes.
Code Example 5: Saving Only Part of a Figure
import matplotlib.pyplot as plt

x = [1, 2, 3, 4, 5]
y1 = [2, 4, 6, 8, 10]
y2 = [1, 3, 5, 7, 9]

plt.plot(x, y1, label='Line 1')
plt.plot(x, y2, label='Line 2')
plt.xlabel('X-axis')
plt.ylabel('Y-axis')
plt.title('My Fifth Plot')
plt.legend()

plt.savefig('my_plot.png', bbox_inches='tight')
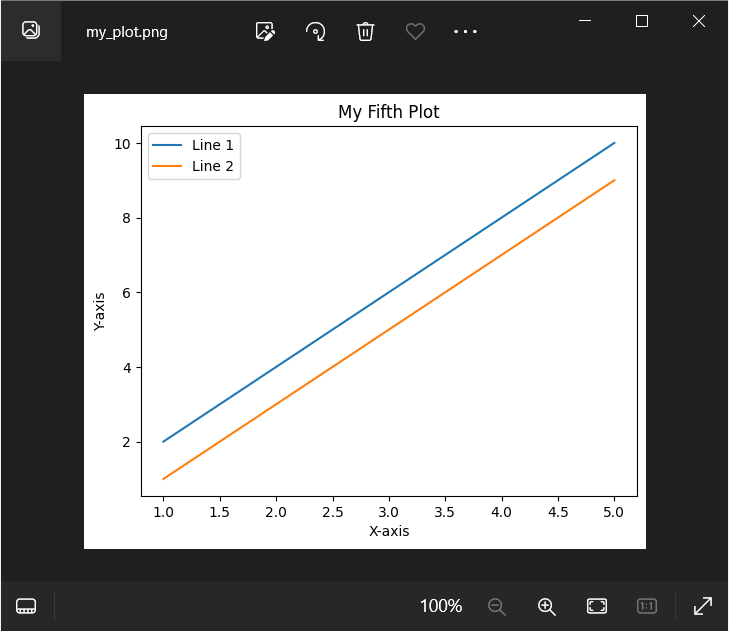
Here, we create a figure with two lines and a legend. By setting the bbox_inches parameter to 'tight', we instruct Matplotlib to save only the area containing the plotted lines and labels, excluding any empty spaces around them.
Code Example 6: Saving a Figure with Transparent Background
import matplotlib.pyplot as plt

data = [1, 2, 3, 4, 5]

plt.plot(data)
plt.xlabel('X-axis')
plt.ylabel('Y-axis')
plt.title('My Sixth Plot')

plt.savefig('my_plot.png', transparent=True)
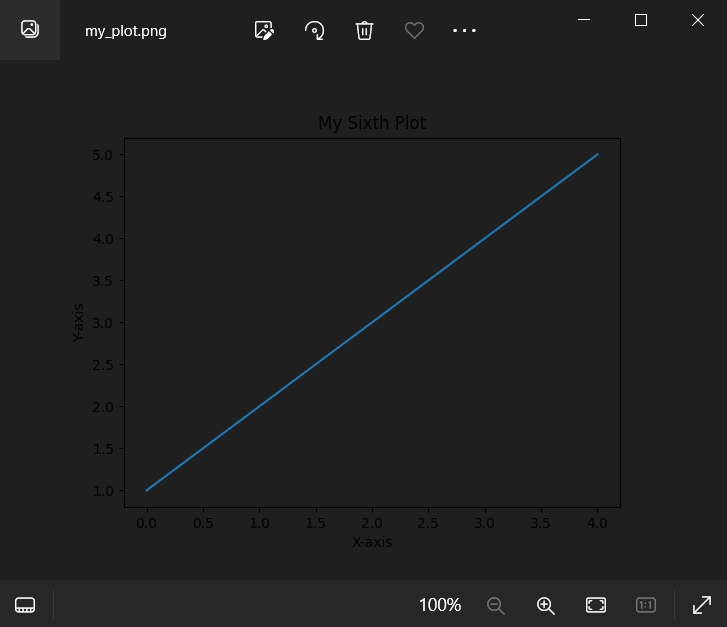
This example illustrates how to save a figure with a transparent background. By setting the transparent parameter to True, the background of the saved figure will be transparent, allowing us to overlay it on other images or backgrounds.
Code Example 7: Saving a Figure with Different Aspect Ratio
import matplotlib.pyplot as plt

x = [1, 2, 3, 4, 5]
y = [2, 4, 6, 8, 10]

plt.figure(figsize=(6, 3))
plt.plot(x, y)
plt.xlabel('X-axis')
plt.ylabel('Y-axis')
plt.title('My Seventh Plot')

plt.savefig('my_plot.png', dpi=300)
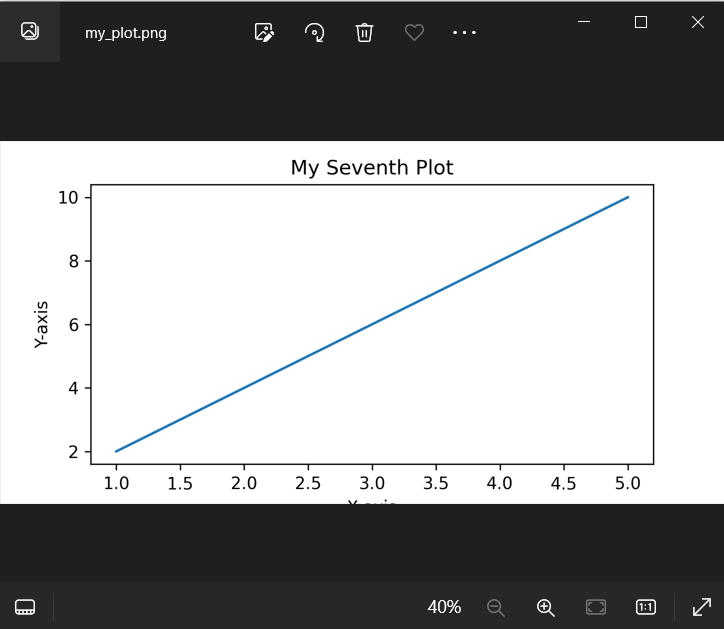
In this example, we change the aspect ratio of the figure by using the figsize parameter in the figure() function. Here, we set it to (6, 3), which means the figure will have a width of 6 inches and a height of 3 inches.
Code Example 8: Saving Multiple Figures
import matplotlib.pyplot as plt

x1 = [1, 2, 3, 4, 5]
y1 = [2, 4, 6, 8, 10]

plt.figure(1)
plt.plot(x1, y1)
plt.xlabel('X-axis')
plt.ylabel('Y-axis')
plt.title('Figure 1')

x2 = [1, 3, 5, 7, 9]
y2 = [1, 4, 9, 16, 25]

plt.figure(2)
plt.plot(x2, y2)
plt.xlabel('X-axis')
plt.ylabel('Y-axis')
plt.title('Figure 2')

plt.savefig('figure1.png')
plt.savefig('figure2.png')
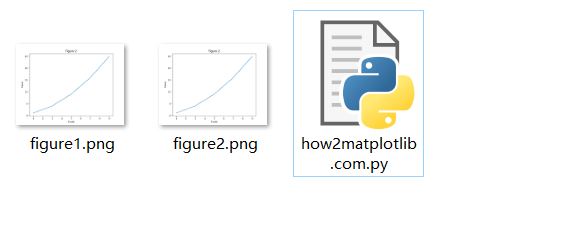
Here, we create two separate figures with different data and titles. We assign a number to each figure using the figure() function. After plotting and customizing each figure, we save them to different files using the savefig() function.
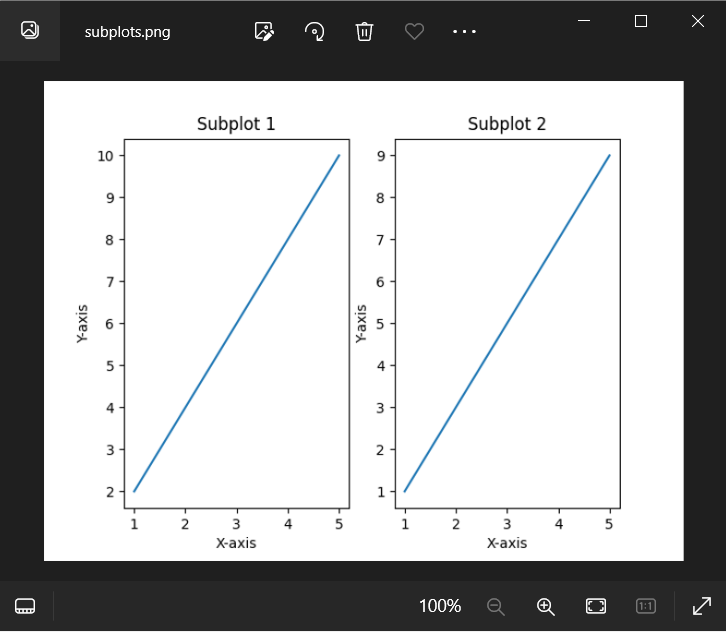
Code Example 9: Saving Subplots
import matplotlib.pyplot as plt

x = [1, 2, 3, 4, 5]
y1 = [2, 4, 6, 8, 10]
y2 = [1, 3, 5, 7, 9]

plt.subplot(1, 2, 1)
plt.plot(x, y1)
plt.xlabel('X-axis')
plt.ylabel('Y-axis')
plt.title('Subplot 1')

plt.subplot(1, 2, 2)
plt.plot(x, y2)
plt.xlabel('X-axis')
plt.ylabel('Y-axis')
plt.title('Subplot 2')

plt.savefig('subplots.png')
In this example, we create a figure with two subplots arranged in a 1×2 grid. We use the subplot() function to specify the grid and create individual plots within each subplot. Finally, we save the figure with both subplots using the savefig() function.
Code Example 10: Saving Figure with Custom Resolution
import matplotlib.pyplot as plt

x = [1, 2, 3, 4, 5]
y = [1, 4, 9, 16, 25]

plt.plot(x, y)
plt.xlabel('X-axis')
plt.ylabel('Y-axis')
plt.title('Custom Resolution Plot')

plt.savefig('custom_resolution_plot.png', dpi=150)
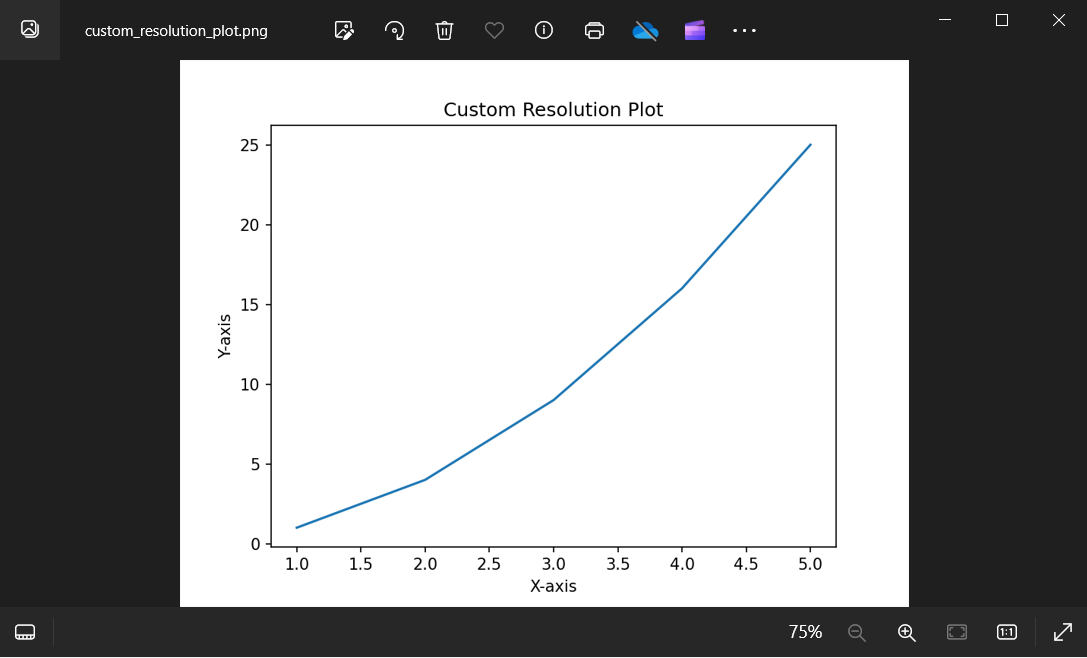
In this final example, we save a figure with a custom resolution of 150 DPI by specifying the dpi parameter as 150 in the savefig() function.
Matplotlib Figure Save Conclusion
In this article, we explored how to save Matplotlib figures into various file formats using the savefig() function. We covered examples of saving figures as PNG, PDF, JPEG, and other formats. We also learned about additional parameters suchas dpi, bbox_inches, transparent, figsize, and saving multiple figures and subplots. With these features, we have the flexibility to save our figures in different formats and customize various aspects of the saved images.
Matplotlib provides a wide range of file formats for saving figures, including PNG, PDF, JPEG, SVG, and more. Each format has its advantages and use cases. PNG is widely used for web-based graphics and supports transparency. PDF is commonly used for high-quality printing and sharing documents. JPEG is suitable for photographs and images. SVG is a vector format commonly used for scalable graphics.
Remember that when saving figures, it is important to provide a descriptive and meaningful filename. This will help you easily identify and organize your saved figures later on. Additionally, make sure to include the correct file format extension in the filename to ensure compatibility and clarity.
Keep in mind that the quality and resolution of the saved figure can be adjusted using the dpi parameter. Higher DPI values result in better resolution but also larger file sizes. Consider the purpose of your saved figure and the intended use to find the appropriate balance between quality and file size.
Lastly, don’t forget to customize your plots before saving them. Matplotlib provides numerous options for customizing plot properties such as labels, titles, colors, markers, and more. Take advantage of these options to create visually appealing and informative figures.
In conclusion, Matplotlib provides a straightforward and powerful way to save figures in various file formats. By mastering the savefig() function and understanding its parameters, you can produce high-quality visualizations tailored to your specific needs and preferences. So go ahead, experiment with the examples provided, and unleash the full potential of Matplotlib for your data visualization tasks.