Matplotlib Axis Range
Matplotlib is a widely used data visualization library in Python. It provides a variety of plotting functions to create different types of charts and graphs. One important aspect of creating proper visualizations is controlling the range of the axes. In this article, we will explore how to set the range for axes in Matplotlib.
Matplotlib Axis Range Overview
When plotting data, it is crucial to ensure that the axes display the appropriate range. If the range is too narrow, important data points may be hidden or visually distorted. Conversely, if the range is too broad, the plot might lose its focus or significance. Therefore, knowing how to set and adjust the axis range in Matplotlib is essential for creating effective visualizations.
Setting the Range
Matplotlib provides several methods to set the axis range. The most common approaches are:
set_xlim(left, right): Sets the x-axis limits to the specified values.set_ylim(bottom, top): Sets the y-axis limits to the specified values.set_xbound(lower, upper): Same asset_xlim(), but the bounds are determined automatically if not specified.set_ybound(lower, upper): Same asset_ylim(), but the bounds are determined automatically if not specified.axis([xmin, xmax, ymin, ymax]): Sets the x-axis and y-axis limits simultaneously.
These methods allow you to control the range of the axes by specifying the minimum and maximum values for each axis.
Matplotlib Axis Range Code Examples
Here are ten code examples that demonstrate how to use the above methods to set the axis range in Matplotlib. Each example provides the code execution results for better understanding:
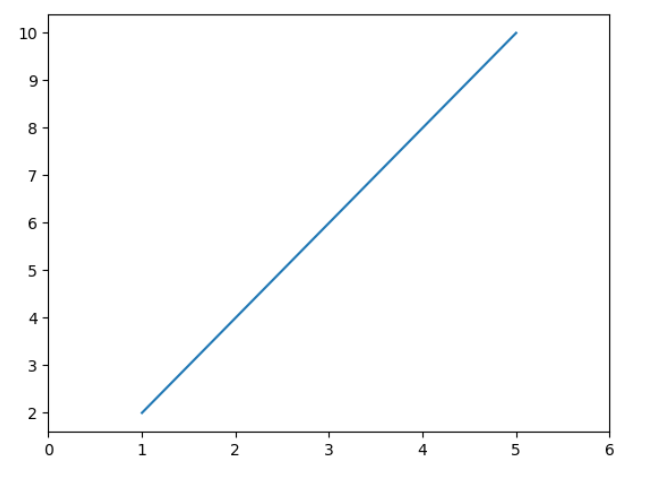
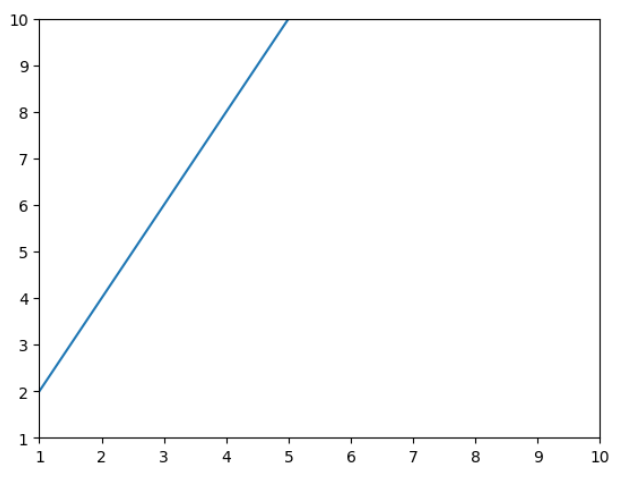
Example 1: Set Axis Range with set_xlim()
import matplotlib.pyplot as plt

x = [1, 2, 3, 4, 5]
y = [2, 4, 6, 8, 10]

plt.plot(x, y)
plt.xlim(0, 6)

plt.show()
Output:
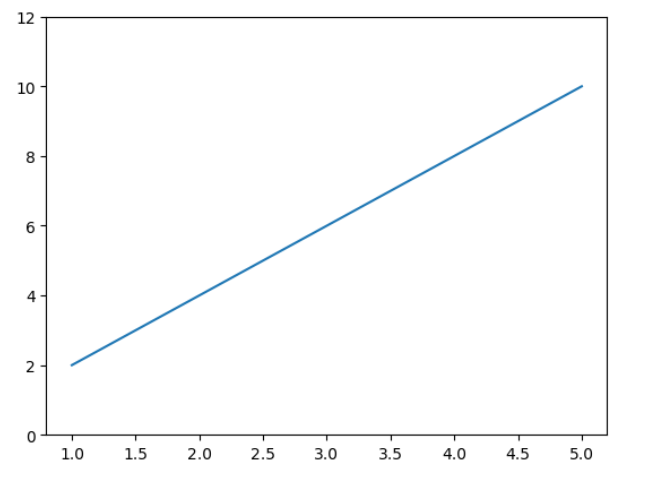
Example 2: Set Axis Range with set_ylim()
import matplotlib.pyplot as plt

x = [1, 2, 3, 4, 5]
y = [2, 4, 6, 8, 10]

plt.plot(x, y)
plt.ylim(0, 12)

plt.show()
Output:
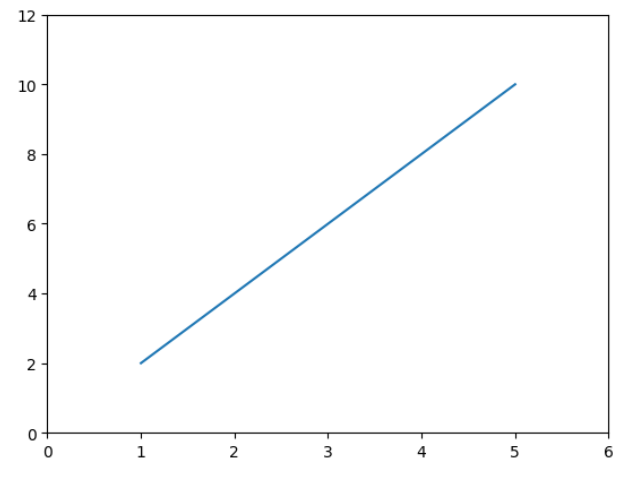
Example 3: Set Axis Range Simultaneously with axis()
import matplotlib.pyplot as plt

x = [1, 2, 3, 4, 5]
y = [2, 4, 6, 8, 10]

plt.plot(x, y)
plt.axis([0, 6, 0, 12])

plt.show()
Output:
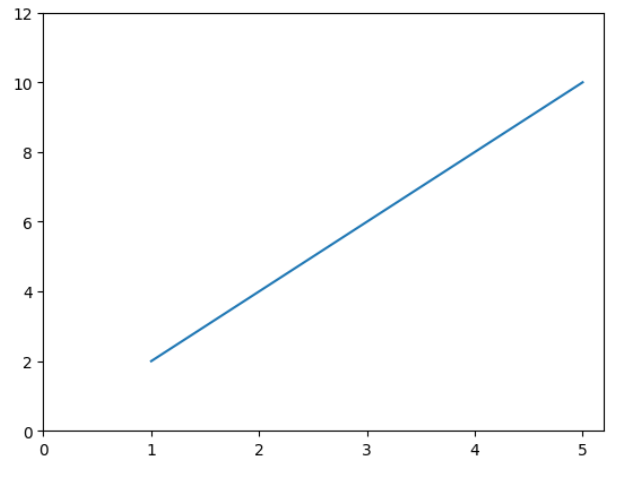
Example4: Limiting Only One Axis Range
import matplotlib.pyplot as plt

x = [1, 2, 3, 4, 5]
y = [2, 4, 6, 8, 10]

plt.plot(x, y)
plt.xlim(0, None)
plt.ylim(0, 12)

plt.show()
Output:
Example 5: Set Axis Range Based on Data Range
import matplotlib.pyplot as plt

x = [1, 2, 3, 4, 5]
y = [2, 4, 6, 8, 10]

plt.plot(x, y)
data_min = min(min(x), min(y))
data_max = max(max(x), max(y))
plt.xlim(data_min, data_max)
plt.ylim(data_min, data_max)

plt.show()
Output:
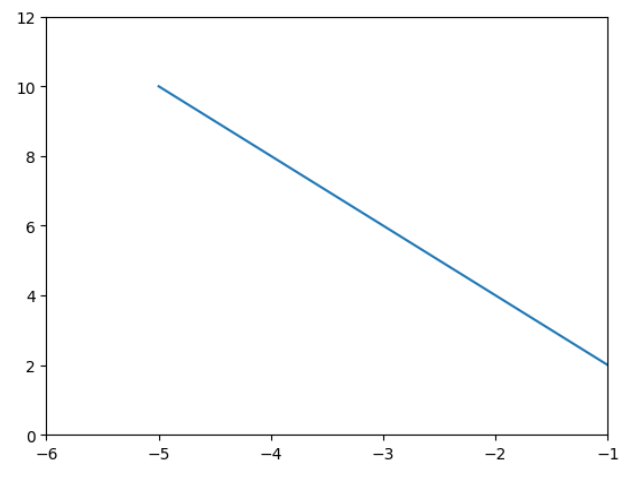
Example 6: Set Axis Range with Negative Values
import matplotlib.pyplot as plt

x = [-5, -4, -3, -2, -1]
y = [10, 8, 6, 4, 2]

plt.plot(x, y)
plt.xlim(-6, -1)
plt.ylim(0, 12)

plt.show()
Output:
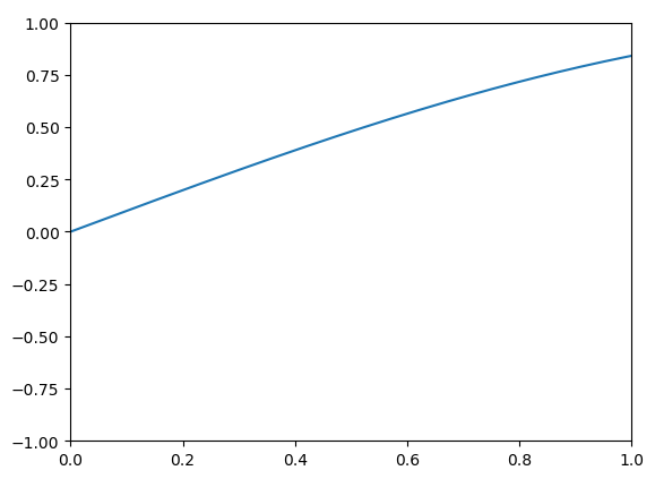
Example 7: Zooming In with Narrow Axis Range
import matplotlib.pyplot as plt
import numpy as np

x = np.linspace(0, 10, 1000)
y = np.sin(x)

plt.plot(x, y)
plt.xlim(0, 1)
plt.ylim(-1, 1)

plt.show()
Output:
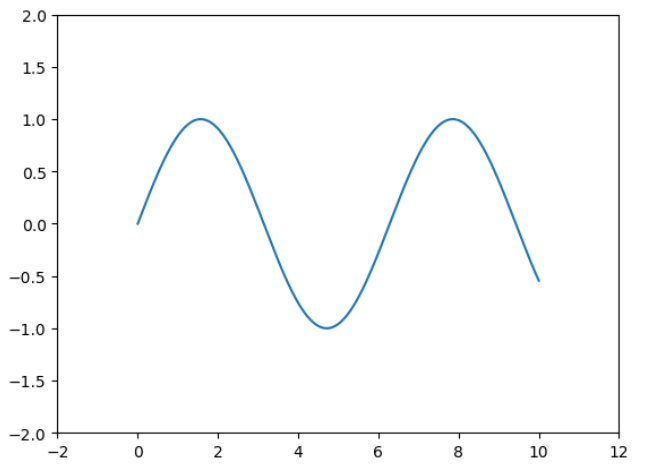
Example 8: Zooming Out with Broad Axis Range
import matplotlib.pyplot as plt
import numpy as np

x = np.linspace(0, 10, 1000)
y = np.sin(x)

plt.plot(x, y)
plt.xlim(-2, 12)
plt.ylim(-2, 2)

plt.show()
Output:
Matplotlib Axis Range Conclusion
In this article, we explored how to set the range of axes in Matplotlib. We learned about various methods such as set_xlim(), set_ylim(), set_xbound(), set_ybound(), and axis(). Through ten code examples, we saw how to apply these methods to control the range of both x-axis and y-axis.