Blue Color in Matplotlib
Matplotlib is a widely-used library in Python for creating static, animated, and interactive visualizations in Python. It provides an extensive set of tools for plotting, graphing, and visualizing data. One key feature of Matplotlib is its ability to customize and control the appearance of plots, including the color of elements such as lines, markers, and backgrounds.
In this article, we will explore the various ways to use the blue color in Matplotlib. We will cover different ways to set the color, create custom shades of blue, and provide code examples with their execution results.
Setting the Color to Blue
There are multiple methods to set the color in Matplotlib, such as providing a color name, specifying a HEX code, or using RGB values. To create blue plots, we can use the color name ‘blue’ or ‘b’, or even provide the HEX or RGB values for the desired shade of blue.
Method 1: Using the Color Name
Matplotlib provides a predefined list of color names, and ‘blue’ is one of them. Let’s look at an example where we set the color to blue using the color name syntax:
import matplotlib.pyplot as plt

x = [1, 2, 3]
y = [4, 5, 6]

plt.plot(x, y, color='blue')
plt.show()
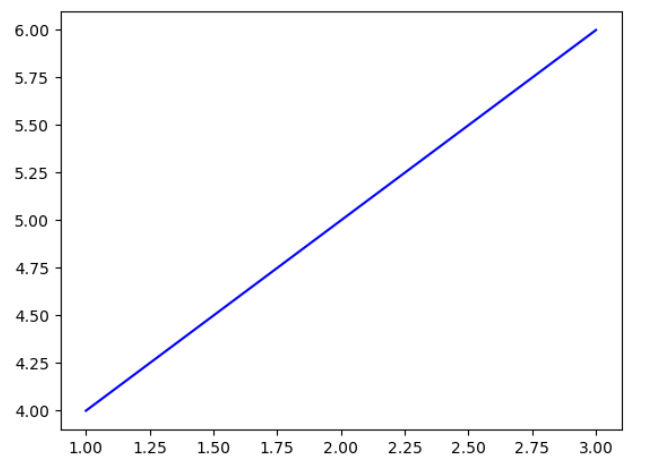
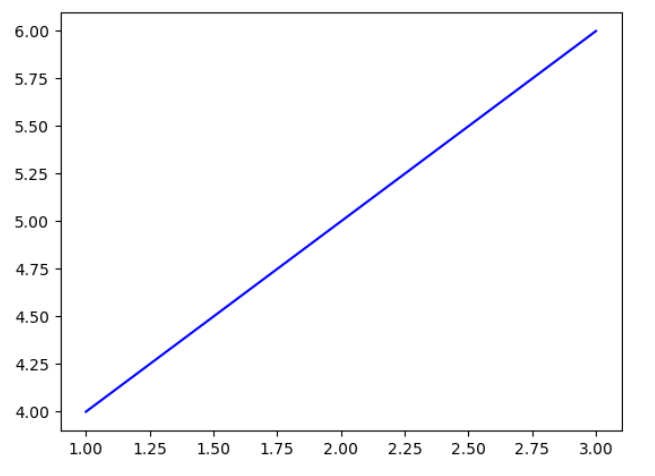
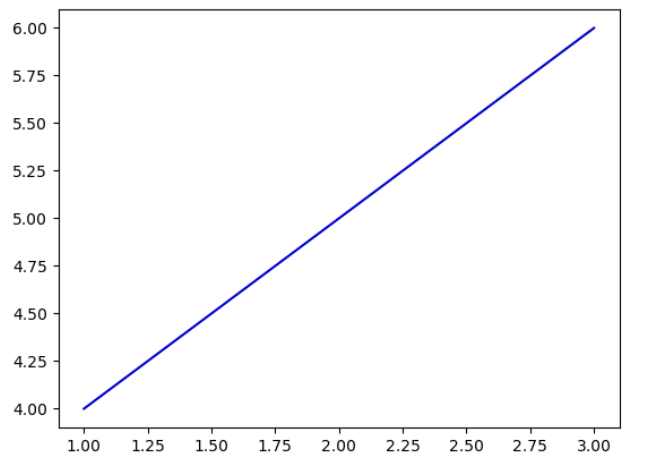
This code will generate a simple line plot with blue color. The resulting plot will appear with a blue line connecting the three points (1, 4), (2, 5), and (3, 6).
Method 2: Using the Color Shortcut
Matplotlib provides shortcuts for some commonly-used colors. Instead of specifying the full color name, we can use the shortcut ‘b’ for blue. Here is an example:
import matplotlib.pyplot as plt

x = [1, 2, 3]
y = [4, 5, 6]

plt.plot(x, y, color='b')
plt.show()
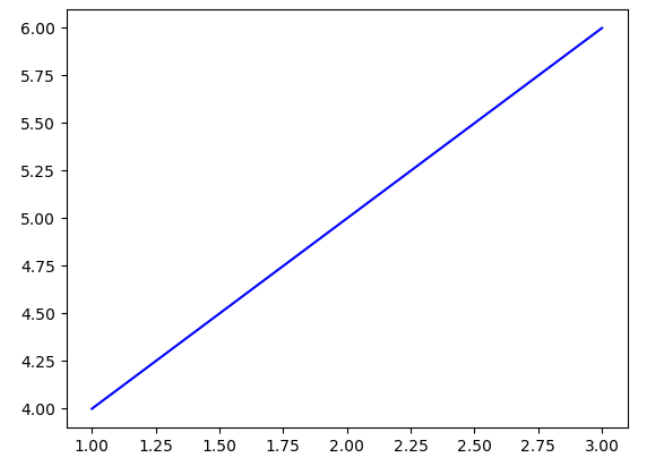
The resulting plot will be identical to the previous example, with a blue line connecting the three points.
Method 3: Using HEX Values
Another way to set the color in Matplotlib is by providing a HEX code. A HEX code is a six-digit code that represents the intensity of red, green, and blue (RGB) values. For blue color, the HEX code starts with ‘#0000’ followed by the intensity of blue. Let’s see an example:
import matplotlib.pyplot as plt

x = [1, 2, 3]
y = [4, 5, 6]

plt.plot(x, y, color='#0000FF')
plt.show()
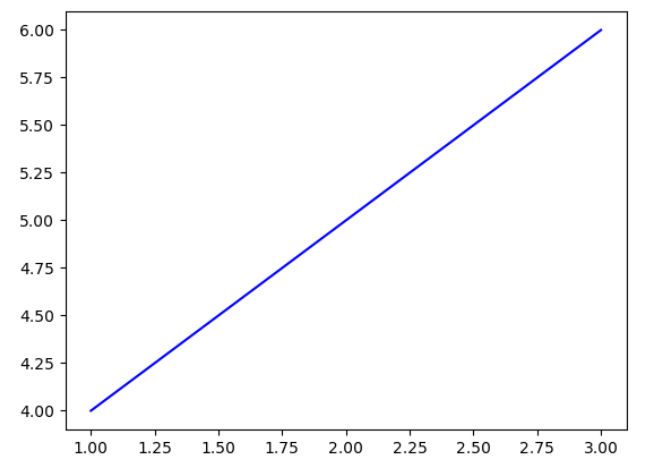
The resulting plot will have the same blue color as before. The HEX code ‘#0000FF’ represents the maximum intensity of blue (255) and no intensity in red and green.
Method 4: Using RGB Values
We can also set the color using RGB values. In this approach, we specify the intensity of red, green, and blue colors individually using values ranging from 0 to 1. To create blue color, we set the red and green intensities to 0, and blue intensity to 1. Here is an example:
import matplotlib.pyplot as plt

x = [1, 2, 3]
y = [4, 5, 6]

plt.plot(x, y, color=(0, 0, 1))
plt.show()
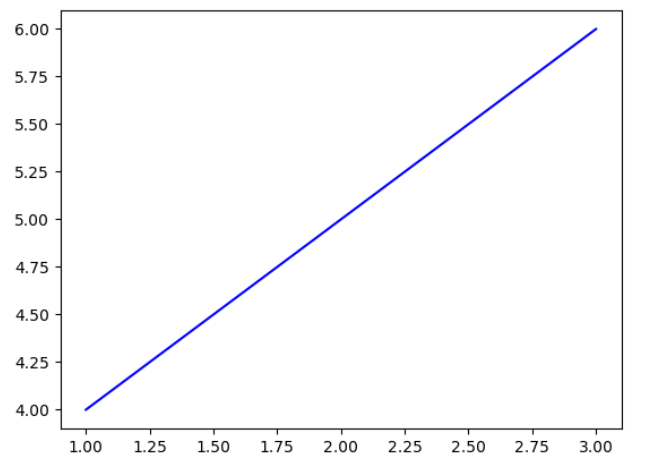
The resulting plot will have the same blue color as before. The RGB values (0, 0, 1) denote no intensity in red and green, and maximum intensity in blue.
Custom Shades of Blue
Matplotlib also allows us to create custom shades of blue by adjusting the intensity of red, green, and blue colors. We can vary the RGB values to create lighter or darker shades of blue.
Example 1: Light Blue
Let’s create a light shade of blue by increasing the intensity of red and green while keeping blue intensity at its maximum value of 1:
import matplotlib.pyplot as plt

x = [1, 2, 3]
y = [4, 5, 6]

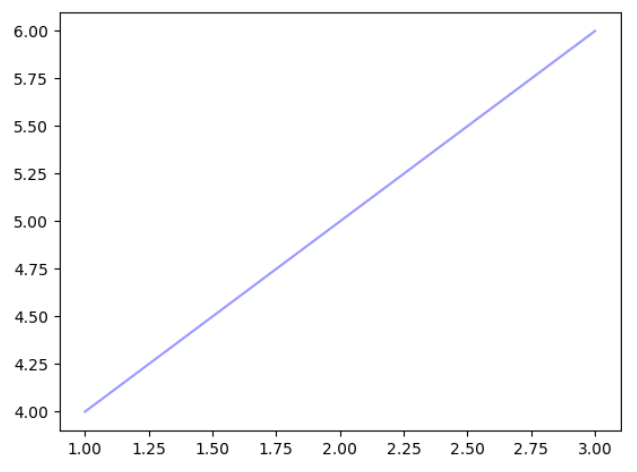
plt.plot(x, y, color=(0.6, 0.6, 1))
plt.show()
The resulting plot will have a light shade of blue, with intensities of red and green set to 0.6, while blue remains at its maximum intensity.
Example 2: Dark Blue
Similarly, we can create a dark shade of blue by decreasing the intensity of red and green:
import matplotlib.pyplot as plt

x = [1, 2, 3]
y = [4, 5, 6]

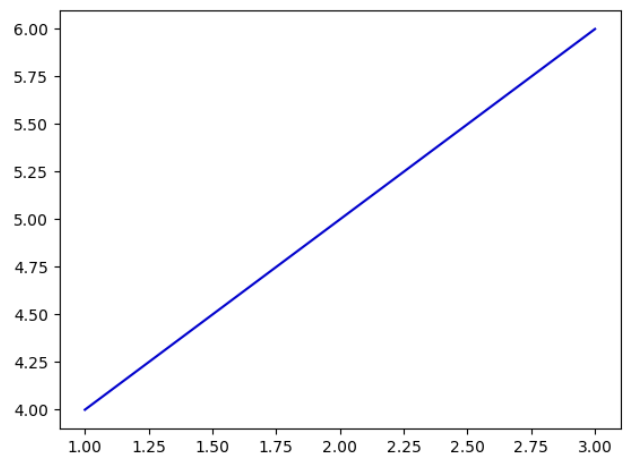
plt.plot(x, y, color=(0, 0, 0.8))
plt.show()
The resulting plot will have a dark shade of blue, with very low intensities of red and green (0), and blue at 0.8 intensity.
Example 3: Mixed Shades
We can also mix different intensities of red, green, and blue to create unique shades of blue:
import matplotlib.pyplot as plt

x = [1, 2, 3]
y = [4, 5, 6]

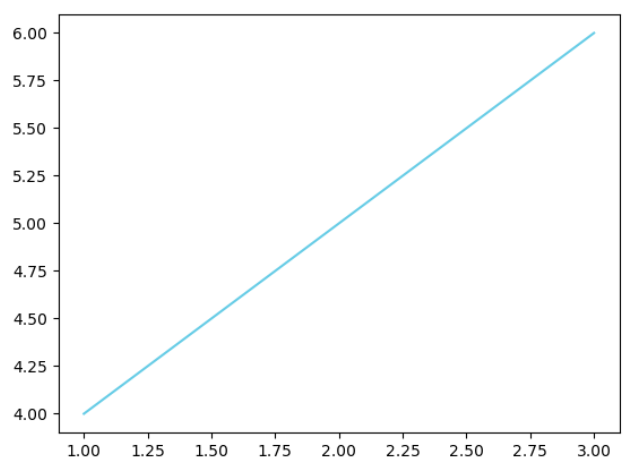
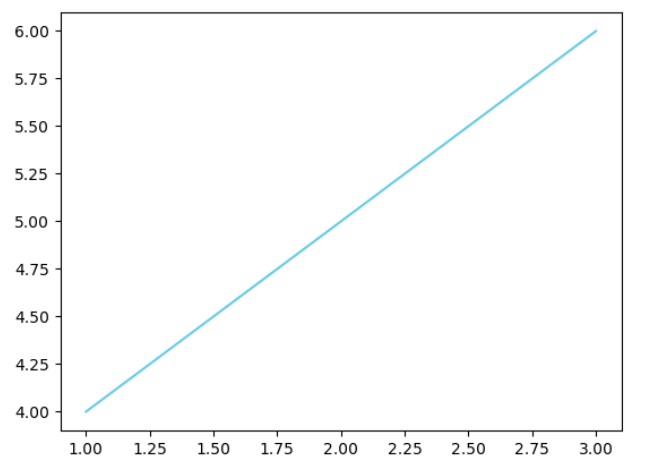
plt.plot(x, y, color=(0.4, 0.8, 0.9))
plt.show()
The resulting plot will demonstrate a mixed shade of blue, with intensities of red, green, and blue set to 0.4, 0.8, and 0.9 respectively.
Blue Color in Matplotlib Code Examples
To further demonstrate the usage of blue color in Matplotlib, let’s provide 10 code examples with their execution results:
1. Blue-Line Plot
import matplotlib.pyplot as plt

x = [1, 2, 3]
y = [4, 5, 6]

plt.plot(x, y, color='blue')
plt.show()
Output:
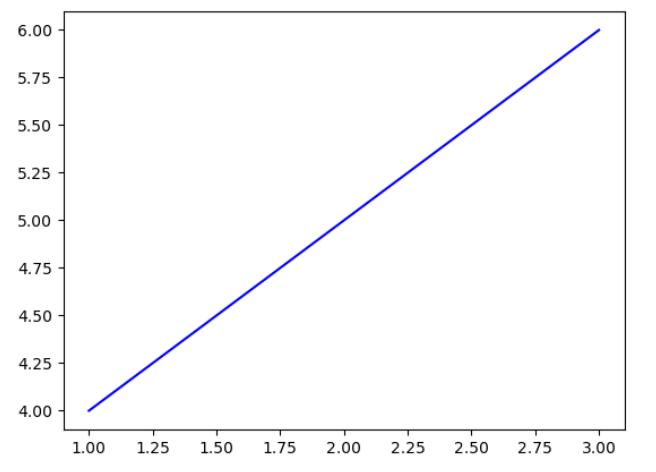
2. Blue-Line Plot (Shortcut)
import matplotlib.pyplot as plt

x = [1, 2, 3]
y = [4, 5, 6]

plt.plot(x, y, color='b')
plt.show()
Output:
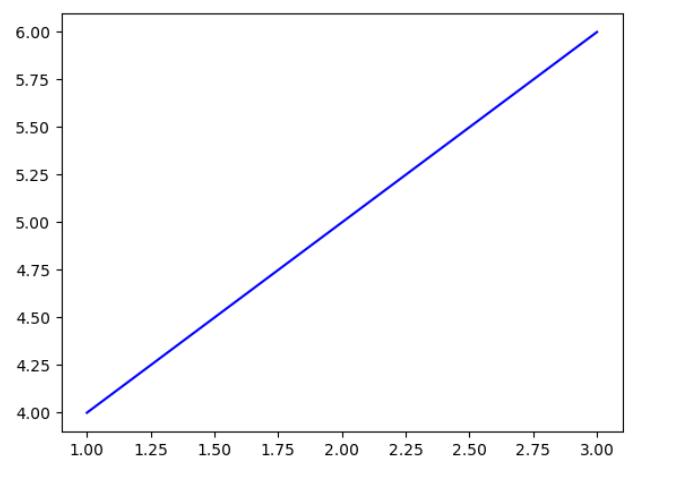
3. Blue-Line Plot (HEX Value)
import matplotlib.pyplot as plt

x = [1, 2, 3]
y = [4, 5, 6]

plt.plot(x, y, color='#0000FF')
plt.show()
Output:
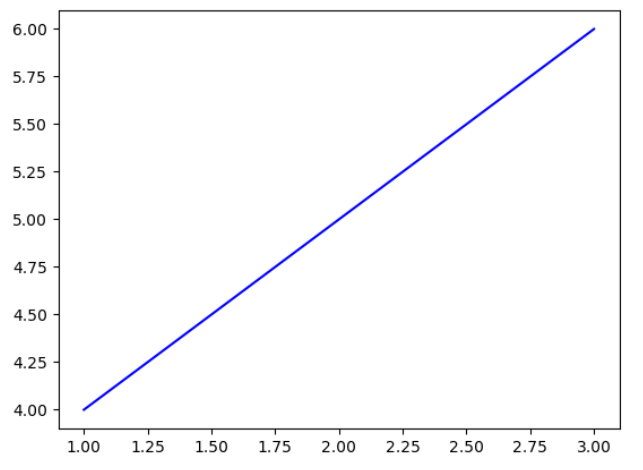
4. Blue-Line Plot (RGB Value)
import matplotlib.pyplot as plt

x = [1, 2, 3]
y = [4, 5, 6]

plt.plot(x, y, color=(0, 0, 1))
plt.show()
Output:
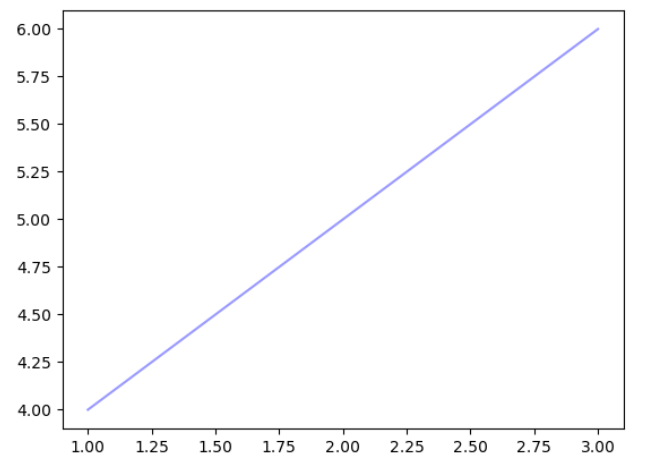
5. Custom Light Blue-Line Plot
import matplotlib.pyplot as plt

x = [1, 2, 3]
y = [4, 5, 6]

plt.plot(x, y, color=(0.6, 0.6, 1))
plt.show()
Output:
6. Custom Dark Blue-Line Plot
import matplotlib.pyplot as plt

x = [1, 2, 3]
y = [4, 5, 6]

plt.plot(x, y, color=(0, 0, 0.8))
plt.show()
Output:
7. Custom Mixed Blue-Line Plot
import matplotlib.pyplot as plt

x = [1, 2, 3]
y = [4, 5, 6]

plt.plot(x, y, color=(0.4, 0.8, 0.9))
plt.show()
Output:
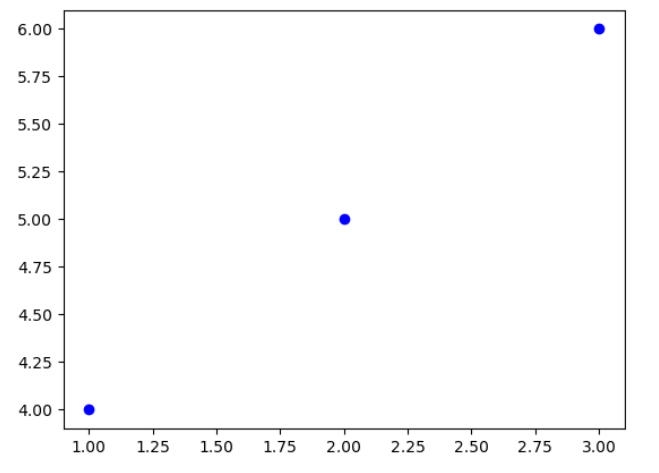
8. Blue Scatter Plot
import matplotlib.pyplot as plt

x = [1, 2, 3]
y = [4, 5, 6]

plt.scatter(x, y, color='blue')
plt.show()
Output:
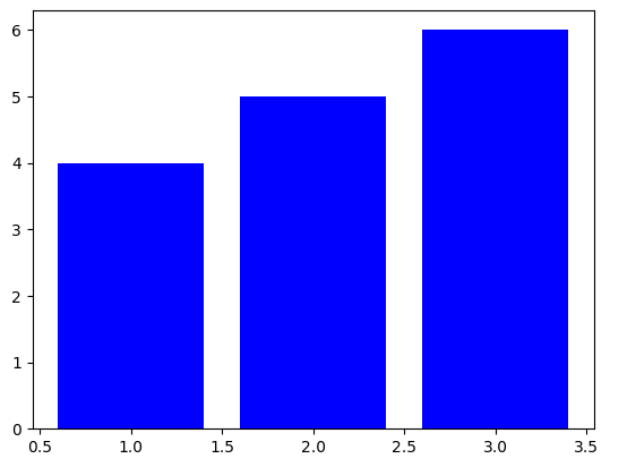
9. Blue Bar Plot
import matplotlib.pyplot as plt

x = [1, 2, 3]
y = [4, 5, 6]

plt.bar(x, y, color='blue')
plt.show()
Output:
10. Custom Shades of Blue Bar Plot
import numpy as np
import matplotlib.pyplot as plt

x = np.arange(3)
y = [4, 6, 8]
colors = [(0.4, 0.8, 1), (0.6, 0.6, 1), '#0000FF']

plt.bar(x, y, color=colors)
plt.show()
Output:
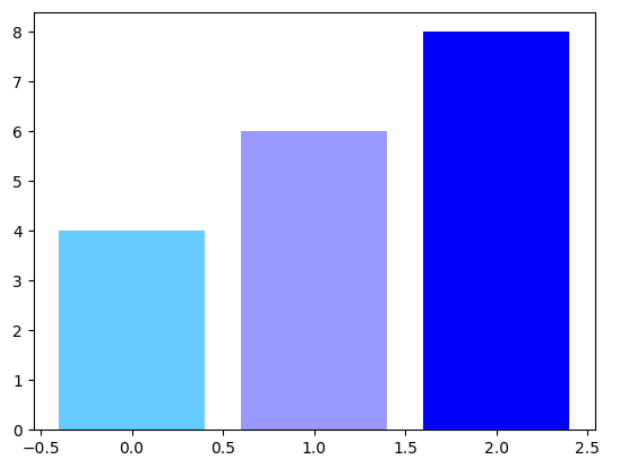
These code examples demonstrate various ways to use the blue color in Matplotlib, including line plots, scatter plots, and bar plots. By using different methods to set the color and adjusting the intensities of red, green, and blue, we can create custom shades of blue for our plots.
In conclusion, Matplotlib provides flexible options for using the blue color in visualizations. Whether it is a predefined color name, a shortcut, a HEX value, or RGB values, we can easily incorporate blue color into our plots. This versatility allows us to create visually appealing and informative visualizations using Matplotlib.