ax.figure.savefig in matplotlib
Matplotlib is a popular Python library used for creating visualizations and plots. It offers a wide range of functionalities to customize and enhance our plots. One important aspect of creating visualizations is the ability to save them in various formats for further use or sharing. This is where the ax.figure.savefig function comes into play.
What is ax.figure.savefig in Matplotlib?
ax.figure.savefig is a method in the Matplotlib library that allows us to save a figure generated by Matplotlib to a file in different formats such as PNG, JPG, SVG, PDF, and more. It provides a convenient way to export our visualizations without the need for external tools or software.
In order to use ax.figure.savefig, we first need to create a figure using matplotlib.pyplot.figure(). This figure acts as a container for our plot and can be customized in various ways. Then, we can create one or more axes within the figure using matplotlib.pyplot.subplots(). An ax object is returned, which can be used to apply further plot customization and finally save the figure using ax.figure.savefig.
Basic Syntax of ax.figure.savefig in Matplotlib
The basic syntax of ax.figure.savefig is as follows:
ax.savefig(filename, format='png', dpi=300, ..., **kwargs)
filename: The name of the file to save the figure. It can include the file extension based on the desired format.format(optional): The format in which the figure needs to be saved. It can be any supported format such as ‘png’, ‘jpg’, ‘svg’, ‘pdf’, etc. The default value is ‘png’.dpi(optional): The resolution (dots per inch) of the saved image. A higher dpi value results in a higher quality image. The default value is 300.**kwargs(optional): Additional keyword arguments that can be used to customize the saved figure.
Now, let’s explore some code examples to understand the usage and capabilities of ax.figure.savefig.
Matplotlib ax.figure.savefig Code Examples
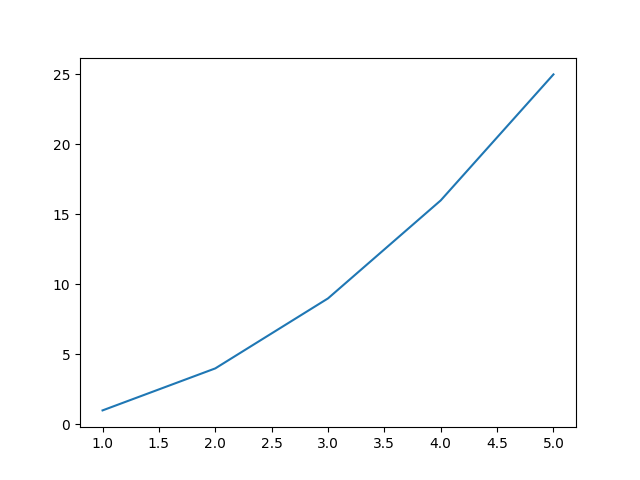
Example 1: Saving a Basic Line Plot as PNG
In this example, we will create a simple line plot using Matplotlib and save it as a PNG image. The saved figure will have a resolution of 300 dpi.
import matplotlib.pyplot as plt

# Create a basic line plot
x = [1, 2, 3, 4, 5]
y = [1, 4, 9, 16, 25]
fig, ax = plt.subplots()
ax.plot(x, y)

# Save the figure as a PNG
ax.figure.savefig('line_plot.png')
The output of this code will be the saved file “line_plot.png” in the current working directory.
Example 2: Saving Multiple Figures in Different Formats
In this example, we will create two figures with different plots and save each of them in multiple formats such as PNG, JPG, and SVG.
import matplotlib.pyplot as plt

# Create the first figure and plot
fig1, ax1 = plt.subplots()
ax1.plot([1, 2, 3, 4, 5], [1, 4, 9, 16, 25])

# Create the second figure and plot
fig2, ax2 = plt.subplots()
ax2.bar(['A', 'B', 'C'], [10, 20, 30])

# Save both figures in different formats
ax1.figure.savefig('figure1.png')
ax2.figure.savefig('figure2.jpg', format='jpg')
ax1.figure.savefig('figure1.svg', format='svg')
This code will generate three output files: “figure1.png”, “figure2.jpg”, and “figure1.svg”.

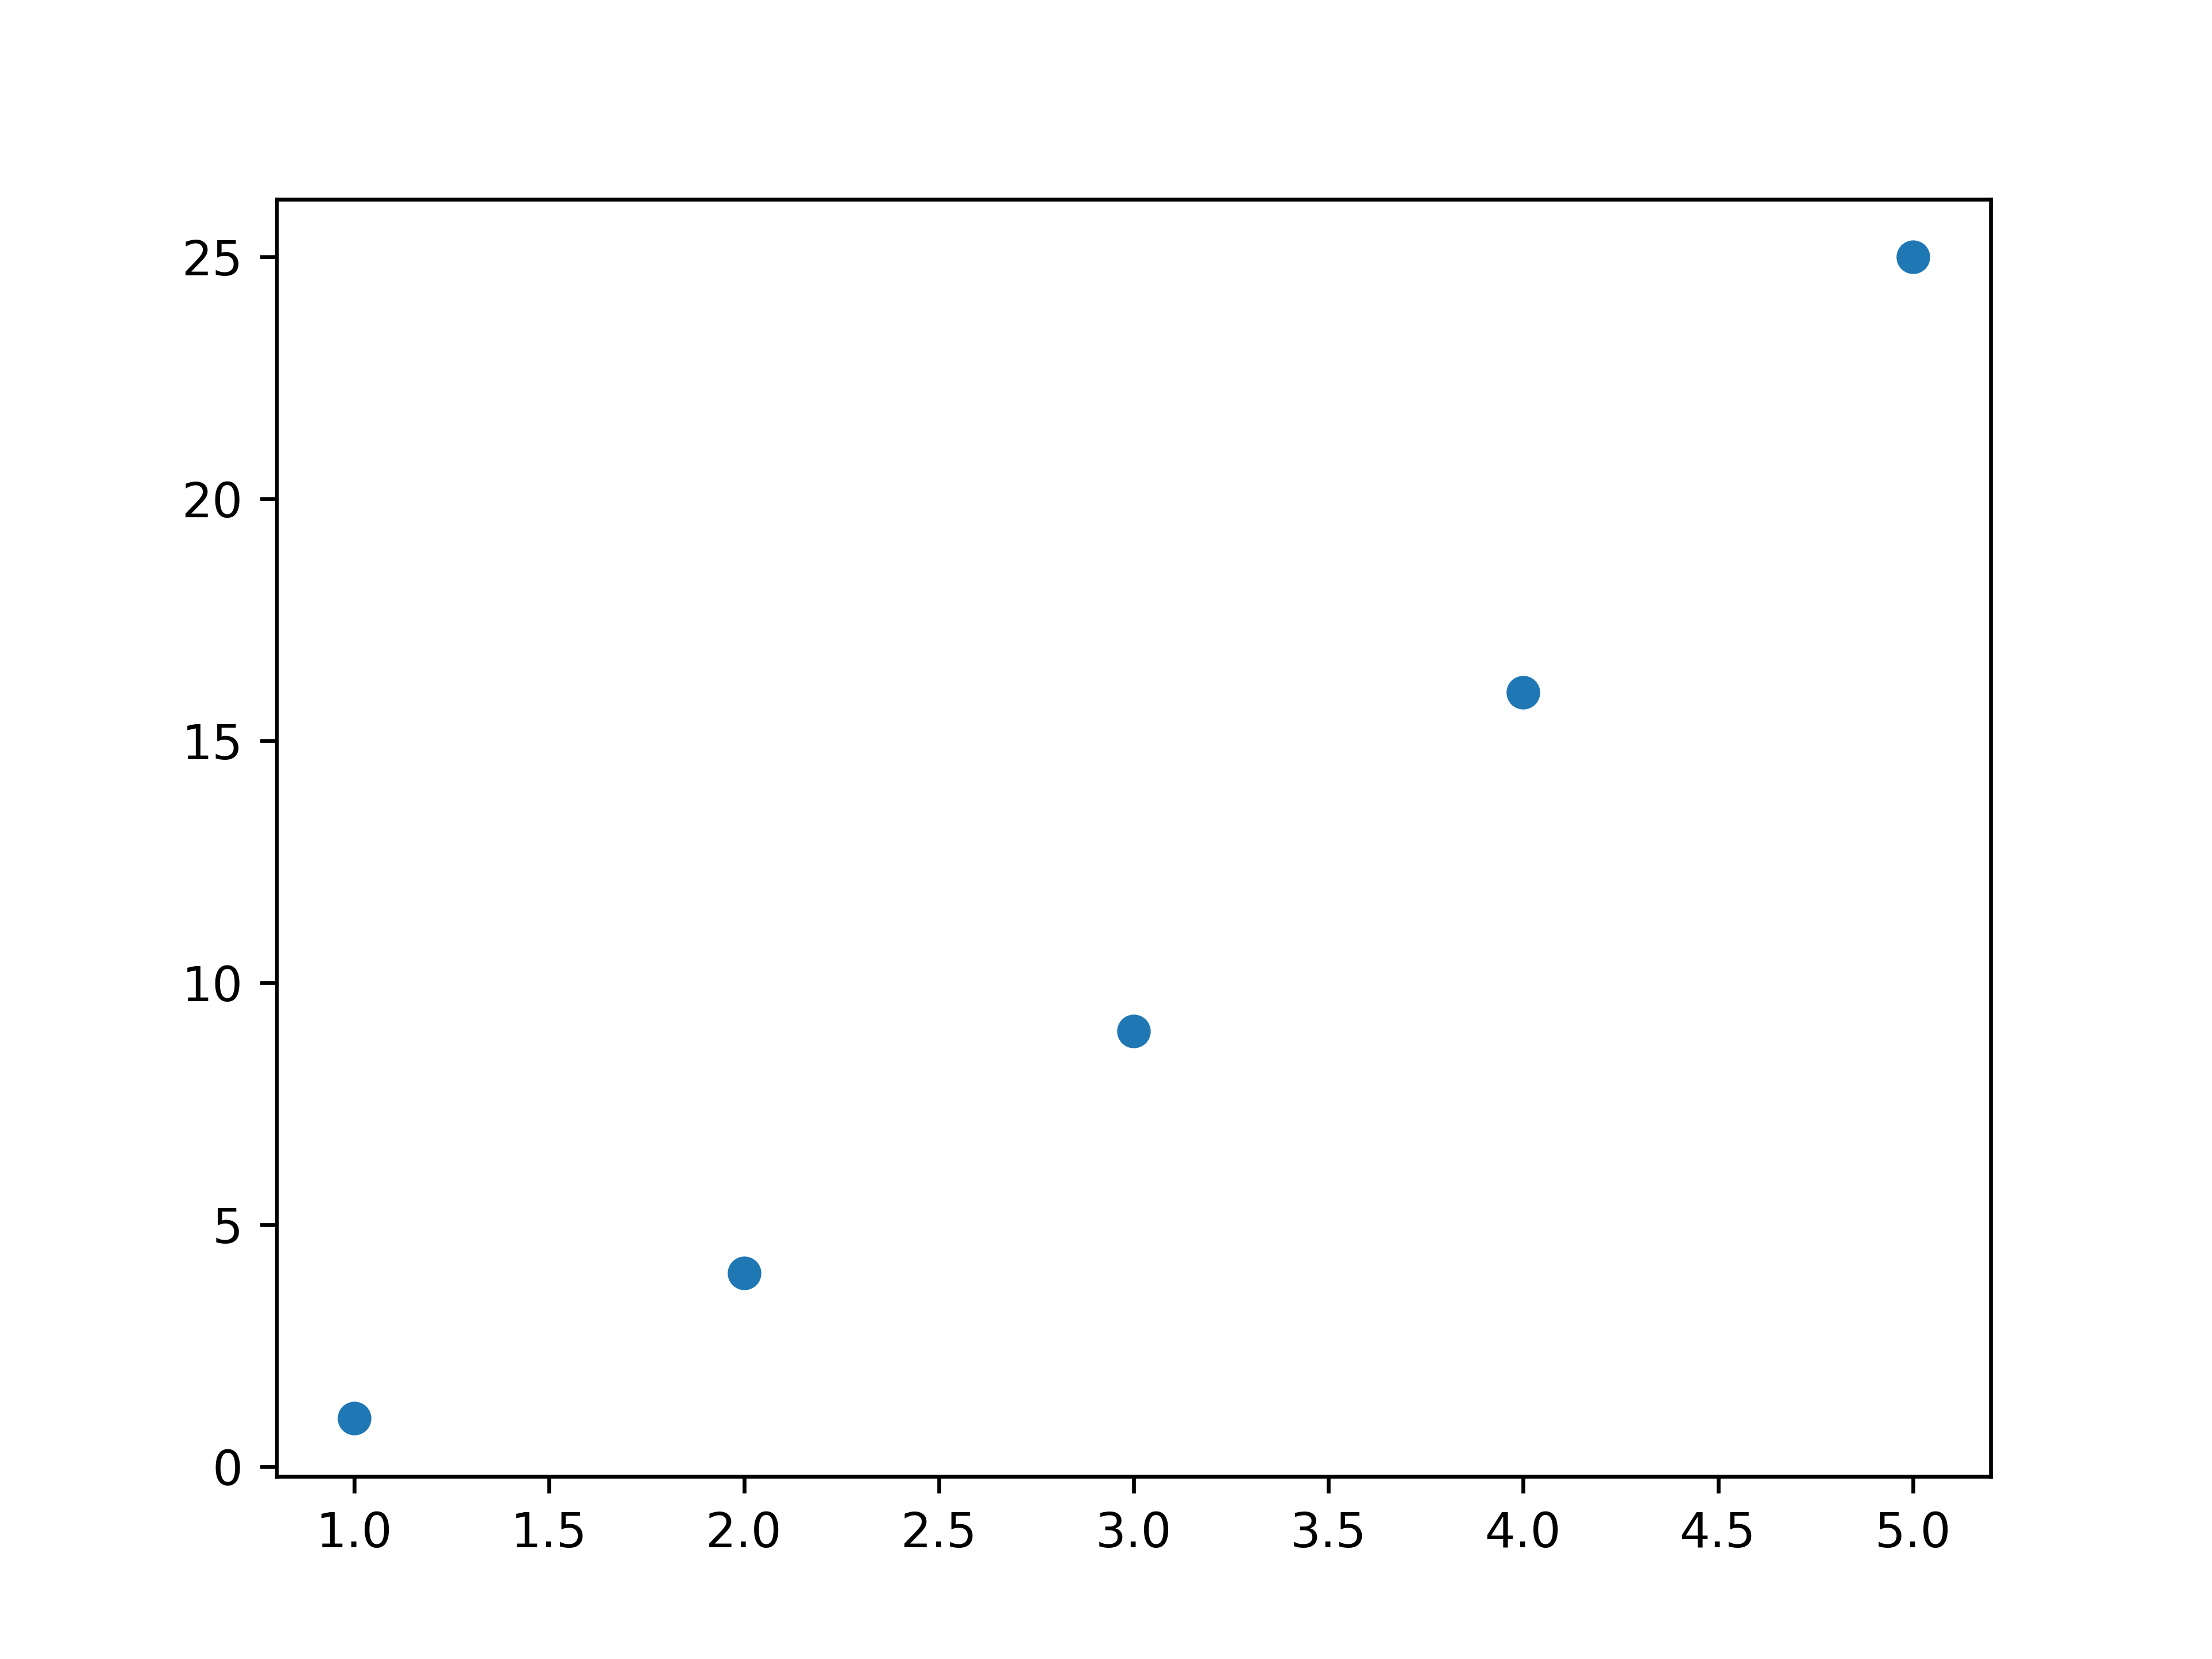
Example 3: Saving with Customized Resolution
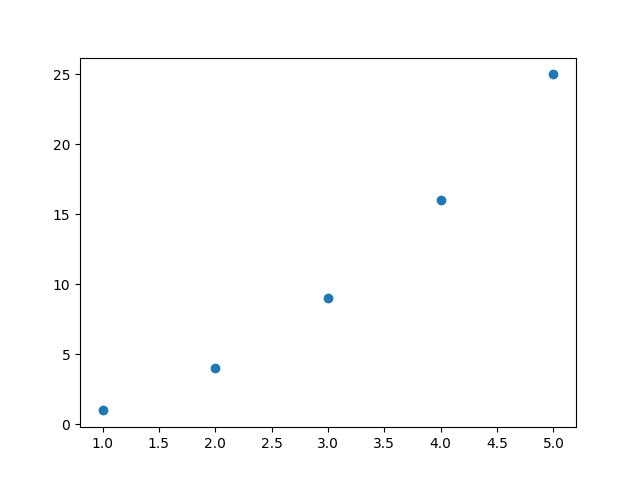
In this example, we will create a scatter plot and save it with a customized resolution of 600 dpi.
import matplotlib.pyplot as plt

# Create a scatter plot
x = [1, 2, 3, 4, 5]
y = [1, 4, 9, 16, 25]
fig, ax = plt.subplots()
ax.scatter(x, y)

# Save the figure with a higher resolution
ax.figure.savefig('scatter_plot_high_resolution.png', dpi=600)
The saved figure “scatter_plot_high_resolution.png” will have a resolution of 600 dpi.
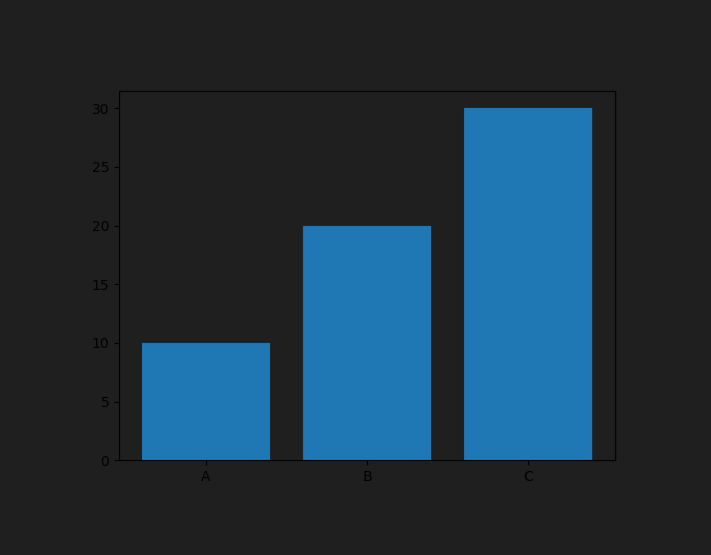
Example 4: Saving with Transparent Background
In this example, we will create a bar plot and save it with a transparent background. This can be useful when we want to overlay the plot on top of other images or backgrounds.
import matplotlib.pyplot as plt

# Create a bar plot
x = ['A', 'B', 'C']
y = [10, 20, 30]
fig, ax = plt.subplots()
ax.bar(x, y)

# Save the figure with a transparent background
ax.figure.savefig('bar_plot_transparent.png', transparent=True)
The saved figure “bar_plot_transparent.png” will have a transparent background.
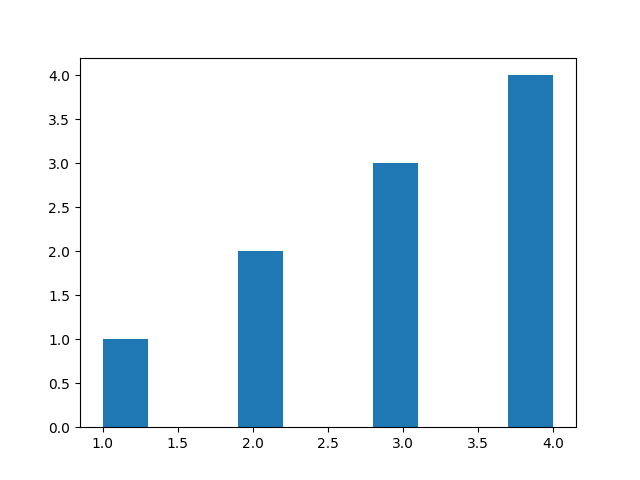
Example 5: Saving with Custom Aspect Ratio
In this example, we will create a histogram and save it with a custom aspect ratio of 16:9. This can be useful when we want to adjust the width and height of the saved image.
import matplotlib.pyplot as plt

# Create a histogram
data = [1, 2, 2, 3, 3, 3, 4, 4, 4, 4]
fig, ax = plt.subplots()
ax.hist(data)

# Save the figure with a custom aspect ratio
ax.figure.savefig('histogram_custom_aspect_ratio.png', aspect=(16, 9))
The saved figure “histogram_custom_aspect_ratio.png” will have a width-to-height ratio of 16:9.
Example 6: Saving with Tight Layout
In this example, we will create a scatter plot and save it with tight layout enabled. This ensures that all plot elements are properly arranged and no subplots overlap.
import matplotlib.pyplot as plt

# Create a scatter plot
x = [1, 2, 3, 4, 5]
y = [1, 4, 9, 16, 25]
fig, ax = plt.subplots()
ax.scatter(x, y)

# Save the figure with tight layout
ax.figure.savefig('scatter_plot_tight_layout.png', tight_layout=True)
The saved figure “scatter_plot_tight_layout.png” will have a tight layout applied.
Example 7: Saving with Preserve Meta-information
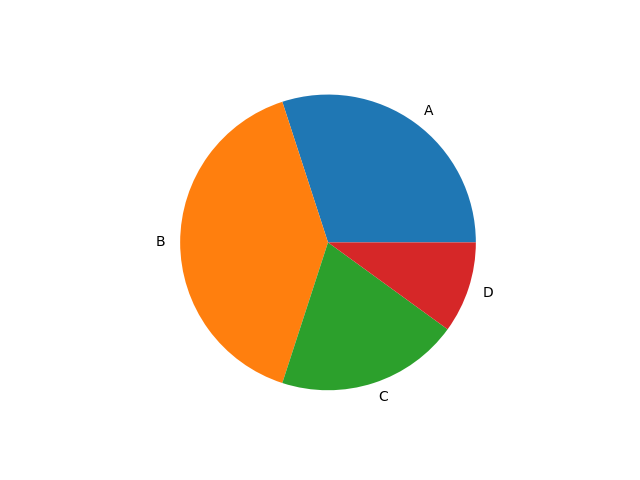
In this example, we will create a pie chart and save it while preserving the meta-information such as author, title, and date.
import matplotlib.pyplot as plt

# Create a pie chart
sizes = [30, 40, 20, 10]
labels = ['A', 'B', 'C', 'D']
fig, ax = plt.subplots()
ax.pie(sizes, labels=labels)

# Save the figure with preserved meta-information
ax.figure.savefig('pie_chart_with_meta.png', metadata={'author': 'John', 'title': 'My Pie Chart', 'date': '2024-01-25'})
The saved figure “pie_chart_with_meta.png” will have the provided meta-information embedded in it.
Example 8: Saving with Additional Figure Metadata
In this example, we will create a line plot and save it with additional metadata such as a description and keywords.
import matplotlib.pyplot as plt

# Create a line plot
x = [1, 2, 3, 4, 5]
y = [1, 4, 9, 16, 25]
fig, ax = plt.subplots()
ax.plot(x, y)

# Save the figure with additional metadata
metadata = {'description': 'My Line Plot', 'keywords': ['line plot', 'matplotlib']}
ax.figure.savefig('line_plot_with_meta.png', metadata=metadata)
The saved figure “line_plot_with_meta.png” will have the additional metadata embedded in it.
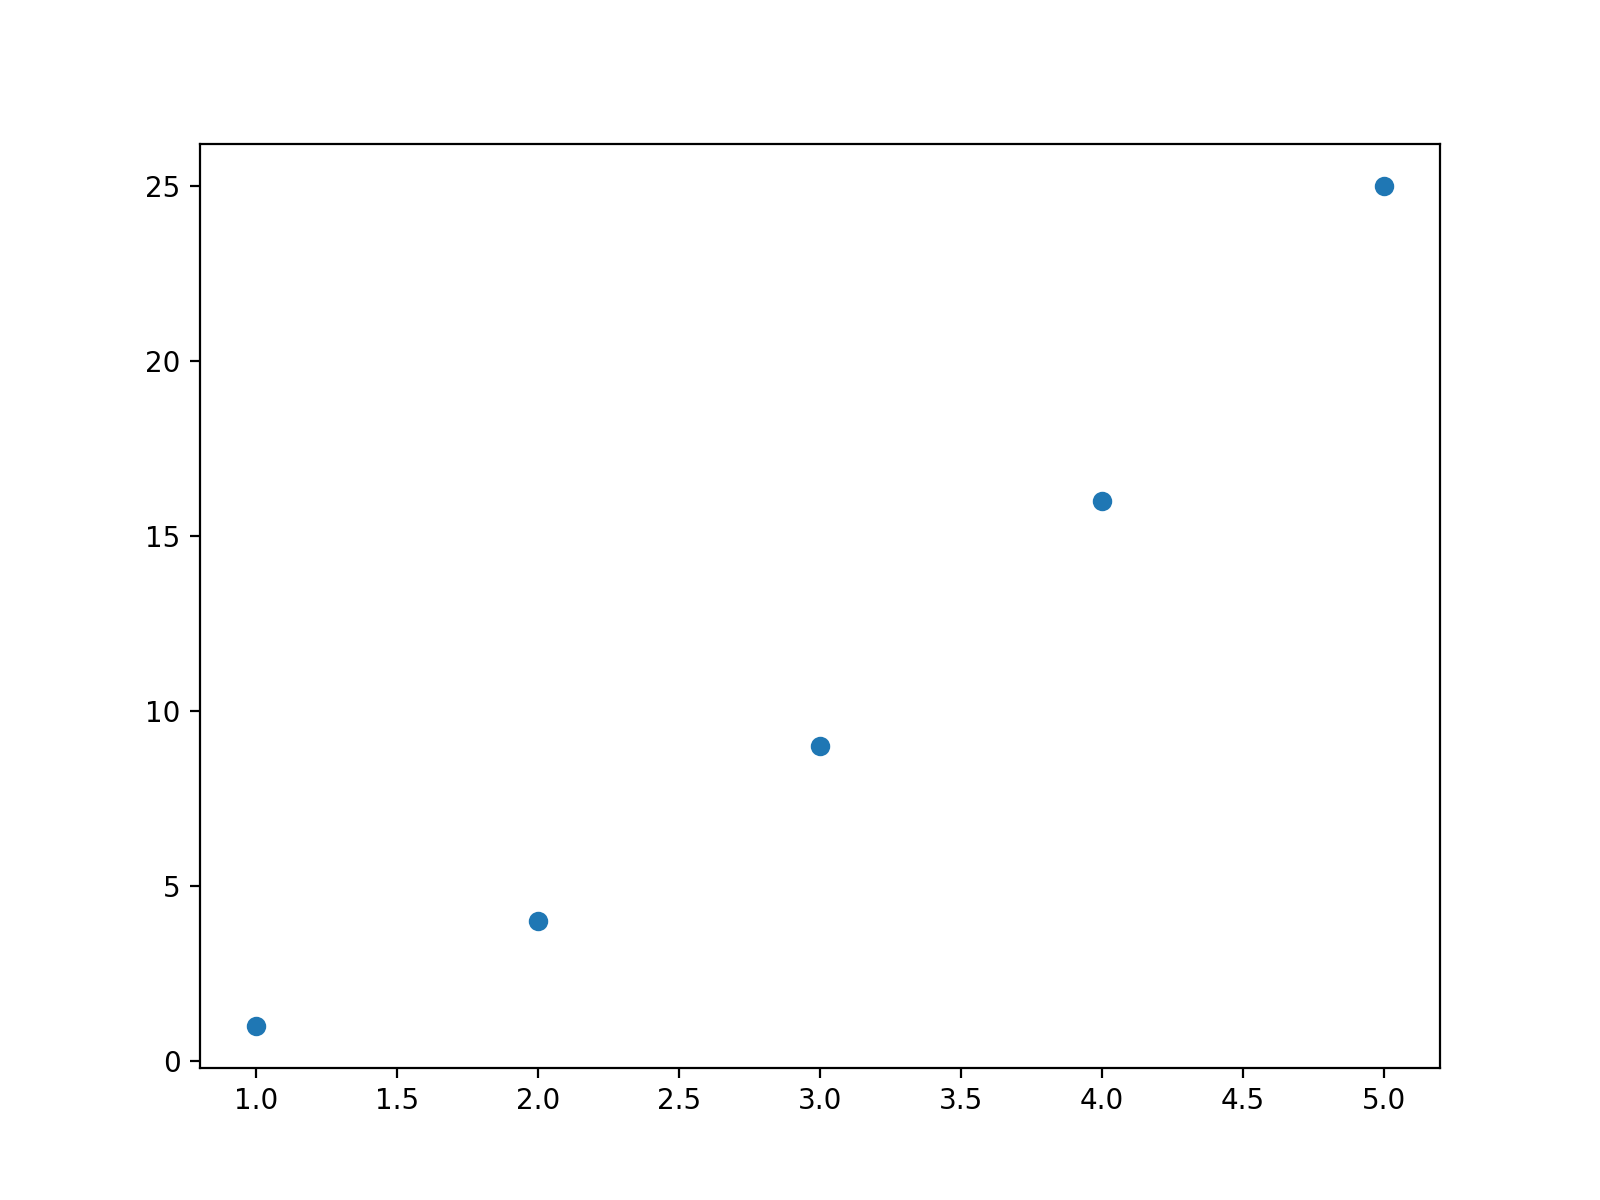
Example 9: Saving with Custom Resolution and Figure Size
In this example, we will create a scatter plot and save it with a custom resolution and figure size.
import matplotlib.pyplot as plt

# Create a scatter plot
x = [1, 2, 3, 4, 5]
y = [1, 4, 9, 16, 25]
fig, ax = plt.subplots(figsize=(8, 6))  # Set the figure size to 8 inches by 6 inches
ax.scatter(x, y)

# Save the figure with a custom resolution and figure size
ax.figure.savefig('scatter_plot_custom_resolution_size.png', dpi=200, figsize=(10, 8))
The saved figure “scatter_plot_custom_resolution_size.png” will have a resolution of 200 dpi and a figure size of 10 inches by 8 inches.
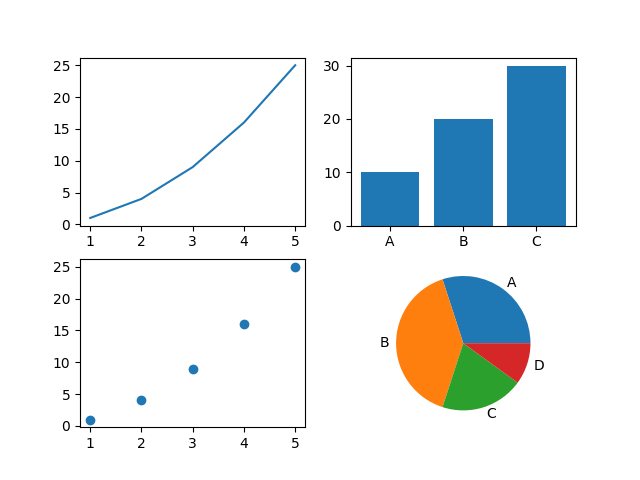
Example 10: Saving Multiple Subplots
In this example, we will create a figure with multiple subplots and save the entire figure as a single image.
import matplotlib.pyplot as plt

# Create the figure with multiple subplots
fig, axes = plt.subplots(2, 2)

# Plot on the first subplot
axes[0, 0].plot([1, 2, 3, 4, 5], [1, 4, 9, 16, 25])

# Plot on the second subplot
axes[0, 1].bar(['A', 'B', 'C'], [10, 20, 30])

# Plot on the third subplot
axes[1, 0].scatter([1, 2, 3, 4, 5], [1, 4, 9, 16, 25])

# Plot on the fourth subplot
axes[1, 1].pie([30, 40, 20, 10], labels=['A', 'B', 'C', 'D'])

# Save the entire figure as a single image
fig.figure.savefig('subplots.png')
The output file “subplots.png” will contain all the subplots arranged in a grid format.
These code examples demonstrate the flexibility and versatility of the ax.figure.savefig method in Matplotlib. It allows us to save our visualizations in different formats, customize the resolution, aspect ratio, figure size, and preserve metadata. With these capabilities, we can easily create high-quality plots and save them for further analysis or sharing with others.
In conclusion, the ax.figure.savefig function in Matplotlib is a valuable tool for saving our plots in various formats, providing great flexibility and customization options. By utilizing this function effectively, we can enhance our data visualizations and make them easily accessible for future use.