Mastering Matplotlib.figure.Figure.set_constrained_layout() in Python
Matplotlib.figure.Figure.set_constrained_layout() in Python is a powerful method that allows you to automatically adjust the layout of your plots to avoid overlapping elements and ensure optimal use of space. This function is part of Matplotlib’s constrained layout feature, which aims to address common issues in plot layout and positioning. In this comprehensive guide, we’ll explore the ins and outs of set_constrained_layout(), providing detailed explanations and practical examples to help you master this essential Matplotlib tool.
Understanding Matplotlib.figure.Figure.set_constrained_layout()
Matplotlib.figure.Figure.set_constrained_layout() is a method that enables or disables the constrained layout manager for a specific figure. When enabled, it automatically adjusts the positions of plot elements to avoid overlapping and optimize the use of available space. This is particularly useful when dealing with complex plots or subplots that may have varying sizes or aspect ratios.
The basic syntax for using set_constrained_layout() is as follows:
import matplotlib.pyplot as plt

fig = plt.figure()
fig.set_constrained_layout(True)

# Your plotting code here

plt.show()
In this example, we create a new figure and enable constrained layout by calling set_constrained_layout(True). This ensures that all subsequent plots added to this figure will benefit from the automatic layout adjustments.
Benefits of Using Matplotlib.figure.Figure.set_constrained_layout()
There are several advantages to using Matplotlib.figure.Figure.set_constrained_layout() in your plotting workflow:
- Automatic spacing: It automatically adjusts the spacing between subplots and other elements to avoid overlapping.
- Improved readability: By optimizing the layout, it enhances the overall readability of your plots.
- Time-saving: It reduces the need for manual adjustments to achieve a clean, professional-looking layout.
- Consistency: It helps maintain a consistent look across different plots and figures in your project.
Let’s explore these benefits with a practical example:
import matplotlib.pyplot as plt
import numpy as np

# Create a figure with constrained layout
fig = plt.figure(figsize=(10, 8))
fig.set_constrained_layout(True)

# Create subplots
ax1 = fig.add_subplot(221)
ax2 = fig.add_subplot(222)
ax3 = fig.add_subplot(223)
ax4 = fig.add_subplot(224)

# Generate sample data
x = np.linspace(0, 10, 100)
y1 = np.sin(x)
y2 = np.cos(x)
y3 = np.exp(-x/10)
y4 = x**2

# Plot data
ax1.plot(x, y1, label='Sin(x)')
ax2.plot(x, y2, label='Cos(x)')
ax3.plot(x, y3, label='Exp(-x/10)')
ax4.plot(x, y4, label='x^2')

# Add labels and titles
for ax in [ax1, ax2, ax3, ax4]:
    ax.set_xlabel('X-axis')
    ax.set_ylabel('Y-axis')
    ax.legend()
    ax.set_title(f'Plot from how2matplotlib.com')

plt.show()
Output:
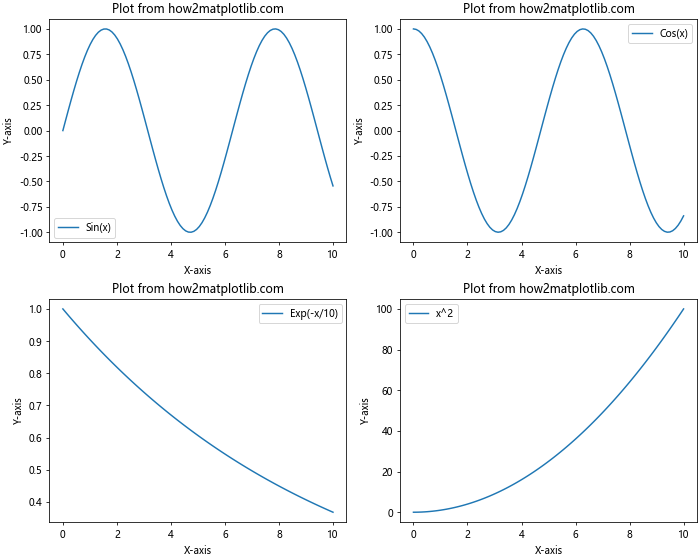
In this example, we create a figure with four subplots using constrained layout. The set_constrained_layout(True) call ensures that the subplots are automatically positioned and sized to make optimal use of the available space.
Customizing Matplotlib.figure.Figure.set_constrained_layout()
While the default behavior of set_constrained_layout() is often sufficient, Matplotlib provides options to fine-tune the layout. Let’s explore some of these customization options:
Setting Layout Parameters
For more fine-grained control, you can use the constrained_layout_pads parameter:
import matplotlib.pyplot as plt
import numpy as np

fig, axs = plt.subplots(2, 2, figsize=(10, 8))
fig.set_constrained_layout(True)
fig.set_constrained_layout_pads(w_pad=0.1, h_pad=0.1, hspace=0.1, wspace=0.1)

x = np.linspace(0, 10, 100)
for ax in axs.flat:
    ax.plot(x, np.random.rand(100), label='Random data from how2matplotlib.com')
    ax.set_title('Random Plot')
    ax.legend()

plt.show()
Output:
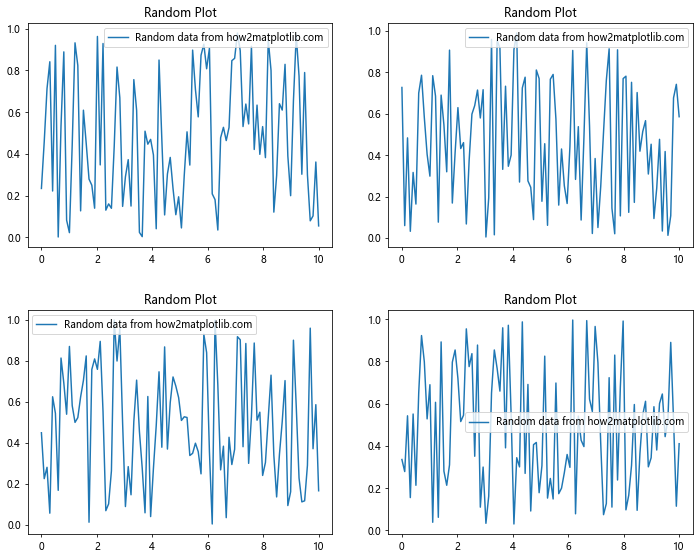
This example demonstrates how to set specific padding values for width, height, horizontal space, and vertical space between subplots.
Matplotlib.figure.Figure.set_constrained_layout() with Complex Layouts
Matplotlib.figure.Figure.set_constrained_layout() really shines when dealing with complex layouts. Let’s explore some scenarios where it proves particularly useful:
Mixing Different Plot Types
import matplotlib.pyplot as plt
import numpy as np

fig = plt.figure(figsize=(12, 8))
fig.set_constrained_layout(True)

# Create a 2x2 grid
gs = fig.add_gridspec(2, 2)

# Line plot
ax1 = fig.add_subplot(gs[0, 0])
x = np.linspace(0, 10, 100)
ax1.plot(x, np.sin(x), label='Sin(x) from how2matplotlib.com')
ax1.set_title('Line Plot')
ax1.legend()

# Scatter plot
ax2 = fig.add_subplot(gs[0, 1])
x = np.random.rand(50)
y = np.random.rand(50)
ax2.scatter(x, y, label='Random points from how2matplotlib.com')
ax2.set_title('Scatter Plot')
ax2.legend()

# Bar plot
ax3 = fig.add_subplot(gs[1, 0])
categories = ['A', 'B', 'C', 'D']
values = [3, 7, 2, 5]
ax3.bar(categories, values, label='Bar data from how2matplotlib.com')
ax3.set_title('Bar Plot')
ax3.legend()

# Histogram
ax4 = fig.add_subplot(gs[1, 1])
data = np.random.normal(0, 1, 1000)
ax4.hist(data, bins=30, label='Histogram data from how2matplotlib.com')
ax4.set_title('Histogram')
ax4.legend()

plt.show()
Output:
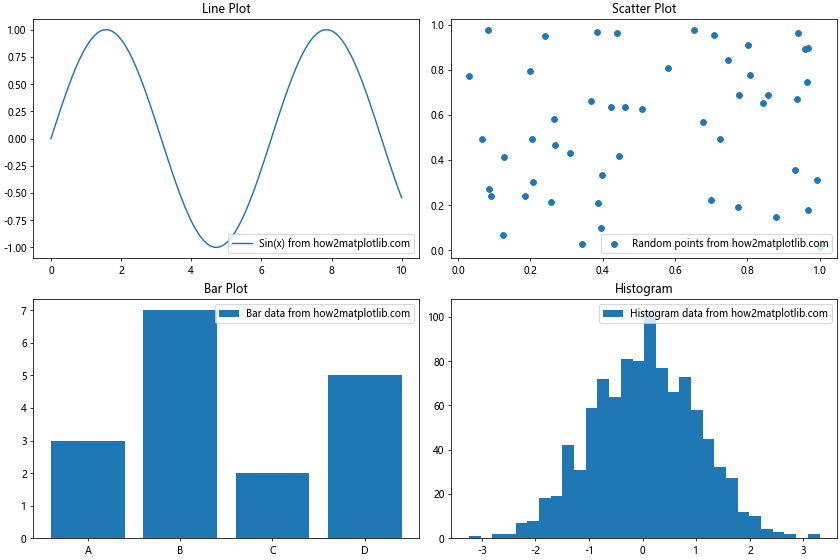
In this example, we create a complex layout with four different types of plots: a line plot, a scatter plot, a bar plot, and a histogram. The set_constrained_layout(True) call ensures that all these different plot types are arranged neatly without overlapping.
Nested Layouts
Matplotlib.figure.Figure.set_constrained_layout() can handle nested layouts as well. Here’s an example:
import matplotlib.pyplot as plt
import numpy as np

fig = plt.figure(figsize=(12, 8))
fig.set_constrained_layout(True)

# Create a 2x2 grid
gs = fig.add_gridspec(2, 2)

# Regular subplot
ax1 = fig.add_subplot(gs[0, 0])
x = np.linspace(0, 10, 100)
ax1.plot(x, np.sin(x), label='Sin(x) from how2matplotlib.com')
ax1.set_title('Regular Subplot')
ax1.legend()

# Nested layout in top-right
nested_gs = gs[0, 1].subgridspec(2, 2)
for i, ax in enumerate(nested_gs):
    ax = fig.add_subplot(ax)
    ax.plot(x, np.random.rand(100), label=f'Random data {i+1} from how2matplotlib.com')
    ax.set_title(f'Nested Plot {i+1}')
    ax.legend()

# Regular subplots in bottom row
ax3 = fig.add_subplot(gs[1, 0])
ax3.scatter(np.random.rand(50), np.random.rand(50), label='Scatter from how2matplotlib.com')
ax3.set_title('Scatter Plot')
ax3.legend()

ax4 = fig.add_subplot(gs[1, 1])
ax4.bar(['A', 'B', 'C', 'D'], [3, 7, 2, 5], label='Bar data from how2matplotlib.com')
ax4.set_title('Bar Plot')
ax4.legend()

plt.show()
Output:
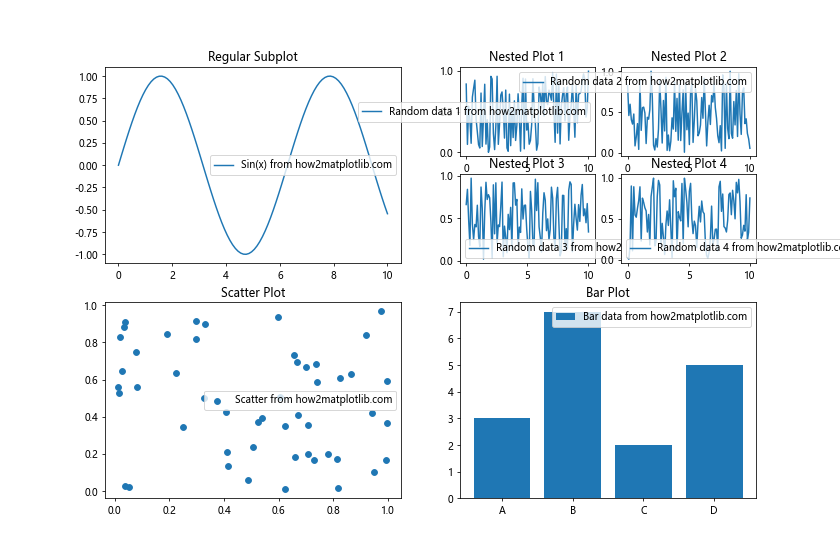
This example demonstrates how set_constrained_layout() can handle a complex nested layout, with a regular subplot, a 2×2 nested grid of subplots, and two more regular subplots.
Matplotlib.figure.Figure.set_constrained_layout() and Colorbars
Colorbars can sometimes be tricky to position correctly, but set_constrained_layout() can help with this as well:
import matplotlib.pyplot as plt
import numpy as np

fig, (ax1, ax2) = plt.subplots(1, 2, figsize=(12, 5))
fig.set_constrained_layout(True)

# Generate sample data
data1 = np.random.rand(20, 20)
data2 = np.random.rand(20, 20)

# Plot heatmaps with colorbars
im1 = ax1.imshow(data1, cmap='viridis')
im2 = ax2.imshow(data2, cmap='plasma')

# Add colorbars
fig.colorbar(im1, ax=ax1, label='Colorbar 1 from how2matplotlib.com')
fig.colorbar(im2, ax=ax2, label='Colorbar 2 from how2matplotlib.com')

ax1.set_title('Heatmap 1')
ax2.set_title('Heatmap 2')

plt.show()
Output:
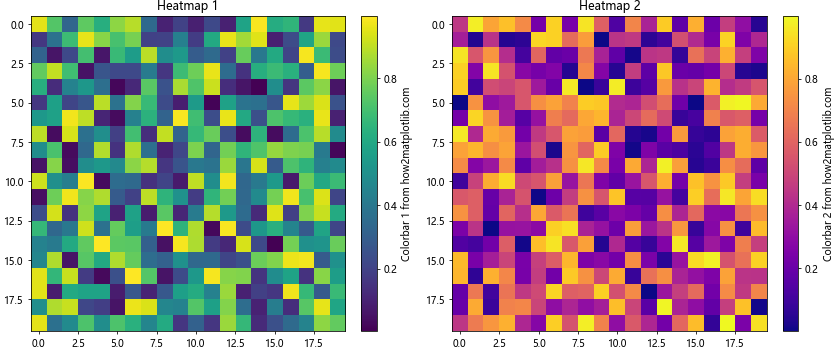
In this example, we create two heatmaps with colorbars. The set_constrained_layout(True) call ensures that the colorbars are positioned correctly without overlapping with the plots or each other.
Matplotlib.figure.Figure.set_constrained_layout() with Annotations
When working with annotations, set_constrained_layout() can help ensure that they don’t overlap with other plot elements:
import matplotlib.pyplot as plt
import numpy as np

fig, ax = plt.subplots(figsize=(10, 6))
fig.set_constrained_layout(True)

x = np.linspace(0, 10, 100)
y = np.sin(x)

ax.plot(x, y, label='Sin(x) from how2matplotlib.com')
ax.set_title('Sine Wave with Annotations')
ax.legend()

# Add annotations
ax.annotate('Peak', xy=(np.pi/2, 1), xytext=(np.pi/2, 1.2),
            arrowprops=dict(facecolor='black', shrink=0.05))
ax.annotate('Trough', xy=(3*np.pi/2, -1), xytext=(3*np.pi/2, -1.2),
            arrowprops=dict(facecolor='black', shrink=0.05))

plt.show()
Output:
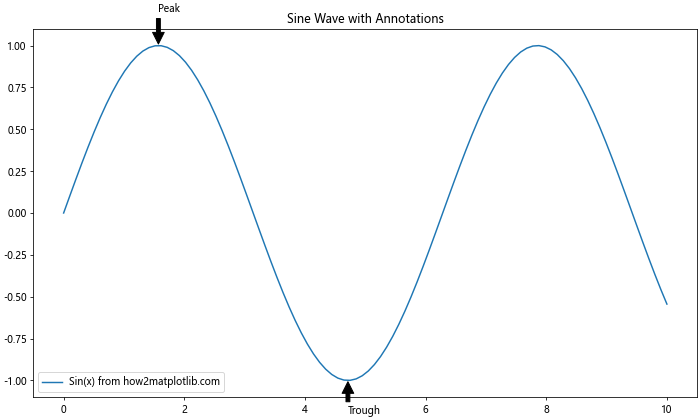
This example shows how set_constrained_layout() helps position annotations without overlapping with the plot or its labels.
Matplotlib.figure.Figure.set_constrained_layout() and Legends
Legends can sometimes be tricky to position, especially with multiple subplots. set_constrained_layout() can help with this:
import matplotlib.pyplot as plt
import numpy as np

fig, (ax1, ax2) = plt.subplots(1, 2, figsize=(12, 5))
fig.set_constrained_layout(True)

x = np.linspace(0, 10, 100)

# Plot multiple lines on each subplot
for i in range(3):
    ax1.plot(x, np.sin(x + i), label=f'Sin(x+{i}) from how2matplotlib.com')
    ax2.plot(x, np.cos(x + i), label=f'Cos(x+{i}) from how2matplotlib.com')

ax1.set_title('Sine Waves')
ax2.set_title('Cosine Waves')

# Add legends
ax1.legend(loc='upper right')
ax2.legend(loc='upper left')

plt.show()
Output:
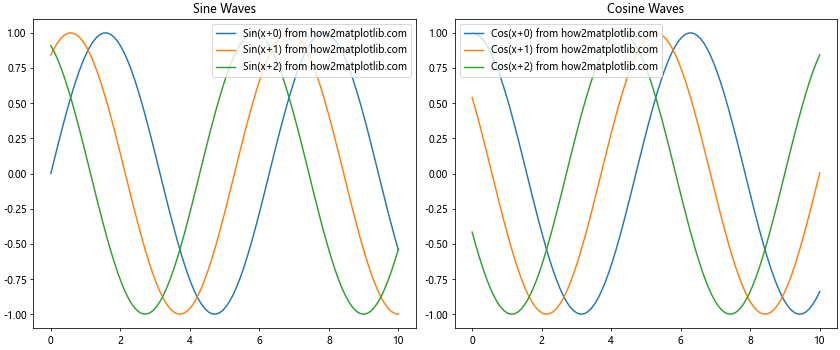
In this example, we create two subplots with multiple lines and legends. set_constrained_layout() ensures that the legends are positioned correctly without overlapping with the plots or each other.
Matplotlib.figure.Figure.set_constrained_layout() with Tight Layout
While set_constrained_layout() is powerful, there might be cases where you want to combine it with tight_layout(). Here’s how you can do that:
import matplotlib.pyplot as plt
import numpy as np

fig, axs = plt.subplots(2, 2, figsize=(10, 8))
fig.set_constrained_layout(True)

x = np.linspace(0, 10, 100)
for ax in axs.flat:
    ax.plot(x, np.random.rand(100), label='Random data from how2matplotlib.com')
    ax.set_title('Random Plot')
    ax.legend()

# Apply tight layout after constrained layout
plt.tight_layout()

plt.show()
Output:
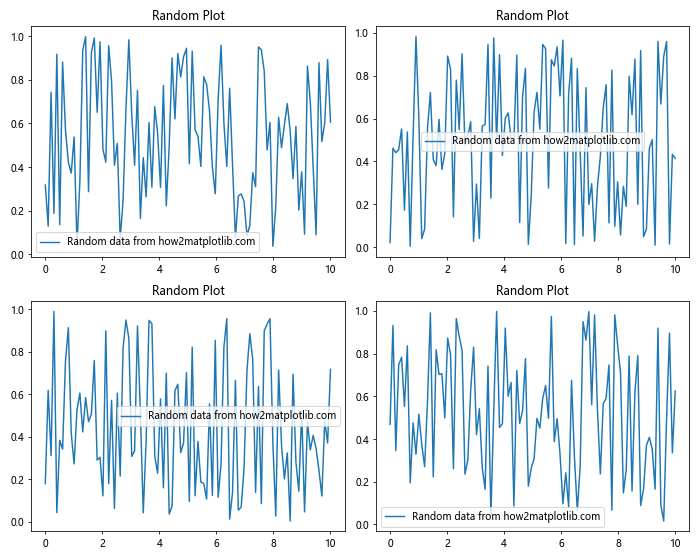
In this example, we first apply constrained layout using set_constrained_layout(True), and then call plt.tight_layout() to further adjust the layout. This can sometimes result in even better use of space.
Matplotlib.figure.Figure.set_constrained_layout() and Subplots with Different Sizes
set_constrained_layout() is particularly useful when dealing with subplots of different sizes:
import matplotlib.pyplot as plt
import numpy as np

fig = plt.figure(figsize=(12, 8))
fig.set_constrained_layout(True)

# Create a grid with different column widths
gs = fig.add_gridspec(2, 3, width_ratios=[1, 2, 1])

# Create subplots of different sizes
ax1 = fig.add_subplot(gs[0, 0])
ax2 = fig.add_subplot(gs[0, 1:])
ax3 = fig.add_subplot(gs[1, :2])
ax4 = fig.add_subplot(gs[1, 2])

# Add some sample plots
x = np.linspace(0, 10, 100)
ax1.plot(x, np.sin(x), label='Sin(x) from how2matplotlib.com')
ax2.plot(x, np.cos(x), label='Cos(x) from how2matplotlib.com')
ax3.scatter(np.random.rand(50), np.random.rand(50), label='Scatter from how2matplotlib.com')
ax4.bar(['A', 'B', 'C'], [3, 7,2], label='Bar data from how2matplotlib.com')

# Add titles and legends
for ax in [ax1, ax2, ax3, ax4]:
    ax.set_title(f'Plot from how2matplotlib.com')
    ax.legend()

plt.show()
Output:
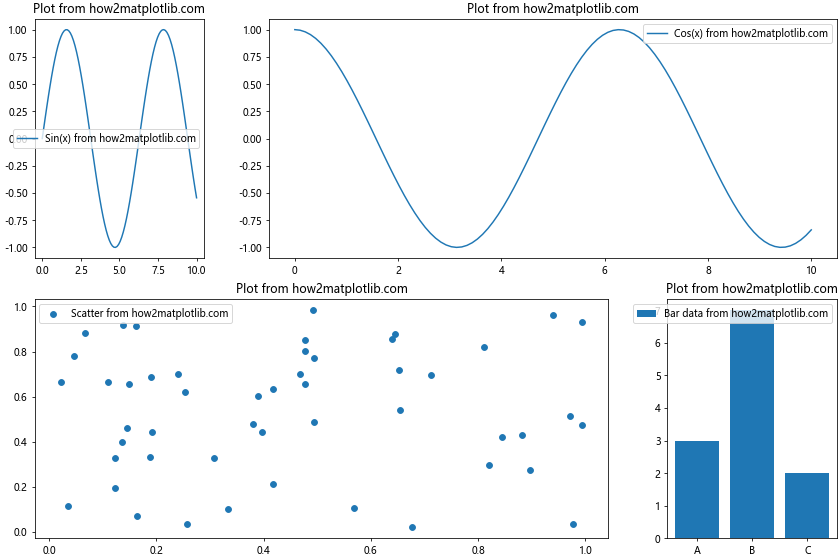
In this example, we create a complex layout with subplots of different sizes. set_constrained_layout() ensures that all subplots are positioned correctly and use the available space efficiently.
Matplotlib.figure.Figure.set_constrained_layout() with Polar Plots
set_constrained_layout() can also handle more specialized plot types, such as polar plots:
import matplotlib.pyplot as plt
import numpy as np

fig, (ax1, ax2) = plt.subplots(1, 2, figsize=(12, 5), subplot_kw=dict(projection='polar'))
fig.set_constrained_layout(True)

# Generate data for polar plots
r = np.linspace(0, 2, 100)
theta = 2 * np.pi * r

# Create polar plots
ax1.plot(theta, r, label='Spiral from how2matplotlib.com')
ax2.plot(theta, r**2, label='Quadratic spiral from how2matplotlib.com')

ax1.set_title('Linear Spiral')
ax2.set_title('Quadratic Spiral')

ax1.legend()
ax2.legend()

plt.show()
Output:
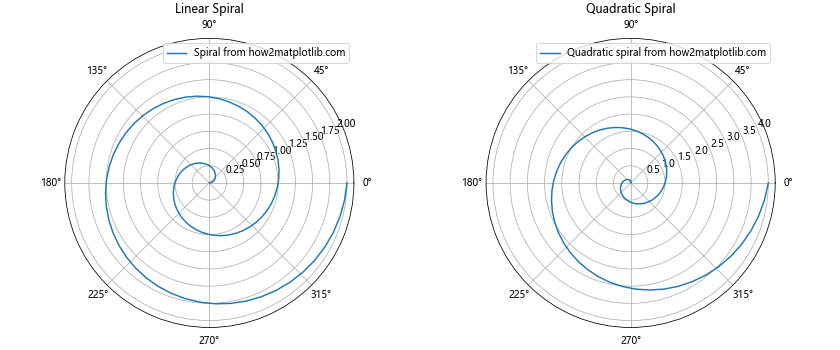
This example demonstrates how set_constrained_layout() can effectively manage the layout of polar plots, ensuring they are properly sized and positioned.
Matplotlib.figure.Figure.set_constrained_layout() and Text Elements
When working with text elements in your plots, set_constrained_layout() can help ensure they don’t overlap with other elements:
import matplotlib.pyplot as plt
import numpy as np

fig, ax = plt.subplots(figsize=(10, 6))
fig.set_constrained_layout(True)

x = np.linspace(0, 10, 100)
y = np.sin(x)

ax.plot(x, y, label='Sin(x) from how2matplotlib.com')
ax.set_title('Sine Wave with Text Elements')
ax.legend()

# Add text elements
ax.text(2, 0.5, 'Local maximum', fontsize=12, ha='center')
ax.text(5, -0.5, 'Zero crossing', fontsize=12, ha='center')
ax.text(8, 0.8, 'Increasing', fontsize=12, ha='center')

plt.show()
Output:
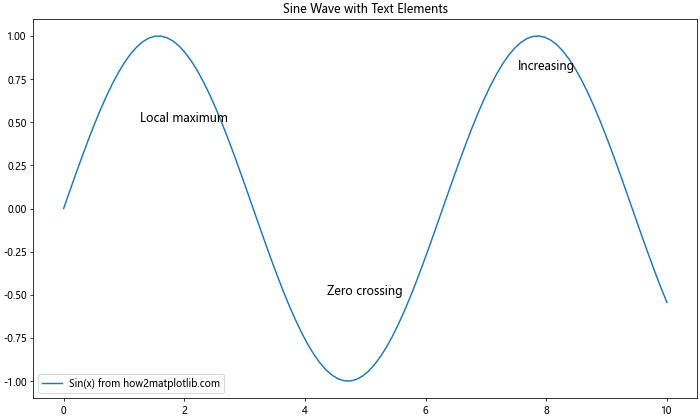
In this example, set_constrained_layout() helps position the text elements without overlapping with the plot or its labels.
Matplotlib.figure.Figure.set_constrained_layout() with Inset Axes
set_constrained_layout() can also handle inset axes effectively:
import matplotlib.pyplot as plt
import numpy as np
from mpl_toolkits.axes_grid1.inset_locator import inset_axes

fig, ax = plt.subplots(figsize=(10, 6))
fig.set_constrained_layout(True)

x = np.linspace(0, 10, 100)
y = np.sin(x)

ax.plot(x, y, label='Sin(x) from how2matplotlib.com')
ax.set_title('Sine Wave with Inset Plot')
ax.legend()

# Create an inset axes
axins = inset_axes(ax, width="40%", height="30%", loc=1)
axins.plot(x, np.cos(x), label='Cos(x) from how2matplotlib.com')
axins.set_title('Inset: Cosine Wave')
axins.legend()

plt.show()
Output:
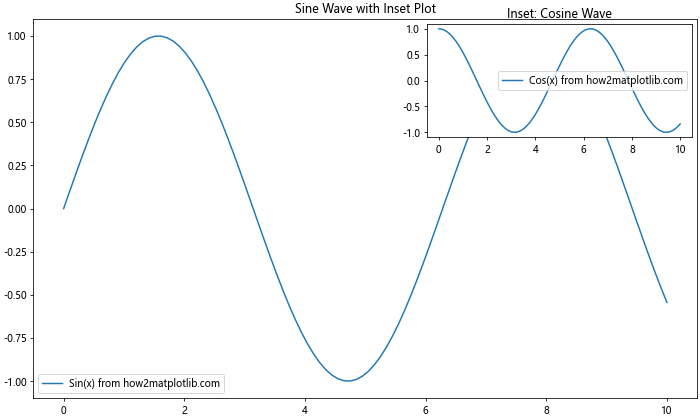
This example shows how set_constrained_layout() can manage the main plot and an inset plot, ensuring they are positioned correctly without overlapping.
Matplotlib.figure.Figure.set_constrained_layout() and Shared Axes
When working with subplots that share axes, set_constrained_layout() can help maintain proper alignment:
import matplotlib.pyplot as plt
import numpy as np

fig, (ax1, ax2) = plt.subplots(2, 1, figsize=(10, 8), sharex=True)
fig.set_constrained_layout(True)

x = np.linspace(0, 10, 100)
y1 = np.sin(x)
y2 = np.cos(x)

ax1.plot(x, y1, label='Sin(x) from how2matplotlib.com')
ax2.plot(x, y2, label='Cos(x) from how2matplotlib.com')

ax1.set_title('Sine Wave')
ax2.set_title('Cosine Wave')

ax1.legend()
ax2.legend()

plt.show()
Output:
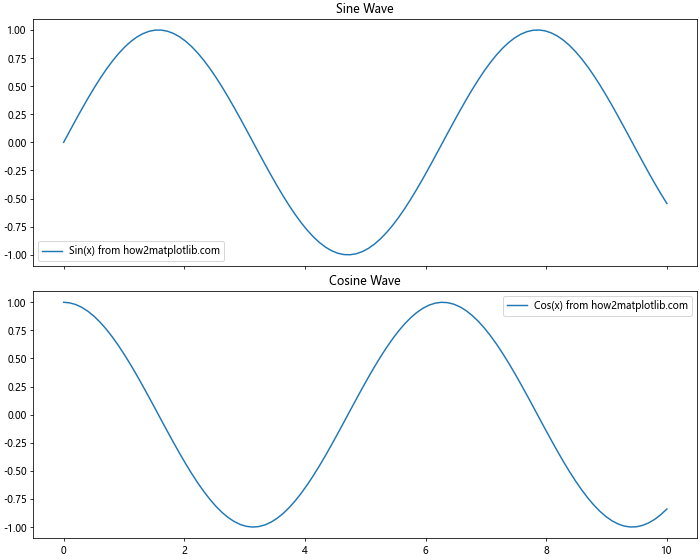
In this example, we create two subplots that share the x-axis. set_constrained_layout() ensures that the subplots are aligned properly and that labels don’t overlap.
Conclusion: Mastering Matplotlib.figure.Figure.set_constrained_layout()
Throughout this comprehensive guide, we’ve explored the power and versatility of Matplotlib.figure.Figure.set_constrained_layout() in Python. This method is an invaluable tool for creating clean, professional-looking plots with minimal effort. By automatically adjusting the layout of your plots, it saves time and ensures consistency across your visualizations.
We’ve covered a wide range of scenarios where set_constrained_layout() shines, including:
- Basic usage and benefits
- Customizing layout parameters
- Handling complex and nested layouts
- Working with colorbars and annotations
- Managing legends and text elements
- Combining with other layout tools like tight_layout()
- Dealing with subplots of different sizes
- Accommodating specialized plot types like polar plots
- Incorporating inset axes
- Aligning shared axes
By mastering Matplotlib.figure.Figure.set_constrained_layout(), you’ll be able to create more polished and readable visualizations with less manual adjustment. This not only improves the quality of your plots but also streamlines your workflow, allowing you to focus more on data analysis and less on tweaking plot layouts.
Remember that while set_constrained_layout() is powerful, it may not always produce perfect results in every scenario. In such cases, you may need to combine it with other layout tools or make manual adjustments. However, for the vast majority of plotting tasks, set_constrained_layout() will significantly simplify your work and improve the overall quality of your visualizations.