How to Use Matplotlib Cursor Widget

How to Use Matplotlib Cursor Widget

Matplotlib Cursor Widget is a powerful tool for interactive data exploration in Matplotlib, one of the most popular plotting libraries in Python. This article will provide an in-depth look at how to use the Matplotlib Cursor Widget effectively in your data visualization projects. We’ll cover everything from basic usage to advanced techniques, with plenty of examples along the way.

Introduction to Matplotlib Cursor Widget

The Matplotlib Cursor Widget is a feature that allows users to interact with plots by displaying cursor coordinates and other information as they move the mouse over the plot. This widget is particularly useful for precise data reading and analysis, making it an essential tool for many data scientists and researchers.

Let’s start with a simple example of how to implement a basic Matplotlib Cursor Widget:

import matplotlib.pyplot as plt
from matplotlib.widgets import Cursor

fig, ax = plt.subplots(figsize=(8, 6))
ax.set_title("Basic Matplotlib Cursor Widget - how2matplotlib.com")
ax.plot([1, 2, 3, 4], [1, 4, 2, 3])

cursor = Cursor(ax, useblit=True, color='red', linewidth=1)

plt.show()

Output:
How to Use Matplotlib Cursor Widget

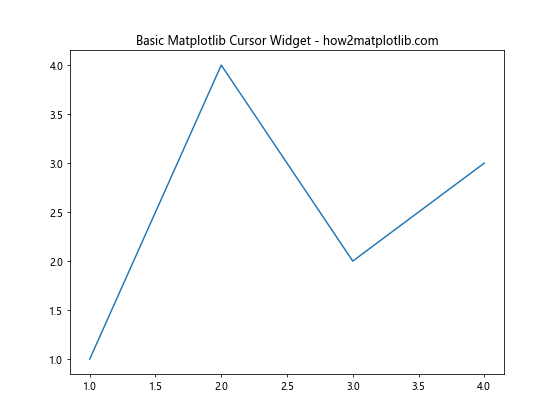
In this example, we create a simple line plot and add a Cursor widget to it. The Cursor is initialized with the axis object (ax), and we set useblit=True for better performance. The color and linewidth of the cursor can be customized as shown.

Understanding Cursor Parameters

The Matplotlib Cursor Widget comes with several parameters that allow you to customize its behavior and appearance. Let’s explore some of these parameters:

  1. useblit: This boolean parameter determines whether to use blitting for drawing the cursor. Blitting can significantly improve performance, especially for complex plots.

  2. horizOn and vertOn: These boolean parameters control whether to draw the horizontal and vertical lines of the cursor, respectively.

  3. color: Sets the color of the cursor lines.

  4. linewidth: Determines the width of the cursor lines.

  5. linestyle: Sets the style of the cursor lines (e.g., solid, dashed, dotted).

Here’s an example demonstrating the use of these parameters:

import matplotlib.pyplot as plt
from matplotlib.widgets import Cursor

fig, ax = plt.subplots(figsize=(8, 6))
ax.set_title("Customized Matplotlib Cursor Widget - how2matplotlib.com")
ax.plot([1, 2, 3, 4], [1, 4, 2, 3])

cursor = Cursor(ax, useblit=True, color='green', linewidth=2, 
                linestyle='--', horizOn=True, vertOn=True)

plt.show()

Output:

How to Use Matplotlib Cursor Widget

In this example, we create a green, dashed cursor with a line width of 2. Both horizontal and vertical lines are enabled.

Adding Interactivity with Cursor

One of the most powerful features of the Matplotlib Cursor Widget is its ability to add interactivity to your plots. You can use the cursor to display data values, highlight specific points, or trigger custom actions when the user interacts with the plot.

Let’s create an example where the cursor displays the x and y coordinates of the current mouse position:

import matplotlib.pyplot as plt
from matplotlib.widgets import Cursor

fig, ax = plt.subplots(figsize=(8, 6))
ax.set_title("Interactive Matplotlib Cursor Widget - how2matplotlib.com")
ax.plot([1, 2, 3, 4], [1, 4, 2, 3])

def on_move(event):
    if event.inaxes:
        ax.set_title(f"Cursor position: ({event.xdata:.2f}, {event.ydata:.2f})")
        fig.canvas.draw_idle()

cursor = Cursor(ax, useblit=True, color='red', linewidth=1)
fig.canvas.mpl_connect('motion_notify_event', on_move)

plt.show()

Output:

How to Use Matplotlib Cursor Widget

In this example, we define an on_move function that updates the plot title with the current cursor coordinates. We then connect this function to the ‘motion_notify_event’ of the figure canvas, which is triggered whenever the mouse moves over the plot.

Cursor Widget with Multiple Subplots

The Matplotlib Cursor Widget can also be used with multiple subplots. This is particularly useful when you want to compare data across different plots or when working with complex visualizations.

Here’s an example of how to implement a Cursor Widget across multiple subplots:

import matplotlib.pyplot as plt
from matplotlib.widgets import Cursor

fig, (ax1, ax2) = plt.subplots(2, 1, figsize=(8, 10))
fig.suptitle("Matplotlib Cursor Widget with Multiple Subplots - how2matplotlib.com")

ax1.plot([1, 2, 3, 4], [1, 4, 2, 3])
ax2.plot([1, 2, 3, 4], [3, 2, 4, 1])

cursor1 = Cursor(ax1, useblit=True, color='red', linewidth=1)
cursor2 = Cursor(ax2, useblit=True, color='blue', linewidth=1)

plt.show()

Output:

How to Use Matplotlib Cursor Widget

In this example, we create two subplots and add a separate Cursor Widget to each. Note that we use different colors for each cursor to distinguish between them.

Combining Cursor Widget with Other Widgets

The Matplotlib Cursor Widget can be combined with other widgets to create more complex and interactive visualizations. For example, you can use it alongside the Slider widget to allow users to dynamically adjust plot parameters while also seeing precise cursor coordinates.

Here’s an example that combines the Cursor Widget with a Slider:

import numpy as np
import matplotlib.pyplot as plt
from matplotlib.widgets import Cursor, Slider

fig, ax = plt.subplots(figsize=(8, 6))
fig.subplots_adjust(bottom=0.2)

t = np.linspace(0, 10, 1000)
amp_init = 1
freq_init = 1
s = amp_init * np.sin(2 * np.pi * freq_init * t)

line, = ax.plot(t, s)
ax.set_title("Matplotlib Cursor Widget with Slider - how2matplotlib.com")

cursor = Cursor(ax, useblit=True, color='red', linewidth=1)

ax_freq = plt.axes([0.2, 0.1, 0.6, 0.03])
freq_slider = Slider(ax_freq, 'Frequency', 0.1, 5.0, valinit=freq_init)

def update(val):
    freq = freq_slider.val
    line.set_ydata(amp_init * np.sin(2 * np.pi * freq * t))
    fig.canvas.draw_idle()

freq_slider.on_changed(update)

plt.show()

Output:

How to Use Matplotlib Cursor Widget

In this example, we create a sine wave plot with a frequency slider. The Cursor Widget allows precise reading of coordinates, while the Slider allows dynamic adjustment of the wave frequency.

Custom Cursor Behavior

While the default Cursor Widget is useful for many applications, you might sometimes need to implement custom cursor behavior. Matplotlib allows you to create custom cursor classes by subclassing the base Cursor class.

Here’s an example of a custom cursor that highlights the nearest data point:

import numpy as np
import matplotlib.pyplot as plt
from matplotlib.widgets import Cursor

class HighlightCursor(Cursor):
    def __init__(self, ax, x, y, **kwargs):
        super().__init__(ax, **kwargs)
        self.x = x
        self.y = y
        self.point, = ax.plot([], [], 'ro', markersize=10)

    def onmove(self, event):
        if event.inaxes:
            super().onmove(event)
            x, y = event.xdata, event.ydata
            distances = np.sqrt((self.x - x)**2 + (self.y - y)**2)
            idx = np.argmin(distances)
            self.point.set_data(self.x[idx], self.y[idx])
            self.ax.figure.canvas.draw_idle()

fig, ax = plt.subplots(figsize=(8, 6))
ax.set_title("Custom Matplotlib Cursor Widget - how2matplotlib.com")

x = np.linspace(0, 10, 100)
y = np.sin(x)
ax.plot(x, y)

cursor = HighlightCursor(ax, x, y, useblit=True, color='red', linewidth=1)

plt.show()

Output:

How to Use Matplotlib Cursor Widget

In this example, we create a custom HighlightCursor class that inherits from the base Cursor class. This custom cursor highlights the nearest data point to the current cursor position.

Cursor Widget in 3D Plots

The Matplotlib Cursor Widget can also be used with 3D plots, although its behavior is slightly different. In 3D plots, the cursor typically shows the projection of the cursor position onto the plot axes.

Here’s an example of using the Cursor Widget with a 3D plot:

import numpy as np
import matplotlib.pyplot as plt
from mpl_toolkits.mplot3d import Axes3D
from matplotlib.widgets import Cursor

fig = plt.figure(figsize=(8, 6))
ax = fig.add_subplot(111, projection='3d')
ax.set_title("Matplotlib Cursor Widget in 3D - how2matplotlib.com")

x = np.linspace(-5, 5, 100)
y = np.linspace(-5, 5, 100)
X, Y = np.meshgrid(x, y)
Z = np.sin(np.sqrt(X**2 + Y**2))

ax.plot_surface(X, Y, Z)

cursor = Cursor(ax, useblit=True, color='red', linewidth=1)

plt.show()

Output:

How to Use Matplotlib Cursor Widget

In this example, we create a 3D surface plot and add a Cursor Widget to it. The cursor will show projections onto the x, y, and z axes as you move the mouse over the plot.

Cursor Widget with Image Plots

The Matplotlib Cursor Widget can be particularly useful when working with image plots, allowing users to precisely identify pixel coordinates and values.

Here’s an example of using the Cursor Widget with an image plot:

import numpy as np
import matplotlib.pyplot as plt
from matplotlib.widgets import Cursor

fig, ax = plt.subplots(figsize=(8, 6))
ax.set_title("Matplotlib Cursor Widget with Image Plot - how2matplotlib.com")

image = np.random.rand(100, 100)
im = ax.imshow(image, cmap='viridis')

cursor = Cursor(ax, useblit=True, color='white', linewidth=1)

def format_coord(x, y):
    if x is None or y is None:
        return ""
    x = int(x + 0.5)
    y = int(y + 0.5)
    try:
        return f"x={x}, y={y}, value={image[y, x]:.2f}"
    except IndexError:
        return ""

ax.format_coord = format_coord

plt.colorbar(im)
plt.show()

Output:

How to Use Matplotlib Cursor Widget

In this example, we create a random image plot and add a Cursor Widget to it. We also define a custom format_coord function that displays the x and y coordinates along with the pixel value at the cursor position.

Cursor Widget in Real-time Data Visualization

The Matplotlib Cursor Widget can be particularly useful in real-time data visualization scenarios, where data is continuously updated and users need to interact with the latest information.

Here’s an example of using the Cursor Widget in a real-time plotting scenario:

import numpy as np
import matplotlib.pyplot as plt
from matplotlib.widgets import Cursor
from matplotlib.animation import FuncAnimation

fig, ax = plt.subplots(figsize=(8, 6))
ax.set_title("Matplotlib Cursor Widget with Real-time Data - how2matplotlib.com")
ax.set_xlim(0, 100)
ax.set_ylim(-1, 1)

line, = ax.plot([], [])
cursor = Cursor(ax, useblit=True, color='red', linewidth=1)

x_data = []
y_data = []

def update(frame):
    x_data.append(frame)
    y_data.append(np.sin(frame * 0.1))
    line.set_data(x_data, y_data)
    return line,

ani = FuncAnimation(fig, update, frames=range(100), blit=True, interval=50)

plt.show()

Output:

How to Use Matplotlib Cursor Widget

In this example, we create an animated plot that updates in real-time. The Cursor Widget allows users to interact with the plot as new data points are added.

Cursor Widget and Event Handling

The Matplotlib Cursor Widget can be combined with event handling to create more complex interactive visualizations. For example, you can use mouse click events to select specific data points or regions of interest.

Here’s an example that demonstrates how to combine the Cursor Widget with mouse click events:

import numpy as np
import matplotlib.pyplot as plt
from matplotlib.widgets import Cursor

fig, ax = plt.subplots(figsize=(8, 6))
ax.set_title("Matplotlib Cursor Widget with Event Handling - how2matplotlib.com")

x = np.linspace(0, 10, 100)
y = np.sin(x)
line, = ax.plot(x, y)

cursor = Cursor(ax, useblit=True, color='red', linewidth=1)

selected_points, = ax.plot([], [], 'ro', markersize=10)

def on_click(event):
    if event.inaxes:
        x_click, y_click = event.xdata, event.ydata
        distances = np.sqrt((x - x_click)**2 + (y - y_click)**2)
        idx = np.argmin(distances)
        x_selected, y_selected = x[idx], y[idx]

        current_x, current_y = selected_points.get_data()
        new_x = np.append(current_x, x_selected)
        new_y = np.append(current_y, y_selected)

        selected_points.set_data(new_x, new_y)
        fig.canvas.draw_idle()

fig.canvas.mpl_connect('button_press_event', on_click)

plt.show()

Output:

How to Use Matplotlib Cursor Widget

In this example, we create a plot with a Cursor Widget and add functionality to select points by clicking. When a user clicks on the plot, the nearest data point is highlighted.

Cursor Widget in Polar Plots

The Matplotlib Cursor Widget can also be used with polar plots, although the interpretation of cursor coordinates is slightly different in this case.

Here’s an example of using the Cursor Widget with a polar plot:

import numpy as np
import matplotlib.pyplot as plt
from matplotlib.widgets import Cursor

fig, ax = plt.subplots(figsize=(8, 8), subplot_kw=dict(projection='polar'))
ax.set_title("Matplotlib Cursor Widget in Polar Plot - how2matplotlib.com")

r = np.linspace(0, 1, 100)
theta = 2 * np.pi * r

ax.plot(theta, r)

cursor = Cursor(ax, useblit=True, color='red', linewidth=1)

def format_coord(theta, r):
    return f"θ={np.degrees(theta):.2f}°, r={r:.2f}"

ax.format_coord = format_coord

plt.show()

Output:

How to Use Matplotlib Cursor Widget

In this example, we create a polar plot and add a Cursor Widget to it. We also define a custom format_coord function to display the polar coordinates (θ and r) at the cursor position.

Cursor Widget with Multiple Data Series

When working with plots that contain multiple data series, the Cursor Widget can be used to provide information about all series simultaneously.

Here’s an example that demonstrates this:

import numpy as np
import matplotlib.pyplot as plt
from matplotlib.widgets import Cursor

fig, ax = plt.subplots(figsize=(8, 6))
ax.set_title("Matplotlib Cursor Widget with Multiple Series - how2matplotlib.com")

x = np.linspace(0, 10, 100)
y1 = np.sin(x)
y2 = np.cos(x)
y3 = np.tan(x)

line1, = ax.plot(x, y1, label='sin(x)')
line2, = ax.plot(x, y2, label='cos(x)')
line3, = ax.plot(x, y3, label='tan(x)')

ax.legend()

cursor = Cursor(ax, useblit=True, color='red', linewidth=1)

def format_coord(x, y):
    return f"x={x:.2f}, sin(x)={np.sin(x):.2f}, cos(x)={np.cos(x):.2f}, tan(x)={np.tan(x):.2f}"

ax.format_coord = format_coord

plt.show()

Output:

How to Use Matplotlib Cursor Widget

In this example, we plot three trigonometric functions and use a custom format_coord function to display the values of all three functions at the cursor position.

Cursor Widget in Logarithmic Plots

The Matplotlib Cursor Widget can be used effectively with logarithmic plots as well. This is particularly useful when dealing with data that spans multiple orders of magnitude.

Here’s an example of using the Cursor Widget with a logarithmic plot:

import numpy as np
import matplotlib.pyplot as plt
from matplotlib.widgets import Cursor

fig, ax = plt.subplots(figsize=(8, 6))
ax.set_title("Matplotlib Cursor Widget in Logarithmic Plot - how2matplotlib.com")

x = np.logspace(0, 5, 100)
y = x**2

ax.loglog(x, y)
ax.set_xlabel('x (log scale)')
ax.set_ylabel('y (log scale)')

cursor = Cursor(ax, useblit=True, color='red', linewidth=1)

def format_coord(x, y):
    return f"x={x:.2e}, y={y:.2e}"

ax.format_coord = format_coord

plt.show()

Output:

How to Use Matplotlib Cursor Widget

In this example, we create a log-log plot and add a Cursor Widget to it. The custom format_coord function displays the x and y values in scientific notation, which is often more readable for logarithmic scales.

Cursor Widget with Date/Time Axes

When working with time series data, the Matplotlib Cursor Widget can be used to display precise date and time information.

Here’s an example of using the Cursor Widget with a date/time axis:

import numpy as np
import matplotlib.pyplot as plt
from matplotlib.widgets import Cursor
from matplotlib.dates import DateFormatter
import datetime

fig, ax = plt.subplots(figsize=(8, 6))
ax.set_title("Matplotlib Cursor Widget with Date/Time Axis - how2matplotlib.com")

base = datetime.datetime(2023, 1, 1)
dates = [base + datetime.timedelta(days=x) for x in range(100)]
y = np.random.randn(100).cumsum()

ax.plot(dates, y)
ax.xaxis.set_major_formatter(DateFormatter('%Y-%m-%d'))
fig.autofmt_xdate()

cursor = Cursor(ax, useblit=True, color='red', linewidth=1)

def format_coord(x, y):
    date = matplotlib.dates.num2date(x).strftime('%Y-%m-%d')
    return f"Date: {date}, Value: {y:.2f}"

ax.format_coord = format_coord

plt.show()

Output:

How to Use Matplotlib Cursor Widget

In this example, we create a time series plot and add a Cursor Widget to it. The custom format_coord function displays the date in a readable format along with the corresponding y-value.

Cursor Widget in Heatmaps

The Matplotlib Cursor Widget can be particularly useful when working with heatmaps, allowing users to precisely identify values in specific cells.

Here’s an example of using the Cursor Widget with a heatmap:

import numpy as np
import matplotlib.pyplot as plt
from matplotlib.widgets import Cursor

fig, ax = plt.subplots(figsize=(8, 6))
ax.set_title("Matplotlib Cursor Widget in Heatmap - how2matplotlib.com")

data = np.random.rand(10, 10)
im = ax.imshow(data, cmap='viridis')

cursor = Cursor(ax, useblit=True, color='white', linewidth=1)

def format_coord(x, y):
    if x is None or y is None:
        return ""
    x = int(x + 0.5)
    y = int(y + 0.5)
    try:
        return f"x={x}, y={y}, value={data[y, x]:.2f}"
    except IndexError:
        return ""

ax.format_coord = format_coord

plt.colorbar(im)
plt.show()

Output:

How to Use Matplotlib Cursor Widget

In this example, we create a heatmap and add a Cursor Widget to it. The custom format_coord function displays the x and y indices of the cell along with its value.

Cursor Widget in Scatter Plots

The Matplotlib Cursor Widget can be very useful in scatter plots, especially when dealing with large datasets where individual points may be hard to distinguish.

Here’s an example of using the Cursor Widget with a scatter plot:

import numpy as np
import matplotlib.pyplot as plt
from matplotlib.widgets import Cursor

fig, ax = plt.subplots(figsize=(8, 6))
ax.set_title("Matplotlib Cursor Widget in Scatter Plot - how2matplotlib.com")

x = np.random.randn(1000)
y = np.random.randn(1000)

scatter = ax.scatter(x, y, alpha=0.5)

cursor = Cursor(ax, useblit=True, color='red', linewidth=1)

def format_coord(x, y):
    return f"x={x:.2f}, y={y:.2f}"

ax.format_coord = format_coord

plt.show()

Output:

How to Use Matplotlib Cursor Widget

In this example, we create a scatter plot with 1000 points and add a Cursor Widget to it. The custom format_coord function displays the x and y coordinates of the cursor position.

Cursor Widget in Bar Charts

The Matplotlib Cursor Widget can also be useful in bar charts, allowing users to precisely identify the values of individual bars.

Here’s an example of using the Cursor Widget with a bar chart:

import numpy as np
import matplotlib.pyplot as plt
from matplotlib.widgets import Cursor

fig, ax = plt.subplots(figsize=(8, 6))
ax.set_title("Matplotlib Cursor Widget in Bar Chart - how2matplotlib.com")

categories = ['A', 'B', 'C', 'D', 'E']
values = np.random.randint(1, 100, size=5)

bars = ax.bar(categories, values)

cursor = Cursor(ax, useblit=True, color='red', linewidth=1)

def format_coord(x, y):
    for bar in bars:
        if bar.contains(x, y)[0]:
            height = bar.get_height()
            return f"Category: {bar.get_x() + bar.get_width()/2:.1f}, Value: {height}"
    return ""

ax.format_coord = format_coord

plt.show()

Output:

How to Use Matplotlib Cursor Widget

In this example, we create a bar chart and add a Cursor Widget to it. The custom format_coord function displays the category and value of the bar under the cursor.

Conclusion

The Matplotlib Cursor Widget is a powerful tool for enhancing the interactivity of your plots. Whether you’re working with simple line plots, complex 3D visualizations, or anything in between, the Cursor Widget can help users extract precise information from your data visualizations.

Throughout this article, we’ve explored various aspects of the Matplotlib Cursor Widget, including:

  1. Basic usage and customization
  2. Adding interactivity to plots
  3. Using the Cursor Widget with multiple subplots
  4. Combining the Cursor Widget with other widgets
  5. Creating custom cursor behaviors
  6. Using the Cursor Widget in 3D plots
  7. Applying the Cursor Widget to image plots
  8. Utilizing the Cursor Widget in real-time data visualization
  9. Combining the Cursor Widget with event handling
  10. Using the Cursor Widget in polar plots
  11. Applying the Cursor Widget to plots with multiple data series
  12. Using the Cursor Widget in logarithmic plots
  13. Applying the Cursor Widget to date/time axes
  14. Utilizing the Cursor Widget in heatmaps
  15. Using the Cursor Widget in scatter plots
  16. Applying the Cursor Widget to bar charts

By mastering these techniques, you can create more informative and user-friendly data visualizations. The Matplotlib Cursor Widget is just one of many tools available in Matplotlib, but it’s an important one for anyone looking to create interactive and informative plots.

Like(0)