How to Use Matplotlib Checkbox Widget
Matplotlib Checkbox Widget is a powerful tool for creating interactive visualizations in Python. This article will provide an in-depth exploration of the Matplotlib Checkbox Widget, covering its features, implementation, and various use cases. By the end of this guide, you’ll have a thorough understanding of how to leverage this widget to enhance your data visualization projects.
Introduction to Matplotlib Checkbox Widget
Matplotlib Checkbox Widget is a graphical user interface element that allows users to make binary choices in a plot. It’s part of the Matplotlib library, which is widely used for creating static, animated, and interactive visualizations in Python. The Checkbox Widget is particularly useful when you want to give users the ability to toggle certain elements of a plot on and off, making your visualizations more interactive and user-friendly.
Let’s start with a simple example of how to create a Matplotlib Checkbox Widget:
import matplotlib.pyplot as plt
from matplotlib.widgets import CheckButtons

fig, ax = plt.subplots()
ax.set_title('Matplotlib Checkbox Widget Example - how2matplotlib.com')

# Create some sample data
x = range(10)
y1 = [i**2 for i in x]
y2 = [i**3 for i in x]

# Plot the data
line1, = ax.plot(x, y1, label='Squared')
line2, = ax.plot(x, y2, label='Cubed')

# Create the checkbox
rax = plt.axes([0.05, 0.4, 0.1, 0.15])
check = CheckButtons(rax, ('Squared', 'Cubed'), (True, True))

def func(label):
    if label == 'Squared':
        line1.set_visible(not line1.get_visible())
    elif label == 'Cubed':
        line2.set_visible(not line2.get_visible())
    plt.draw()

check.on_clicked(func)

plt.show()
Output:
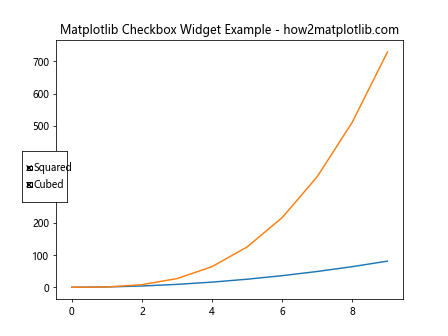
In this example, we create a simple plot with two lines representing squared and cubed values. We then add a Matplotlib Checkbox Widget that allows users to toggle the visibility of each line. The CheckButtons class is used to create the widget, and we define a function func that is called when a checkbox is clicked.
Understanding the Matplotlib Checkbox Widget Structure
The Matplotlib Checkbox Widget is created using the CheckButtons class from the matplotlib.widgets module. The basic structure of a Matplotlib Checkbox Widget includes:
- The widget itself (created using
CheckButtons) - The labels for each checkbox
- The initial states of the checkboxes
- A callback function that defines what happens when a checkbox is clicked
Let’s break down these components with another example:
import matplotlib.pyplot as plt
from matplotlib.widgets import CheckButtons

fig, ax = plt.subplots()
ax.set_title('Matplotlib Checkbox Widget Structure - how2matplotlib.com')

# Create some sample data
x = range(5)
y1 = [1, 2, 3, 4, 5]
y2 = [5, 4, 3, 2, 1]
y3 = [3, 3, 3, 3, 3]

# Plot the data
line1, = ax.plot(x, y1, label='Line 1')
line2, = ax.plot(x, y2, label='Line 2')
line3, = ax.plot(x, y3, label='Line 3')

# Create the checkbox
rax = plt.axes([0.05, 0.4, 0.1, 0.15])
labels = ['Line 1', 'Line 2', 'Line 3']
initial_states = [True, True, True]
check = CheckButtons(rax, labels, initial_states)

def func(label):
    if label == 'Line 1':
        line1.set_visible(not line1.get_visible())
    elif label == 'Line 2':
        line2.set_visible(not line2.get_visible())
    elif label == 'Line 3':
        line3.set_visible(not line3.get_visible())
    plt.draw()

check.on_clicked(func)

plt.show()
Output:
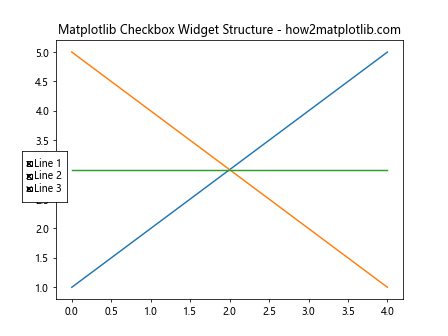
In this example, we create three lines and a Matplotlib Checkbox Widget with three checkboxes. The labels list contains the labels for each checkbox, and the initial_states list defines whether each checkbox is initially checked or unchecked. The func callback function toggles the visibility of each line based on which checkbox is clicked.
Customizing the Matplotlib Checkbox Widget
One of the strengths of the Matplotlib Checkbox Widget is its customizability. You can modify various aspects of the widget to suit your needs, including its position, size, colors, and more.
Here’s an example that demonstrates some customization options:
import matplotlib.pyplot as plt
from matplotlib.widgets import CheckButtons

fig, ax = plt.subplots()
ax.set_title('Customized Matplotlib Checkbox Widget - how2matplotlib.com')

# Create some sample data
x = range(10)
y = [i**2 for i in x]

# Plot the data
line, = ax.plot(x, y, label='Data')

# Create the checkbox with custom properties
rax = plt.axes([0.05, 0.4, 0.2, 0.15])
check = CheckButtons(rax, ['Show Data'], [True])

# Customize the checkbox appearance
check.rectangles[0].set_facecolor('lightgreen')
check.rectangles[0].set_edgecolor('darkgreen')
check.labels[0].set_fontsize(12)
check.labels[0].set_color('darkgreen')

def func(label):
    line.set_visible(not line.get_visible())
    plt.draw()

check.on_clicked(func)

plt.show()
Output:
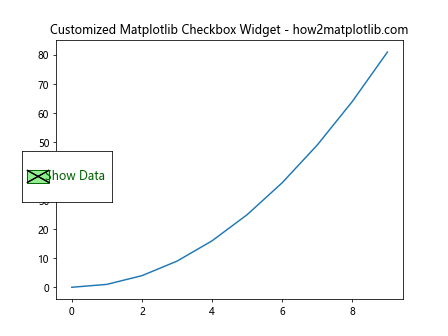
In this example, we customize the Matplotlib Checkbox Widget by changing the color of the checkbox, its border, and the label’s font size and color. These customizations allow you to create a widget that matches the overall style of your visualization.
Using Multiple Matplotlib Checkbox Widgets
In some cases, you might want to use multiple Matplotlib Checkbox Widgets in a single plot. This can be useful when you have different groups of options that you want to control separately. Here’s an example of how to implement multiple checkbox widgets:
import matplotlib.pyplot as plt
from matplotlib.widgets import CheckButtons

fig, ax = plt.subplots()
ax.set_title('Multiple Matplotlib Checkbox Widgets - how2matplotlib.com')

# Create some sample data
x = range(10)
y1 = [i**2 for i in x]
y2 = [i**3 for i in x]
y3 = [i**4 for i in x]

# Plot the data
line1, = ax.plot(x, y1, label='Squared', color='red')
line2, = ax.plot(x, y2, label='Cubed', color='green')
line3, = ax.plot(x, y3, label='Fourth Power', color='blue')

# Create the first checkbox for line visibility
rax1 = plt.axes([0.05, 0.4, 0.1, 0.15])
check1 = CheckButtons(rax1, ('Squared', 'Cubed', 'Fourth Power'), (True, True, True))

# Create the second checkbox for line style
rax2 = plt.axes([0.05, 0.2, 0.1, 0.15])
check2 = CheckButtons(rax2, ('Solid', 'Dashed', 'Dotted'), (True, False, False))

def func1(label):
    if label == 'Squared':
        line1.set_visible(not line1.get_visible())
    elif label == 'Cubed':
        line2.set_visible(not line2.get_visible())
    elif label == 'Fourth Power':
        line3.set_visible(not line3.get_visible())
    plt.draw()

def func2(label):
    if label == 'Solid':
        for line in [line1, line2, line3]:
            line.set_linestyle('-')
    elif label == 'Dashed':
        for line in [line1, line2, line3]:
            line.set_linestyle('--')
    elif label == 'Dotted':
        for line in [line1, line2, line3]:
            line.set_linestyle(':')
    plt.draw()

check1.on_clicked(func1)
check2.on_clicked(func2)

plt.show()
Output:
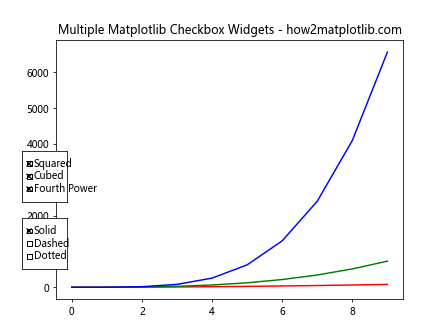
In this example, we create two separate Matplotlib Checkbox Widgets. The first widget controls the visibility of each line, while the second widget controls the line style for all lines. This demonstrates how you can use multiple checkbox widgets to provide different types of controls in your visualization.
Integrating Matplotlib Checkbox Widget with Other Widgets
The Matplotlib Checkbox Widget can be combined with other widgets to create more complex and interactive visualizations. Let’s look at an example that combines a Checkbox Widget with a Slider Widget:
import matplotlib.pyplot as plt
from matplotlib.widgets import CheckButtons, Slider
import numpy as np

fig, ax = plt.subplots()
ax.set_title('Matplotlib Checkbox and Slider Widgets - how2matplotlib.com')

# Create some sample data
x = np.linspace(0, 10, 100)
y1 = np.sin(x)
y2 = np.cos(x)

# Plot the data
line1, = ax.plot(x, y1, label='Sine')
line2, = ax.plot(x, y2, label='Cosine')

# Create the checkbox
rax = plt.axes([0.05, 0.4, 0.1, 0.15])
check = CheckButtons(rax, ('Sine', 'Cosine'), (True, True))

# Create the slider
axfreq = plt.axes([0.25, 0.1, 0.65, 0.03])
freq_slider = Slider(axfreq, 'Frequency', 0.1, 3.0, valinit=1)

def update(val):
    freq = freq_slider.val
    line1.set_ydata(np.sin(freq * x))
    line2.set_ydata(np.cos(freq * x))
    fig.canvas.draw_idle()

def func(label):
    if label == 'Sine':
        line1.set_visible(not line1.get_visible())
    elif label == 'Cosine':
        line2.set_visible(not line2.get_visible())
    plt.draw()

freq_slider.on_changed(update)
check.on_clicked(func)

plt.show()
Output:
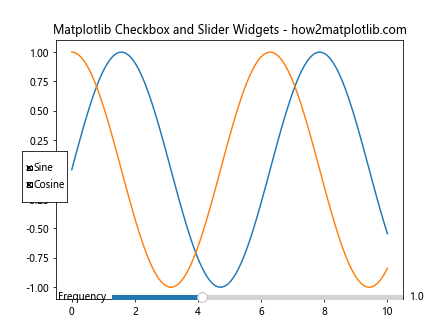
In this example, we combine a Matplotlib Checkbox Widget with a Slider Widget. The checkbox controls the visibility of the sine and cosine curves, while the slider adjusts the frequency of both curves. This combination allows users to not only toggle the visibility of each curve but also interactively modify their shape.
Using Matplotlib Checkbox Widget for Data Filtering
The Matplotlib Checkbox Widget can be particularly useful for filtering data in visualizations. Here’s an example that demonstrates how to use checkboxes to filter data points based on certain criteria:
import matplotlib.pyplot as plt
from matplotlib.widgets import CheckButtons
import numpy as np

fig, ax = plt.subplots()
ax.set_title('Data Filtering with Matplotlib Checkbox Widget - how2matplotlib.com')

# Create some sample data
np.random.seed(0)
x = np.random.rand(100)
y = np.random.rand(100)
colors = np.random.choice(['red', 'green', 'blue'], 100)

# Plot the data
scatter = ax.scatter(x, y, c=colors)

# Create the checkbox
rax = plt.axes([0.05, 0.4, 0.1, 0.15])
check = CheckButtons(rax, ('Red', 'Green', 'Blue'), (True, True, True))

def func(label):
    visible = check.get_status()
    facecolors = scatter.get_facecolors()
    for i, color in enumerate(['red', 'green', 'blue']):
        facecolors[colors == color, -1] = 1 if visible[i] else 0
    scatter.set_facecolors(facecolors)
    plt.draw()

check.on_clicked(func)

plt.show()
Output:
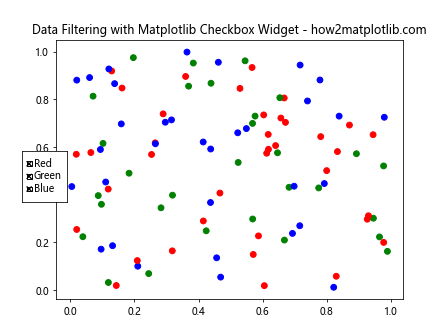
In this example, we create a scatter plot with points of different colors. The Matplotlib Checkbox Widget allows users to filter the data points based on their color. When a checkbox is unchecked, the corresponding color points become transparent, effectively filtering them out of the visualization.
Animating Matplotlib Checkbox Widget
You can also use the Matplotlib Checkbox Widget in animated plots. Here’s an example that demonstrates how to create an animated plot with a checkbox control:
import matplotlib.pyplot as plt
from matplotlib.widgets import CheckButtons
from matplotlib.animation import FuncAnimation
import numpy as np

fig, ax = plt.subplots()
ax.set_title('Animated Plot with Matplotlib Checkbox Widget - how2matplotlib.com')

# Create some sample data
x = np.linspace(0, 2 * np.pi, 100)
y1 = np.sin(x)
y2 = np.cos(x)

# Plot the data
line1, = ax.plot(x, y1, label='Sine')
line2, = ax.plot(x, y2, label='Cosine')

# Create the checkbox
rax = plt.axes([0.05, 0.4, 0.1, 0.15])
check = CheckButtons(rax, ('Sine', 'Cosine'), (True, True))

def update(frame):
    line1.set_ydata(np.sin(x + frame / 10))
    line2.set_ydata(np.cos(x + frame / 10))
    return line1, line2

def func(label):
    if label == 'Sine':
        line1.set_visible(not line1.get_visible())
    elif label == 'Cosine':
        line2.set_visible(not line2.get_visible())

check.on_clicked(func)

ani = FuncAnimation(fig, update, frames=100, interval=50, blit=True)

plt.show()
Output:
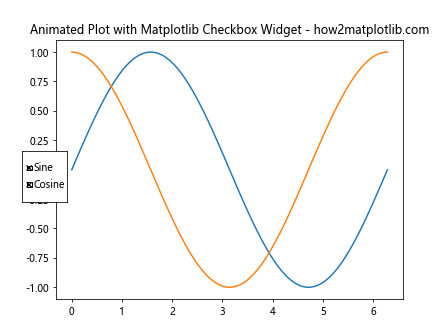
In this example, we create an animated plot where the sine and cosine curves move over time. The Matplotlib Checkbox Widget allows users to toggle the visibility of each curve during the animation.
Matplotlib Checkbox Widget for Subplot Control
The Matplotlib Checkbox Widget can be used to control the visibility of entire subplots. Here’s an example that demonstrates this functionality:
import matplotlib.pyplot as plt
from matplotlib.widgets import CheckButtons
import numpy as np

fig, (ax1, ax2, ax3) = plt.subplots(3, 1, figsize=(8, 10))
fig.suptitle('Subplot Control with Matplotlib Checkbox Widget - how2matplotlib.com')

# Create some sample data
x = np.linspace(0, 10, 100)
y1 = np.sin(x)
y2 = np.cos(x)
y3 = np.tan(x)

# Plot the data
ax1.plot(x, y1)
ax1.set_title('Sine')
ax2.plot(x, y2)
ax2.set_title('Cosine')
ax3.plot(x, y3)
ax3.set_title('Tangent')

# Create the checkbox
rax = plt.axes([0.05, 0.5, 0.1, 0.15])
check = CheckButtons(rax, ('Sine', 'Cosine', 'Tangent'), (True, True, True))

def func(label):
    if label == 'Sine':
        ax1.set_visible(not ax1.get_visible())
    elif label == 'Cosine':
        ax2.set_visible(not ax2.get_visible())
    elif label == 'Tangent':
        ax3.set_visible(not ax3.get_visible())
    plt.draw()

check.on_clicked(func)

plt.show()
Output:
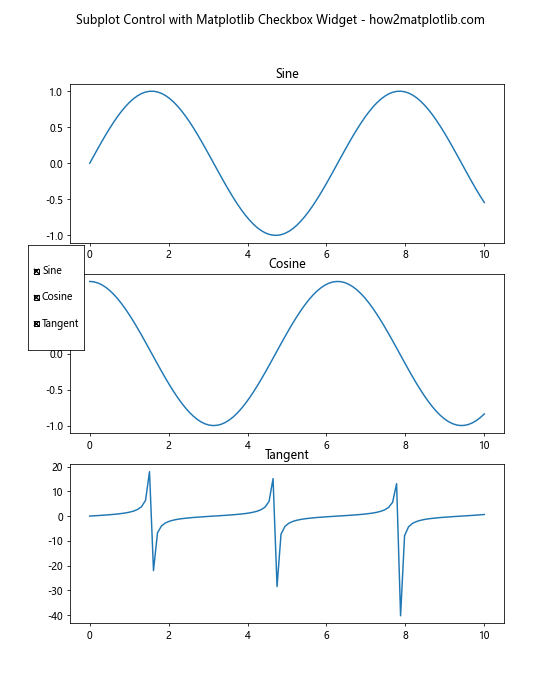
In this example, we create three subplots, each containing a different trigonometric function. The Matplotlib Checkbox Widget allows users to toggle the visibility of each subplot, providing a way to focus on specific parts of the visualization.
Using Matplotlib Checkbox Widget for Style Control
The Matplotlib Checkbox Widget can be used to control various style elements of a plot. Here’s an example that demonstrates how to use checkboxes to toggle different plot styles:
import matplotlib.pyplot as plt
from matplotlib.widgets import CheckButtons
import numpy as np

fig, ax = plt.subplots()
ax.set_title('Style Control with Matplotlib Checkbox Widget - how2matplotlib.com')

# Create some sample data
x = np.linspace(0, 10, 100)
y = np.sin(x)

# Plot the data
line, = ax.plot(x, y)

# Create the checkbox
rax = plt.axes([0.05, 0.4, 0.2, 0.15])
check = CheckButtons(rax, ('Grid', 'Markers', 'Fill'), (False, False, False))

def func(label):
    if label == 'Grid':
        ax.grid(not ax.get_xgridlines()[0].get_visible())
    elif label == 'Markers':
        if line.get_marker() == 'None':
            line.set_marker('o')
        else:
            line.set_marker('None')
    elif label == 'Fill':
        if line.get_fillstyle() == 'none':
            line.set_fillstyle('full')
        else:
            line.set_fillstyle('none')
    plt.draw()

check.on_clicked(func)

plt.show()
Output:
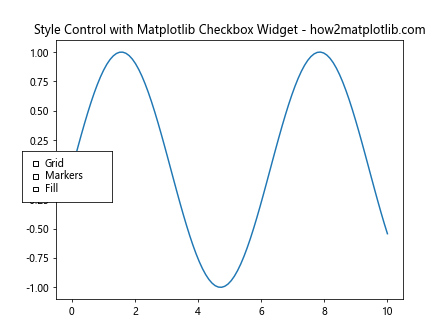
In this example, we create a simple sine wave plot and use a Matplotlib Checkbox Widget to control various style elements. The checkboxes allow users to toggle the grid, add or remove markers, and change the fill style of the markers.
Matplotlib Checkbox Widget for Color Control
The Matplotlib Checkbox Widget can also be used to control the colors of plot elements. Here’s an example that demonstrates how to use checkboxes to change the colors of lines in a plot:
import matplotlib.pyplot as plt
from matplotlib.widgets import CheckButtons
import numpy as np

fig, ax = plt.subplots()
ax.set_title('Color Control with Matplotlib Checkbox Widget - how2matplotlib.com')

# Create some sample data
x = np.linspace(0, 10, 100)
y = np.sin(x)

# Plot the data
line, = ax.plot(x, y, 'k-')

# Create the checkbox
rax = plt.axes([0.05, 0.4, 0.2, 0.15])
check = CheckButtons(rax, ('Red', 'Green', 'Blue'), (False, False, False))

def func(label):
    if label == 'Red':
        if 'r' in line.get_color():
            line.set_color(line.get_color().replace('r', ''))
        else:
            line.set_color(line.get_color() + 'r')
    elif label == 'Green':
        if 'g' in line.get_color():
            line.set_color(line.get_color().replace('g', ''))
        else:
            line.set_color(line.get_color() + 'g')
    elif label == 'Blue':
        if 'b' in line.get_color():
            line.set_color(line.get_color().replace('b', ''))
        else:
            line.set_color(line.get_color() + 'b')
    plt.draw()

check.on_clicked(func)

plt.show()
Output:
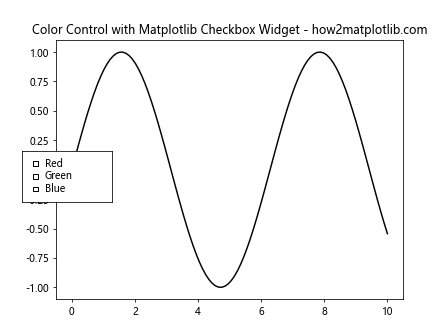
In this example, we create a simple sine wave plot and use a Matplotlib Checkbox Widget to control its color. The checkboxes allow users to add or remove red, green, and blue components to the line color, effectively creating a color mixer.
Conclusion
The Matplotlib Checkbox Widget is a versatile tool that can significantly enhance the interactivity of your visualizations. Throughout this article, we’ve explored various ways to implement and customize the Matplotlib Checkbox Widget, from basic usage to more advanced applications.
We’ve seen how the Matplotlib Checkbox Widget can be used for:
- Toggling the visibility of plot elements
- Filtering data points
- Controlling animated plots
- Managing legend visibility
- Controlling subplots
- Adjusting plot styles
- Comparing datasets
- Mixing colors
By incorporating the Matplotlib Checkbox Widget into your visualizations, you can create more engaging and interactive plots that allow users to explore data in new ways. Whether you’re creating simple toggle controls or complex data filtering mechanisms, the Matplotlib Checkbox Widget provides a flexible and powerful tool for enhancing your data visualizations.