Comprehensive Guide to Matplotlib.axis.Axis.get_clip_box() Function in Python
Matplotlib.axis.Axis.get_clip_box() function in Python is an essential tool for managing the clipping boundaries of axis objects in Matplotlib plots. This function allows developers to retrieve the current clipping box associated with an axis, providing valuable information about the visible area of the plot. In this comprehensive guide, we’ll explore the Matplotlib.axis.Axis.get_clip_box() function in detail, covering its usage, parameters, return values, and practical applications in various plotting scenarios.
Understanding the Basics of Matplotlib.axis.Axis.get_clip_box()
Matplotlib.axis.Axis.get_clip_box() function in Python is a method of the Axis class in Matplotlib’s axis module. Its primary purpose is to return the current clipping box for the axis. The clipping box defines the region within which the axis and its associated elements are visible. This function is particularly useful when you need to inspect or manipulate the clipping boundaries of your plots.
Let’s start with a simple example to demonstrate how to use the Matplotlib.axis.Axis.get_clip_box() function:
import matplotlib.pyplot as plt

# Create a figure and axis
fig, ax = plt.subplots()

# Plot some data
ax.plot([1, 2, 3, 4], [1, 4, 2, 3], label='Data from how2matplotlib.com')

# Get the clip box of the x-axis
clip_box = ax.xaxis.get_clip_box()

# Print the clip box information
print(f"Clip box: {clip_box}")

plt.legend()
plt.title('Using Matplotlib.axis.Axis.get_clip_box()')
plt.show()
Output:
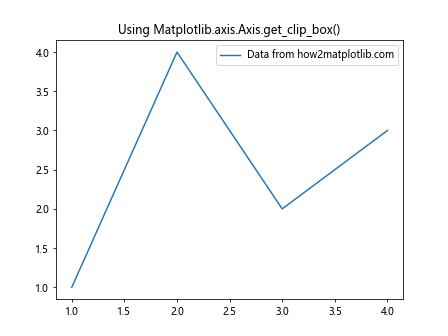
In this example, we create a simple line plot and then use the Matplotlib.axis.Axis.get_clip_box() function to retrieve the clipping box of the x-axis. The function returns a Bbox object, which represents the bounding box of the clipping region.
Exploring the Return Value of Matplotlib.axis.Axis.get_clip_box()
The Matplotlib.axis.Axis.get_clip_box() function returns a Bbox object, which is a subclass of the BboxBase class in Matplotlib. This Bbox object represents a rectangular bounding box defined by two points: the lower-left corner and the upper-right corner.
Let’s examine the properties of the returned Bbox object:
import matplotlib.pyplot as plt

fig, ax = plt.subplots()
ax.plot([1, 2, 3, 4], [1, 4, 2, 3], label='Data from how2matplotlib.com')

clip_box = ax.xaxis.get_clip_box()

print(f"Clip box bounds: {clip_box.bounds}")
print(f"Clip box x0: {clip_box.x0}")
print(f"Clip box y0: {clip_box.y0}")
print(f"Clip box x1: {clip_box.x1}")
print(f"Clip box y1: {clip_box.y1}")
print(f"Clip box width: {clip_box.width}")
print(f"Clip box height: {clip_box.height}")

plt.legend()
plt.title('Exploring Matplotlib.axis.Axis.get_clip_box() Return Value')
plt.show()
Output:
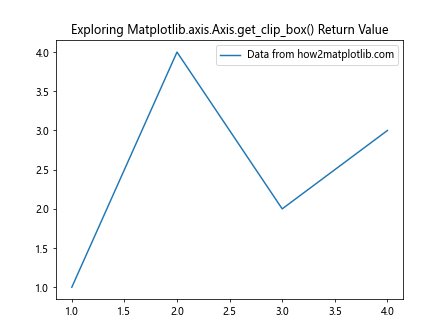
This example demonstrates how to access various properties of the Bbox object returned by Matplotlib.axis.Axis.get_clip_box(). The bounds property provides a tuple containing the x0, y0, width, and height of the bounding box. You can also access individual coordinates (x0, y0, x1, y1) and dimensions (width, height) directly.
Using Matplotlib.axis.Axis.get_clip_box() with Different Axis Types
The Matplotlib.axis.Axis.get_clip_box() function can be used with different types of axes in Matplotlib, including x-axis, y-axis, and even 3D axes. Let’s explore how to use this function with various axis types:
X-Axis Example
import matplotlib.pyplot as plt

fig, ax = plt.subplots()
ax.plot([1, 2, 3, 4], [1, 4, 2, 3], label='Data from how2matplotlib.com')

x_clip_box = ax.xaxis.get_clip_box()
print(f"X-axis clip box: {x_clip_box}")

plt.legend()
plt.title('Matplotlib.axis.Axis.get_clip_box() with X-Axis')
plt.show()
Output:

In this example, we use Matplotlib.axis.Axis.get_clip_box() to retrieve the clipping box of the x-axis.
Y-Axis Example
import matplotlib.pyplot as plt

fig, ax = plt.subplots()
ax.plot([1, 2, 3, 4], [1, 4, 2, 3], label='Data from how2matplotlib.com')

y_clip_box = ax.yaxis.get_clip_box()
print(f"Y-axis clip box: {y_clip_box}")

plt.legend()
plt.title('Matplotlib.axis.Axis.get_clip_box() with Y-Axis')
plt.show()
Output:
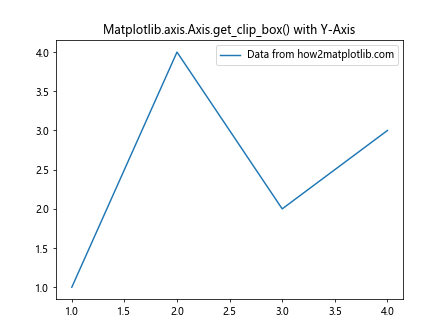
Here, we demonstrate how to use Matplotlib.axis.Axis.get_clip_box() with the y-axis.
3D Axis Example
import matplotlib.pyplot as plt
from mpl_toolkits.mplot3d import Axes3D

fig = plt.figure()
ax = fig.add_subplot(111, projection='3d')

ax.plot([1, 2, 3], [1, 2, 3], [1, 2, 3], label='Data from how2matplotlib.com')

x_clip_box = ax.xaxis.get_clip_box()
y_clip_box = ax.yaxis.get_clip_box()
z_clip_box = ax.zaxis.get_clip_box()

print(f"X-axis clip box: {x_clip_box}")
print(f"Y-axis clip box: {y_clip_box}")
print(f"Z-axis clip box: {z_clip_box}")

plt.legend()
plt.title('Matplotlib.axis.Axis.get_clip_box() with 3D Axes')
plt.show()
Output:
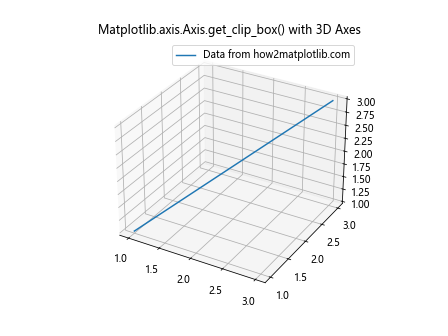
This example shows how to use Matplotlib.axis.Axis.get_clip_box() with 3D axes, retrieving the clipping boxes for all three axes.
Practical Applications of Matplotlib.axis.Axis.get_clip_box()
Now that we understand the basics of Matplotlib.axis.Axis.get_clip_box(), let’s explore some practical applications of this function in various plotting scenarios.
1. Adjusting Plot Limits Based on Clip Box
One practical use of Matplotlib.axis.Axis.get_clip_box() is to adjust the plot limits based on the current clipping box. This can be useful when you want to ensure that your plot fits within a specific region:
import matplotlib.pyplot as plt

fig, ax = plt.subplots()
ax.plot([1, 2, 3, 4], [1, 4, 2, 3], label='Data from how2matplotlib.com')

clip_box = ax.xaxis.get_clip_box()
margin = 0.1  # Add a 10% margin

ax.set_xlim(clip_box.x0 - margin * clip_box.width,
            clip_box.x1 + margin * clip_box.width)
ax.set_ylim(clip_box.y0 - margin * clip_box.height,
            clip_box.y1 + margin * clip_box.height)

plt.legend()
plt.title('Adjusting Plot Limits with Matplotlib.axis.Axis.get_clip_box()')
plt.show()
Output:
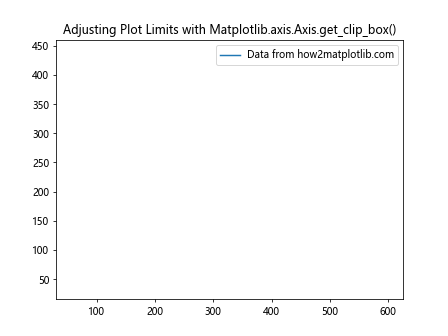
In this example, we use the clip box information to set new limits for the plot, adding a small margin around the original clipping region.
2. Creating Custom Clipping Masks
Matplotlib.axis.Axis.get_clip_box() can be used to create custom clipping masks for your plots. This is particularly useful when you want to show only a specific portion of your data:
import matplotlib.pyplot as plt
import numpy as np
from matplotlib.patches import Rectangle

fig, ax = plt.subplots()

# Generate some data
x = np.linspace(0, 10, 100)
y = np.sin(x)

# Plot the data
ax.plot(x, y, label='Data from how2matplotlib.com')

# Get the clip box
clip_box = ax.xaxis.get_clip_box()

# Create a custom clipping region
custom_clip = Rectangle((clip_box.x0, clip_box.y0),
                        clip_box.width / 2, clip_box.height,
                        fill=False, edgecolor='red')
ax.add_patch(custom_clip)
ax.set_clip_path(custom_clip)

plt.legend()
plt.title('Custom Clipping with Matplotlib.axis.Axis.get_clip_box()')
plt.show()
Output:
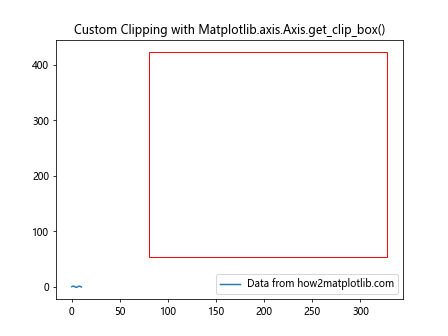
This example demonstrates how to create a custom clipping mask using the information from Matplotlib.axis.Axis.get_clip_box(). We create a rectangle that covers only half of the plot and use it as a clipping path.
3. Aligning Multiple Subplots
Matplotlib.axis.Axis.get_clip_box() can be helpful when aligning multiple subplots. By comparing the clip boxes of different axes, you can ensure that your subplots are properly aligned:
import matplotlib.pyplot as plt

fig, (ax1, ax2) = plt.subplots(2, 1, figsize=(8, 6))

ax1.plot([1, 2, 3, 4], [1, 4, 2, 3], label='Data 1 from how2matplotlib.com')
ax2.plot([1, 2, 3, 4], [3, 1, 4, 2], label='Data 2 from how2matplotlib.com')

clip_box1 = ax1.xaxis.get_clip_box()
clip_box2 = ax2.xaxis.get_clip_box()

# Align the x-axes
ax2.set_xlim(clip_box1.x0, clip_box1.x1)

# Adjust the height of the second subplot
height_ratio = clip_box1.height / clip_box2.height
fig.set_figheight(fig.get_figheight() * (1 + height_ratio) / 2)

plt.legend()
plt.suptitle('Aligning Subplots with Matplotlib.axis.Axis.get_clip_box()')
plt.tight_layout()
plt.show()
Output:
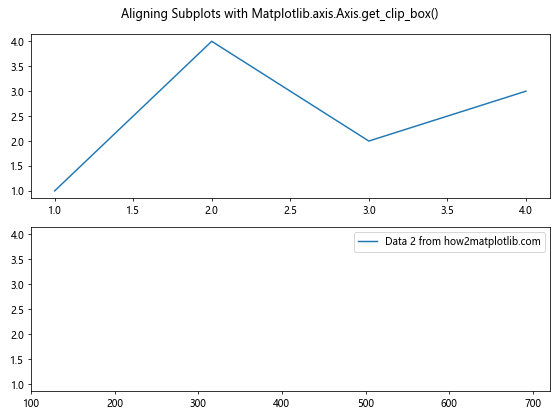
In this example, we use Matplotlib.axis.Axis.get_clip_box() to align the x-axes of two subplots and adjust the height of the second subplot to match the first one.
Advanced Techniques with Matplotlib.axis.Axis.get_clip_box()
Now that we’ve covered the basics and some practical applications, let’s explore some advanced techniques using Matplotlib.axis.Axis.get_clip_box().
1. Dynamic Axis Scaling
You can use Matplotlib.axis.Axis.get_clip_box() to implement dynamic axis scaling based on the current view:
import matplotlib.pyplot as plt
import numpy as np

fig, ax = plt.subplots()

x = np.linspace(0, 10, 100)
y = np.sin(x)

line, = ax.plot(x, y, label='Data from how2matplotlib.com')

def update_limits(event):
    if event.inaxes == ax:
        clip_box = ax.xaxis.get_clip_box()
        visible_x = np.logical_and(x >= clip_box.x0, x <= clip_box.x1)
        visible_y = y[visible_x]
        ax.set_ylim(np.min(visible_y) - 0.1, np.max(visible_y) + 0.1)
        fig.canvas.draw_idle()

fig.canvas.mpl_connect('motion_notify_event', update_limits)

plt.legend()
plt.title('Dynamic Axis Scaling with Matplotlib.axis.Axis.get_clip_box()')
plt.show()
Output:
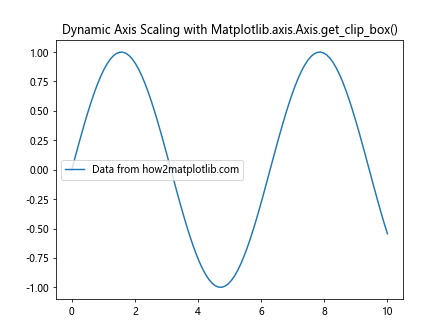
This example demonstrates how to use Matplotlib.axis.Axis.get_clip_box() to dynamically update the y-axis limits based on the visible portion of the x-axis.
2. Custom Axis Positioning
Matplotlib.axis.Axis.get_clip_box() can be used to create custom axis positioning:
import matplotlib.pyplot as plt
import numpy as np

fig, ax = plt.subplots()

x = np.linspace(0, 10, 100)
y = np.sin(x)

ax.plot(x, y, label='Data from how2matplotlib.com')

clip_box = ax.xaxis.get_clip_box()

# Create a custom x-axis at the top of the plot
custom_xaxis = ax.twiny()
custom_xaxis.set_xlim(ax.get_xlim())
custom_xaxis.spines['top'].set_position(('axes', 1.05))

# Create a custom y-axis on the right side of the plot
custom_yaxis = ax.twinx()
custom_yaxis.set_ylim(ax.get_ylim())
custom_yaxis.spines['right'].set_position(('axes', 1.05))

plt.legend()
plt.title('Custom Axis Positioning with Matplotlib.axis.Axis.get_clip_box()')
plt.tight_layout()
plt.show()
In this example, we use Matplotlib.axis.Axis.get_clip_box() to help position custom axes outside the main plot area.
3. Adaptive Tick Spacing
Matplotlib.axis.Axis.get_clip_box() can be used to implement adaptive tick spacing based on the visible area of the plot:
import matplotlib.pyplot as plt
import numpy as np

fig, ax = plt.subplots()

x = np.linspace(0, 100, 1000)
y = np.sin(x)

ax.plot(x, y, label='Data from how2matplotlib.com')

def update_ticks(event):
    if event.inaxes == ax:
        clip_box = ax.xaxis.get_clip_box()
        visible_range = clip_box.x1 - clip_box.x0

        if visible_range < 10:
            ax.xaxis.set_major_locator(plt.MultipleLocator(1))
        elif visible_range < 50:
            ax.xaxis.set_major_locator(plt.MultipleLocator(5))
        else:
            ax.xaxis.set_major_locator(plt.MultipleLocator(10))

        fig.canvas.draw_idle()

fig.canvas.mpl_connect('motion_notify_event', update_ticks)

plt.legend()
plt.title('Adaptive Tick Spacing with Matplotlib.axis.Axis.get_clip_box()')
plt.show()
Output:
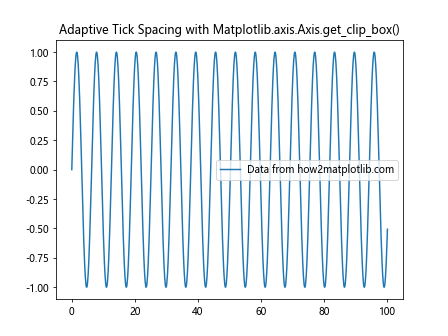
This example demonstrates how to use Matplotlib.axis.Axis.get_clip_box() to implement adaptive tick spacing based on the visible range of the x-axis.
Best Practices for Using Matplotlib.axis.Axis.get_clip_box()
When working with Matplotlib.axis.Axis.get_clip_box(), it's important to follow some best practices to ensure optimal performance and maintainability of your code:
- Cache clip box values: If you're using Matplotlib.axis.Axis.get_clip_box() frequently in your code, consider caching the clip box values to avoid unnecessary function calls.
Handle None values: In some cases, Matplotlib.axis.Axis.get_clip_box() may return None. Always check for None values before accessing properties of the returned Bbox object.
Use with tight_layout: When adjustingplot limits or positioning based on clip box values, consider using plt.tight_layout() to ensure proper spacing between subplots and axes.
Combine with other Matplotlib functions: Matplotlib.axis.Axis.get_clip_box() works well in combination with other Matplotlib functions like set_xlim(), set_ylim(), and set_position(). Use these functions together for more precise control over your plots.
Be aware of units: The values returned by Matplotlib.axis.Axis.get_clip_box() are in display coordinates. If you're working with data coordinates, you may need to convert between the two using ax.transData.transform() and ax.transData.inverted().transform().
Let's look at an example that demonstrates these best practices: