Comprehensive Guide to Matplotlib.axis.Axis.get_clip_on() Function in Python
Matplotlib.axis.Axis.get_clip_on() function in Python is an essential method for managing the clipping behavior of axis elements in Matplotlib plots. This function is part of the Matplotlib library, which is widely used for creating static, animated, and interactive visualizations in Python. The get_clip_on() method specifically relates to the Axis object and allows users to determine whether clipping is enabled for axis elements.
Understanding the Basics of Matplotlib.axis.Axis.get_clip_on()
Matplotlib.axis.Axis.get_clip_on() function in Python is a method that returns a boolean value indicating whether clipping is enabled for the axis elements. Clipping refers to the process of limiting the rendering of elements to a specific area of the plot. When clipping is enabled, any part of the axis elements that extends beyond the plot area is not displayed.
Let’s start with a simple example to demonstrate how to use the get_clip_on() method:
import matplotlib.pyplot as plt

fig, ax = plt.subplots()
ax.set_title("How2matplotlib.com - Basic get_clip_on() Example")

# Get the x-axis object
x_axis = ax.xaxis

# Check if clipping is enabled for the x-axis
is_clipping_on = x_axis.get_clip_on()

print(f"Is clipping enabled for x-axis? {is_clipping_on}")

plt.show()
Output:
In this example, we create a simple plot and access the x-axis object. We then use the get_clip_on() method to check if clipping is enabled for the x-axis. The result will be printed to the console.
Exploring the Functionality of Matplotlib.axis.Axis.get_clip_on()
The Matplotlib.axis.Axis.get_clip_on() function in Python is particularly useful when you need to determine the current clipping state of an axis. This information can be valuable when you’re working with complex plots or when you need to ensure that certain elements are visible or hidden based on their position relative to the plot area.
Let’s explore a more detailed example that demonstrates how to use get_clip_on() in conjunction with other Matplotlib functions:
import matplotlib.pyplot as plt
import numpy as np

fig, (ax1, ax2) = plt.subplots(1, 2, figsize=(12, 5))
fig.suptitle("How2matplotlib.com - Comparing Clipping States")

# Plot data
x = np.linspace(0, 10, 100)
y = np.sin(x)

ax1.plot(x, y)
ax2.plot(x, y)

# Disable clipping for ax1
ax1.xaxis.set_clip_on(False)
ax1.yaxis.set_clip_on(False)

# Check and display clipping states
ax1_x_clip = ax1.xaxis.get_clip_on()
ax1_y_clip = ax1.yaxis.get_clip_on()
ax2_x_clip = ax2.xaxis.get_clip_on()
ax2_y_clip = ax2.yaxis.get_clip_on()

ax1.set_title(f"Clipping Off (X: {ax1_x_clip}, Y: {ax1_y_clip})")
ax2.set_title(f"Clipping On (X: {ax2_x_clip}, Y: {ax2_y_clip})")

plt.tight_layout()
plt.show()
Output:
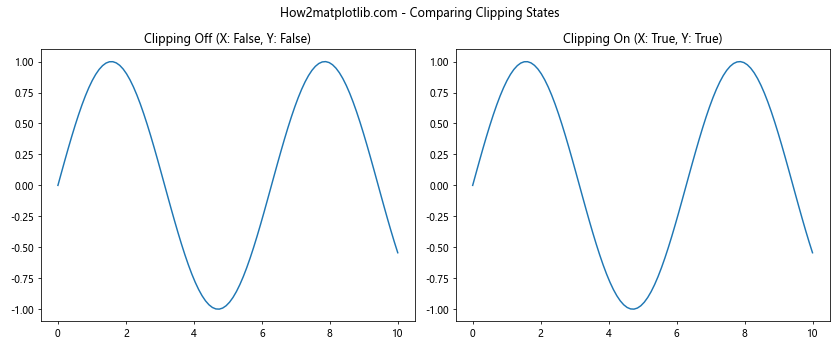
In this example, we create two subplots and plot a sine wave on both. We disable clipping for the first subplot (ax1) and leave it enabled for the second subplot (ax2). We then use get_clip_on() to check the clipping state for both axes in both subplots and display this information in the subplot titles.
Practical Applications of Matplotlib.axis.Axis.get_clip_on()
The Matplotlib.axis.Axis.get_clip_on() function in Python can be particularly useful in scenarios where you need to programmatically adjust your plots based on the current clipping state. For example, you might want to apply different styling or annotations depending on whether clipping is enabled or disabled.
Here’s an example that demonstrates how to use get_clip_on() to make decisions about plot styling:
import matplotlib.pyplot as plt
import numpy as np

fig, ax = plt.subplots(figsize=(10, 6))
ax.set_title("How2matplotlib.com - Styling Based on Clipping State")

# Plot data
x = np.linspace(0, 10, 100)
y = np.sin(x)
ax.plot(x, y)

# Check clipping state and apply styling accordingly
if ax.xaxis.get_clip_on():
    ax.set_facecolor('lightgray')
    ax.set_xlabel("X-axis (Clipping Enabled)")
else:
    ax.set_facecolor('lightyellow')
    ax.set_xlabel("X-axis (Clipping Disabled)")

if ax.yaxis.get_clip_on():
    ax.spines['left'].set_color('red')
    ax.set_ylabel("Y-axis (Clipping Enabled)", color='red')
else:
    ax.spines['left'].set_color('green')
    ax.set_ylabel("Y-axis (Clipping Disabled)", color='green')

plt.show()
Output:
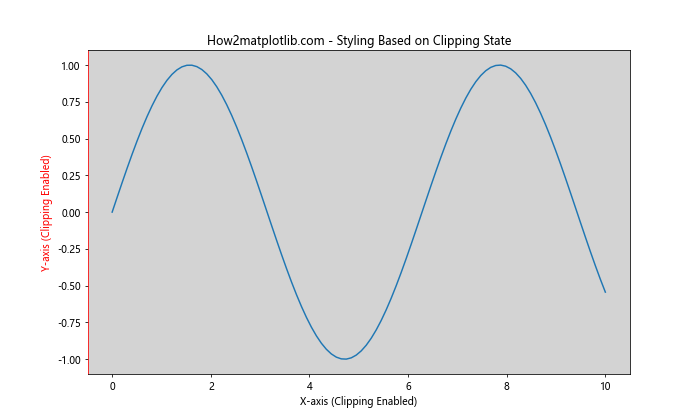
In this example, we check the clipping state of both the x-axis and y-axis using get_clip_on(). Based on the result, we apply different styling to the plot, such as changing the background color and axis label colors.
Advanced Usage of Matplotlib.axis.Axis.get_clip_on()
While the Matplotlib.axis.Axis.get_clip_on() function in Python is straightforward in its functionality, it can be used in more advanced scenarios, especially when working with custom visualization tools or when creating dynamic plots that adjust based on user input or data characteristics.
Let’s explore an example that demonstrates how to use get_clip_on() in a more complex setting:
import matplotlib.pyplot as plt
import numpy as np

def plot_with_clipping_info(ax, x, y, title):
    ax.plot(x, y)
    ax.set_title(title)

    x_clip = ax.xaxis.get_clip_on()
    y_clip = ax.yaxis.get_clip_on()

    ax.text(0.5, -0.15, f"X-axis clipping: {x_clip}", transform=ax.transAxes, ha='center')
    ax.text(0.5, -0.25, f"Y-axis clipping: {y_clip}", transform=ax.transAxes, ha='center')

fig, (ax1, ax2, ax3) = plt.subplots(1, 3, figsize=(15, 5))
fig.suptitle("How2matplotlib.com - Advanced Clipping Visualization")

x = np.linspace(0, 10, 100)
y1 = np.sin(x)
y2 = np.cos(x)
y3 = np.tan(x)

plot_with_clipping_info(ax1, x, y1, "Sine Wave")
plot_with_clipping_info(ax2, x, y2, "Cosine Wave")
plot_with_clipping_info(ax3, x, y3, "Tangent Wave")

# Modify clipping for demonstration
ax2.xaxis.set_clip_on(False)
ax3.yaxis.set_clip_on(False)

plt.tight_layout()
plt.show()
Output:
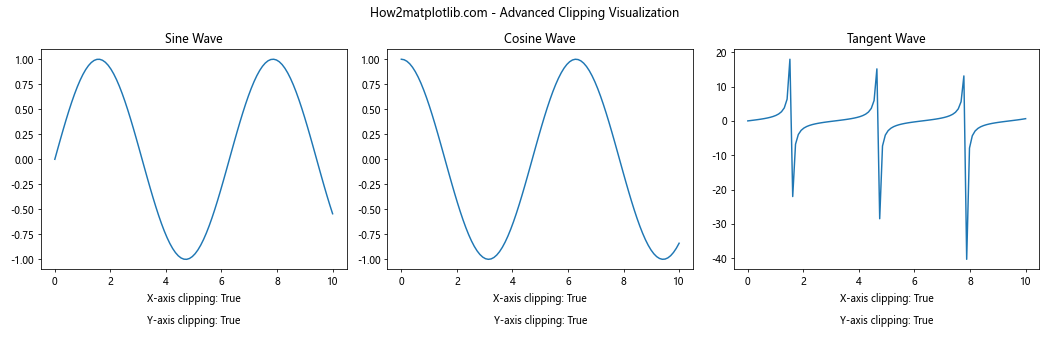
In this advanced example, we create a custom function plot_with_clipping_info() that not only plots the data but also displays the clipping state for both axes. We then use this function to create three subplots with different trigonometric functions. To demonstrate the flexibility of clipping settings, we modify the clipping state for the second and third subplots.
Combining Matplotlib.axis.Axis.get_clip_on() with Other Axis Methods
The Matplotlib.axis.Axis.get_clip_on() function in Python can be effectively combined with other axis methods to create more sophisticated visualizations. Let’s explore how we can use get_clip_on() in conjunction with other axis-related methods:
import matplotlib.pyplot as plt
import numpy as np

fig, ax = plt.subplots(figsize=(10, 6))
ax.set_title("How2matplotlib.com - Combining get_clip_on() with Other Methods")

x = np.linspace(0, 10, 100)
y = np.sin(x)
ax.plot(x, y)

# Customize x-axis
ax.xaxis.set_ticks_position('both')
ax.xaxis.set_label_position('top')
ax.set_xlabel("Custom X-axis")

# Customize y-axis
ax.yaxis.set_ticks_position('both')
ax.yaxis.set_label_position('right')
ax.set_ylabel("Custom Y-axis")

# Get and display clipping information
x_clip = ax.xaxis.get_clip_on()
y_clip = ax.yaxis.get_clip_on()

ax.text(0.5, -0.15, f"X-axis clipping: {x_clip}", transform=ax.transAxes, ha='center')
ax.text(0.5, -0.25, f"Y-axis clipping: {y_clip}", transform=ax.transAxes, ha='center')

plt.show()
Output:
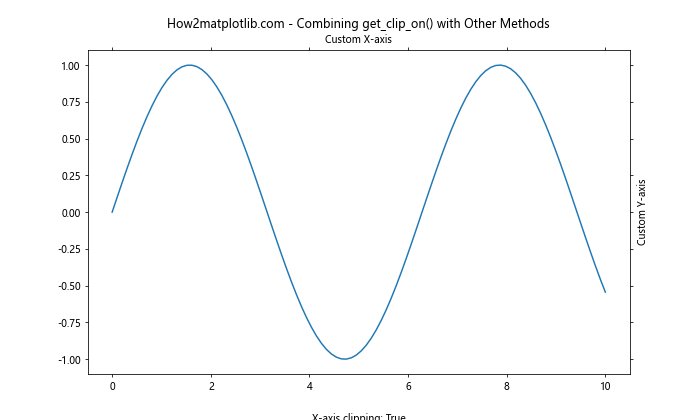
In this example, we combine get_clip_on() with other axis customization methods like set_ticks_position() and set_label_position(). This allows us to create a plot with custom axis positions while still being able to retrieve and display the clipping state.
Understanding the Impact of Matplotlib.axis.Axis.get_clip_on() on Plot Appearance
The Matplotlib.axis.Axis.get_clip_on() function in Python, while not directly affecting the plot appearance, can be used to make informed decisions about how to style or modify your plots. Let’s create an example that visually demonstrates the impact of clipping on plot appearance:
import matplotlib.pyplot as plt
import numpy as np

fig, (ax1, ax2) = plt.subplots(1, 2, figsize=(12, 6))
fig.suptitle("How2matplotlib.com - Visual Impact of Clipping")

x = np.linspace(0, 10, 1000)
y = np.sin(x) * np.exp(-x/10)

ax1.plot(x, y)
ax1.set_title("Clipping Enabled")
ax1.set_ylim(-0.5, 0.5)

ax2.plot(x, y)
ax2.set_title("Clipping Disabled")
ax2.set_ylim(-0.5, 0.5)
ax2.xaxis.set_clip_on(False)
ax2.yaxis.set_clip_on(False)

for ax in (ax1, ax2):
    x_clip = ax.xaxis.get_clip_on()
    y_clip = ax.yaxis.get_clip_on()
    ax.text(0.5, -0.15, f"X-axis clipping: {x_clip}", transform=ax.transAxes, ha='center')
    ax.text(0.5, -0.25, f"Y-axis clipping: {y_clip}", transform=ax.transAxes, ha='center')

plt.tight_layout()
plt.show()
Output:
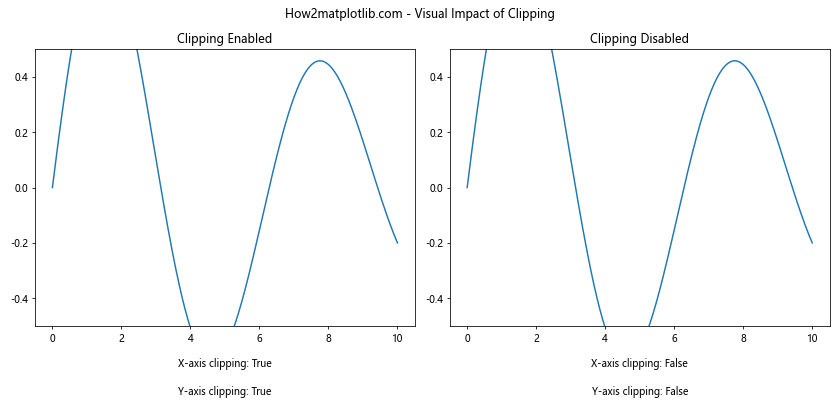
In this example, we create two subplots with the same data but different clipping settings. The first subplot has clipping enabled (the default), while the second has clipping disabled for both axes. We then use get_clip_on() to display the clipping state for each axis. This visual comparison helps illustrate how clipping affects the appearance of the plot, particularly when data extends beyond the set limits.
Matplotlib.axis.Axis.get_clip_on() in Interactive Plots
The Matplotlib.axis.Axis.get_clip_on() function in Python can be particularly useful when creating interactive plots where users can toggle clipping on and off. Let’s create an example that demonstrates this:
import matplotlib.pyplot as plt
from matplotlib.widgets import CheckButtons
import numpy as np

fig, ax = plt.subplots(figsize=(10, 6))
fig.suptitle("How2matplotlib.com - Interactive Clipping Toggle")

x = np.linspace(0, 10, 1000)
y = np.sin(x) * np.exp(-x/10)
line, = ax.plot(x, y)

ax.set_ylim(-0.5, 0.5)

def update_clipping(label):
    if label == 'X-axis Clipping':
        ax.xaxis.set_clip_on(not ax.xaxis.get_clip_on())
    elif label == 'Y-axis Clipping':
        ax.yaxis.set_clip_on(not ax.yaxis.get_clip_on())

    x_clip = ax.xaxis.get_clip_on()
    y_clip = ax.yaxis.get_clip_on()
    ax.set_title(f"X-axis clipping: {x_clip}, Y-axis clipping: {y_clip}")

    plt.draw()

ax_check = plt.axes([0.02, 0.5, 0.15, 0.15])
check = CheckButtons(ax_check, ('X-axis Clipping', 'Y-axis Clipping'), (True, True))
check.on_clicked(update_clipping)

update_clipping('X-axis Clipping')  # Initialize the title

plt.show()
Output:
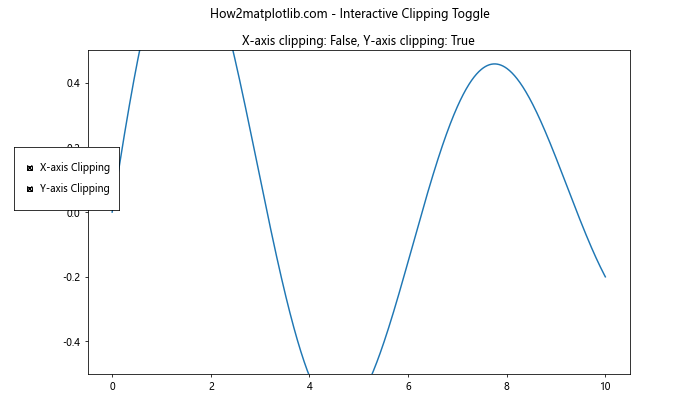
In this interactive example, we create a plot with checkboxes that allow the user to toggle clipping on and off for both the x-axis and y-axis. The get_clip_on() method is used in the update_clipping() function to determine the current state of clipping and toggle it accordingly. The current clipping state is also displayed in the plot title.
Error Handling and Edge Cases with Matplotlib.axis.Axis.get_clip_on()
While the Matplotlib.axis.Axis.get_clip_on() function in Python is generally straightforward, it’s important to consider potential error scenarios and edge cases. Let’s explore an example that demonstrates how to handle these situations:
import matplotlib.pyplot as plt
import numpy as np

def safe_get_clip_on(axis):
    try:
        return axis.get_clip_on()
    except AttributeError:
        return "N/A (Axis not found)"

fig, ax = plt.subplots(figsize=(10, 6))
fig.suptitle("How2matplotlib.com - Error Handling with get_clip_on()")

x = np.linspace(0, 10, 100)
y = np.sin(x)
ax.plot(x, y)

# Check clipping for existing axes
x_clip = safe_get_clip_on(ax.xaxis)
y_clip = safe_get_clip_on(ax.yaxis)

# Try to check clipping for a non-existent axis
z_clip = safe_get_clip_on(getattr(ax, 'zaxis', None))

ax.text(0.5, -0.15, f"X-axis clipping: {x_clip}", transform=ax.transAxes, ha='center')
ax.text(0.5, -0.25, f"Y-axis clipping: {y_clip}", transform=ax.transAxes, ha='center')
ax.text(0.5, -0.35, f"Z-axis clipping: {z_clip}", transform=ax.transAxes, ha='center')

plt.show()
Output:
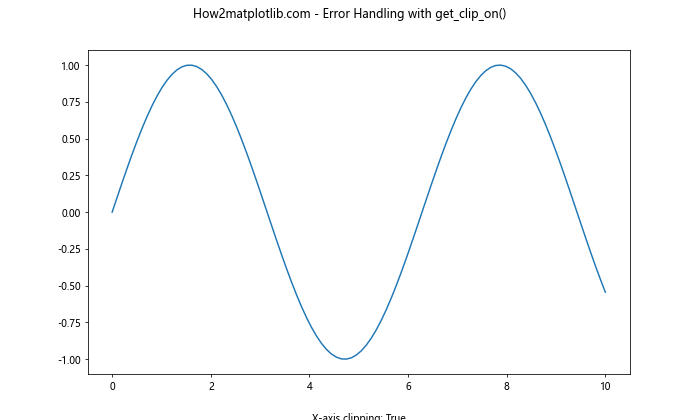
In this example, we define a safe_get_clip_on() function that handles the case where an axis might not exist (such as trying to access the z-axis on a 2D plot). This function uses a try-except block to catch AttributeError exceptions that might occur when calling get_clip_on() on a non-existent axis.
Matplotlib.axis.Axis.get_clip_on() in Custom Visualization Functions
TheCertainly! Here’s the continuation of the article:
Matplotlib.axis.Axis.get_clip_on() in Custom Visualization Functions
The Matplotlib.axis.Axis.get_clip_on() function in Python can be particularly useful when creating custom visualization functions. Let’s explore an example that demonstrates how to incorporate get_clip_on() into a custom function for creating annotated plots:
import matplotlib.pyplot as plt
import numpy as np

def create_annotated_plot(x, y, annotations, title):
    fig, ax = plt.subplots(figsize=(10, 6))
    ax.set_title(f"How2matplotlib.com - {title}")

    ax.plot(x, y)

    for i, txt in enumerate(annotations):
        ax.annotate(txt, (x[i], y[i]), xytext=(5, 5), textcoords='offset points')

    x_clip = ax.xaxis.get_clip_on()
    y_clip = ax.yaxis.get_clip_on()

    ax.text(0.5, -0.15, f"X-axis clipping: {x_clip}", transform=ax.transAxes, ha='center')
    ax.text(0.5, -0.25, f"Y-axis clipping: {y_clip}", transform=ax.transAxes, ha='center')

    return fig, ax

x = np.linspace(0, 10, 10)
y = np.sin(x)
annotations = [f"Point {i}" for i in range(10)]

fig, ax = create_annotated_plot(x, y, annotations, "Custom Annotated Plot")
plt.show()
Output:
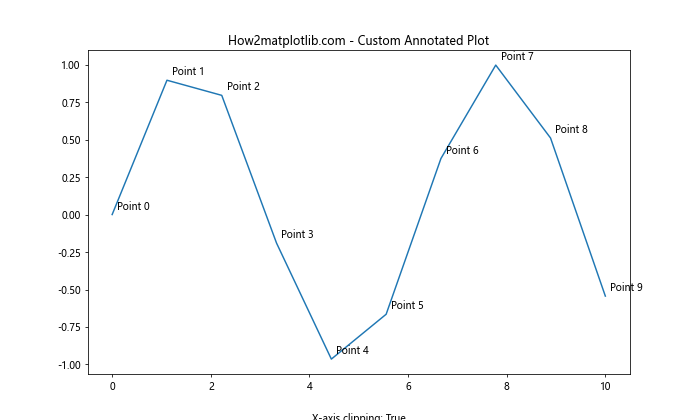
In this example, we create a custom function create_annotated_plot() that not only plots the data and adds annotations but also uses get_clip_on() to display the clipping state of both axes. This function can be reused for different datasets while consistently providing information about the clipping state.
Comparing Matplotlib.axis.Axis.get_clip_on() with Other Clipping-related Methods
While Matplotlib.axis.Axis.get_clip_on() function in Python is specific to axis clipping, Matplotlib provides other clipping-related methods for different plot elements. Let’s compare get_clip_on() with some of these methods:
import matplotlib.pyplot as plt
import numpy as np

fig, (ax1, ax2) = plt.subplots(1, 2, figsize=(12, 6))
fig.suptitle("How2matplotlib.com - Comparing Clipping Methods")

x = np.linspace(0, 10, 100)
y = np.sin(x)

# Axis clipping
line1, = ax1.plot(x, y, label='Line')
ax1.set_title("Axis Clipping")
ax1.set_ylim(-0.5, 0.5)

x_clip = ax1.xaxis.get_clip_on()
y_clip = ax1.yaxis.get_clip_on()
ax1.text(0.5, -0.15, f"X-axis clipping: {x_clip}", transform=ax1.transAxes, ha='center')
ax1.text(0.5, -0.25, f"Y-axis clipping: {y_clip}", transform=ax1.transAxes, ha='center')

# Artist clipping
line2, = ax2.plot(x, y, label='Line')
ax2.set_title("Artist Clipping")
ax2.set_ylim(-0.5, 0.5)

line2.set_clip_on(False)
artist_clip = line2.get_clip_on()
ax2.text(0.5, -0.15, f"Artist clipping: {artist_clip}", transform=ax2.transAxes, ha='center')

plt.tight_layout()
plt.show()
Output:
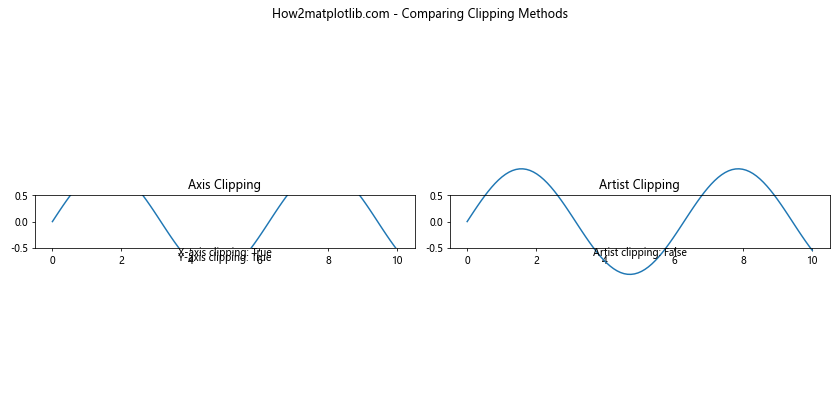
In this example, we compare axis clipping (controlled by Axis.get_clip_on()) with artist clipping (controlled by Artist.get_clip_on()). The first subplot demonstrates axis clipping, while the second subplot shows how individual artists (in this case, the line plot) can have their own clipping settings.
Matplotlib.axis.Axis.get_clip_on() in 3D Plots
Although Matplotlib.axis.Axis.get_clip_on() function in Python is commonly used with 2D plots, it can also be applied to 3D plots. Let’s explore how get_clip_on() works in a 3D context:
import matplotlib.pyplot as plt
from mpl_toolkits.mplot3d import Axes3D
import numpy as np

fig = plt.figure(figsize=(10, 8))
ax = fig.add_subplot(111, projection='3d')
ax.set_title("How2matplotlib.com - get_clip_on() in 3D")

# Create data
x = np.linspace(-5, 5, 100)
y = np.linspace(-5, 5, 100)
X, Y = np.meshgrid(x, y)
Z = np.sin(np.sqrt(X**2 + Y**2))

# Plot surface
surf = ax.plot_surface(X, Y, Z, cmap='viridis')

# Get and display clipping information
x_clip = ax.xaxis.get_clip_on()
y_clip = ax.yaxis.get_clip_on()
z_clip = ax.zaxis.get_clip_on()

ax.text2D(0.05, 0.95, f"X-axis clipping: {x_clip}", transform=ax.transAxes)
ax.text2D(0.05, 0.90, f"Y-axis clipping: {y_clip}", transform=ax.transAxes)
ax.text2D(0.05, 0.85, f"Z-axis clipping: {z_clip}", transform=ax.transAxes)

plt.show()
Output:
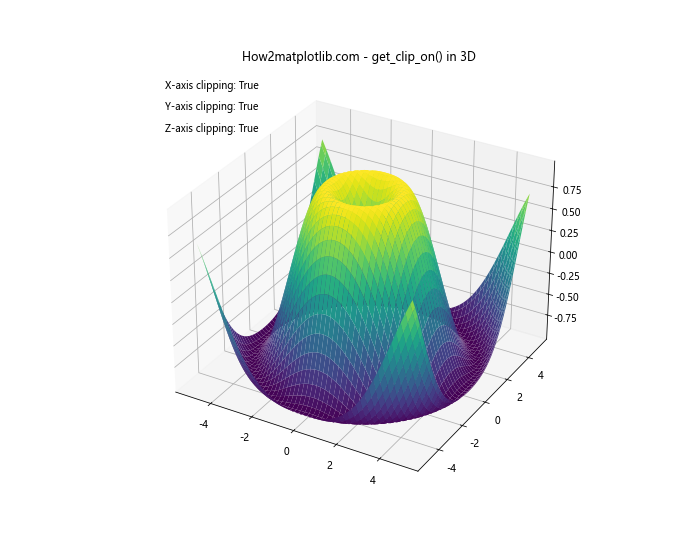
In this 3D example, we create a surface plot and use get_clip_on() to check the clipping state for all three axes (x, y, and z). The clipping information is then displayed using text annotations on the plot.
Best Practices for Using Matplotlib.axis.Axis.get_clip_on()
When working with the Matplotlib.axis.Axis.get_clip_on() function in Python, it’s important to follow some best practices to ensure your code is efficient, readable, and maintainable. Here are some tips:
- Always check the documentation: The behavior of get_clip_on() may change in different versions of Matplotlib. Always refer to the official documentation for the most up-to-date information.
Use get_clip_on() in conjunction with set_clip_on(): While get_clip_on() is useful for checking the current state, you’ll often want to use it alongside set_clip_on() to toggle clipping on and off.
Handle potential errors: As demonstrated earlier, it’s a good practice to handle potential errors when calling get_clip_on(), especially when working with different types of plots or custom axes.
Use meaningful variable names: When storing the result of get_clip_on(), use descriptive variable names that clearly indicate what the boolean value represents.
Consider performance: While get_clip_on() is generally fast, avoid calling it unnecessarily in loops or other performance-critical sections of your code.
Let’s see an example that incorporates these best practices: