Comprehensive Guide to Matplotlib.axis.Axis.get_clip_path() Function in Python
Matplotlib.axis.Axis.get_clip_path() function in Python is an essential tool for managing the clipping path of an axis in Matplotlib plots. This function is part of the Matplotlib library, which is widely used for creating static, animated, and interactive visualizations in Python. In this comprehensive guide, we’ll explore the Matplotlib.axis.Axis.get_clip_path() function in detail, covering its usage, parameters, return values, and practical applications.
Understanding the Basics of Matplotlib.axis.Axis.get_clip_path()
The Matplotlib.axis.Axis.get_clip_path() function is used to retrieve the current clipping path for an axis. A clipping path defines the region where the plot content is visible, and anything outside this region is clipped or hidden. This function is particularly useful when you need to inspect or modify the clipping behavior of an axis.
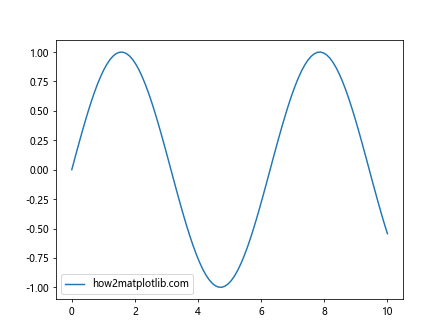
Let’s start with a simple example to demonstrate how to use the Matplotlib.axis.Axis.get_clip_path() function:
import matplotlib.pyplot as plt
import numpy as np

# Create a figure and axis
fig, ax = plt.subplots()

# Plot some data
x = np.linspace(0, 10, 100)
y = np.sin(x)
ax.plot(x, y, label='how2matplotlib.com')

# Get the clipping path of the x-axis
clip_path = ax.xaxis.get_clip_path()

# Print information about the clipping path
print(f"Clipping path: {clip_path}")

plt.legend()
plt.show()
Output:

In this example, we create a simple sine wave plot and then use the Matplotlib.axis.Axis.get_clip_path() function to retrieve the clipping path of the x-axis. The function returns a tuple containing a Path object and a Transform object, which together define the clipping region.
Using Matplotlib.axis.Axis.get_clip_path() with Different Axis Types
The Matplotlib.axis.Axis.get_clip_path() function can be used with different types of axes in Matplotlib. Let’s explore how it works with both x-axis and y-axis:
import matplotlib.pyplot as plt
import numpy as np

fig, ax = plt.subplots()

x = np.linspace(0, 10, 100)
y = np.sin(x)
ax.plot(x, y, label='how2matplotlib.com')

x_clip_path = ax.xaxis.get_clip_path()
y_clip_path = ax.yaxis.get_clip_path()

print(f"X-axis clip path: {x_clip_path}")
print(f"Y-axis clip path: {y_clip_path}")

plt.legend()
plt.show()
Output:
This example demonstrates how to retrieve the clipping paths for both the x-axis and y-axis using the Matplotlib.axis.Axis.get_clip_path() function. You’ll notice that the clipping paths for both axes are typically the same, as they define the boundaries of the entire plot area.
Customizing Clipping Behavior with Matplotlib.axis.Axis.get_clip_path()
While Matplotlib.axis.Axis.get_clip_path() is primarily used to retrieve clipping information, you can use this information to create custom clipping behavior. Here’s an example that demonstrates how to create a circular clipping region:
import matplotlib.pyplot as plt
import numpy as np
from matplotlib.path import Path
from matplotlib.patches import PathPatch

fig, ax = plt.subplots()

x = np.linspace(0, 10, 100)
y = np.sin(x)
ax.plot(x, y, label='how2matplotlib.com')

# Create a circular clipping path
theta = np.linspace(0, 2*np.pi, 100)
r = 0.5
x = r * np.cos(theta) + 0.5
y = r * np.sin(theta) + 0.5
verts = list(zip(x, y))
circular_path = Path(verts)

patch = PathPatch(circular_path, transform=ax.transAxes, facecolor='none', edgecolor='red')
ax.add_patch(patch)
ax.set_clip_path(patch)

plt.legend()
plt.show()
Output:
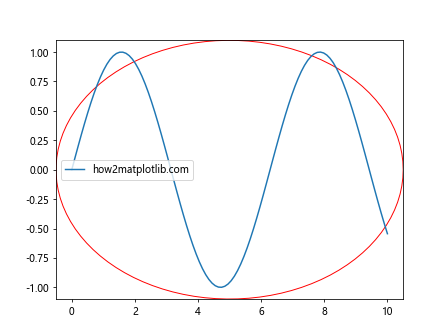
In this example, we create a circular clipping path and apply it to the axis using the information obtained from Matplotlib.axis.Axis.get_clip_path(). This results in a plot where only the content within the circular region is visible.
Animating Clipping Paths with Matplotlib.axis.Axis.get_clip_path()
The Matplotlib.axis.Axis.get_clip_path() function can also be used in animations to create dynamic clipping effects. Here’s an example that demonstrates how to animate a moving clipping region:
import matplotlib.pyplot as plt
import numpy as np
from matplotlib.animation import FuncAnimation
from matplotlib.path import Path
from matplotlib.patches import PathPatch

fig, ax = plt.subplots()

x = np.linspace(0, 10, 100)
y = np.sin(x)
line, = ax.plot(x, y, label='how2matplotlib.com')

def animate(frame):
    # Create a moving rectangular clipping path
    left = frame / 100
    bottom = 0
    width = 0.2
    height = 1
    rect = [(left, bottom), (left+width, bottom), (left+width, bottom+height), (left, bottom+height)]
    clip_path = Path(rect)
    patch = PathPatch(clip_path, transform=ax.transAxes, facecolor='none', edgecolor='red')
    ax.add_patch(patch)
    ax.set_clip_path(patch)
    return line, patch

anim = FuncAnimation(fig, animate, frames=100, interval=50, blit=True)

plt.legend()
plt.show()
Output:
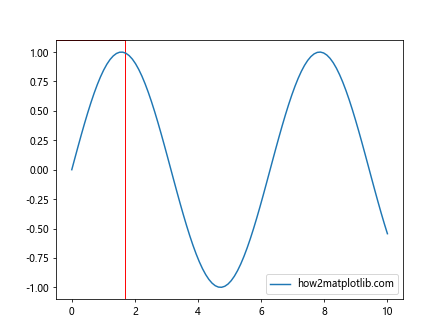
This example creates an animation where a rectangular clipping region moves across the plot, revealing different parts of the sine wave. The Matplotlib.axis.Axis.get_clip_path() function is used indirectly here, as we’re creating and applying custom clipping paths based on the axis properties.
Conclusion: Mastering Matplotlib.axis.Axis.get_clip_path() for Advanced Plotting
In this comprehensive guide, we’ve explored the Matplotlib.axis.Axis.get_clip_path() function in Python, covering its usage, applications, and various scenarios where it can be helpful. This function is a powerful tool for managing and customizing the visible areas of your Matplotlib plots.