Comprehensive Guide to Matplotlib.axis.Axis.get_data_interval() Function
Matplotlib.axis.Axis.get_data_interval() function in Python is an essential method in the Matplotlib library for data visualization. This function plays a crucial role in determining the data limits of an axis, which is fundamental for creating accurate and informative plots. In this comprehensive guide, we’ll explore the Matplotlib.axis.Axis.get_data_interval() function in depth, covering its usage, parameters, return values, and practical applications in various plotting scenarios.
Understanding the Matplotlib.axis.Axis.get_data_interval() Function
The Matplotlib.axis.Axis.get_data_interval() function is a method of the Axis class in Matplotlib. Its primary purpose is to retrieve the data interval of an axis, which represents the range of data values that the axis spans. This information is vital for setting appropriate axis limits, scaling data, and ensuring that all data points are visible within the plot.
Let’s start with a simple example to demonstrate how to use the Matplotlib.axis.Axis.get_data_interval() function:
import matplotlib.pyplot as plt
import numpy as np

# Create sample data
x = np.linspace(0, 10, 100)
y = np.sin(x)

# Create a plot
fig, ax = plt.subplots()
ax.plot(x, y, label='how2matplotlib.com')

# Get the data interval of the x-axis
x_interval = ax.xaxis.get_data_interval()
print(f"X-axis data interval: {x_interval}")

# Get the data interval of the y-axis
y_interval = ax.yaxis.get_data_interval()
print(f"Y-axis data interval: {y_interval}")

plt.legend()
plt.show()
Output:
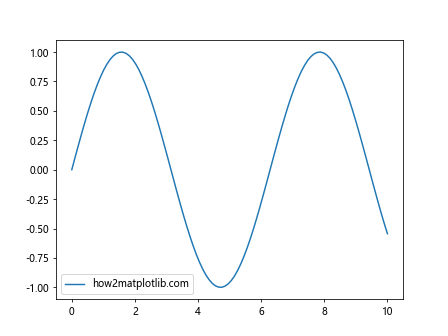
In this example, we create a simple sine wave plot and use the Matplotlib.axis.Axis.get_data_interval() function to retrieve the data intervals for both the x-axis and y-axis. The function returns a tuple containing the minimum and maximum values of the data range for each axis.
Parameters of Matplotlib.axis.Axis.get_data_interval()
The Matplotlib.axis.Axis.get_data_interval() function doesn’t accept any parameters. It’s a straightforward method that returns the current data interval of the axis without requiring any additional input.
Return Value of Matplotlib.axis.Axis.get_data_interval()
The Matplotlib.axis.Axis.get_data_interval() function returns a tuple containing two float values:
- The minimum value of the data range
- The maximum value of the data range
These values represent the extent of the data along the axis, which can be useful for various plotting operations and customizations.
Practical Applications of Matplotlib.axis.Axis.get_data_interval()
Now that we understand the basics of the Matplotlib.axis.Axis.get_data_interval() function, let’s explore some practical applications and use cases where this function can be particularly helpful.
1. Adjusting Axis Limits
One common use of the Matplotlib.axis.Axis.get_data_interval() function is to adjust the axis limits based on the data range. This can be useful when you want to add some padding to the plot or focus on a specific region of the data.
import matplotlib.pyplot as plt
import numpy as np

# Create sample data
x = np.linspace(0, 10, 100)
y = np.sin(x)

# Create a plot
fig, ax = plt.subplots()
ax.plot(x, y, label='how2matplotlib.com')

# Get the data interval of the x-axis
x_interval = ax.xaxis.get_data_interval()

# Add 10% padding to the x-axis limits
padding = 0.1 * (x_interval[1] - x_interval[0])
ax.set_xlim(x_interval[0] - padding, x_interval[1] + padding)

plt.legend()
plt.title('Sine Wave with Adjusted X-axis Limits')
plt.show()
Output:
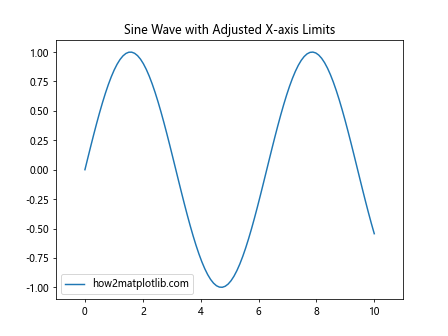
In this example, we use the Matplotlib.axis.Axis.get_data_interval() function to retrieve the x-axis data interval and then add a 10% padding to both ends of the axis. This results in a plot with slightly extended x-axis limits, providing a better visual representation of the data.
2. Creating Subplots with Shared Axes
The Matplotlib.axis.Axis.get_data_interval() function can be useful when creating subplots with shared axes. By retrieving the data intervals of multiple plots, you can ensure that all subplots have consistent axis limits.
import matplotlib.pyplot as plt
import numpy as np

# Create sample data
x = np.linspace(0, 10, 100)
y1 = np.sin(x)
y2 = np.cos(x)

# Create subplots with shared x-axis
fig, (ax1, ax2) = plt.subplots(2, 1, sharex=True)

# Plot data
ax1.plot(x, y1, label='Sine - how2matplotlib.com')
ax2.plot(x, y2, label='Cosine - how2matplotlib.com')

# Get the data interval of the x-axis for both subplots
x_interval1 = ax1.xaxis.get_data_interval()
x_interval2 = ax2.xaxis.get_data_interval()

# Set the x-axis limits to encompass both data ranges
x_min = min(x_interval1[0], x_interval2[0])
x_max = max(x_interval1[1], x_interval2[1])
ax1.set_xlim(x_min, x_max)

plt.legend()
plt.suptitle('Sine and Cosine Waves with Shared X-axis')
plt.show()
Output:
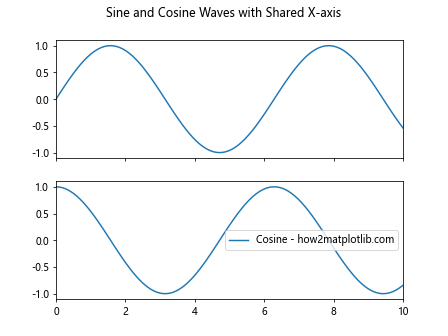
In this example, we create two subplots with a shared x-axis. We use the Matplotlib.axis.Axis.get_data_interval() function to retrieve the x-axis data intervals for both subplots and then set the x-axis limits to encompass the full range of both plots.
3. Dynamically Updating Plots
The Matplotlib.axis.Axis.get_data_interval() function can be particularly useful when working with dynamically updating plots. By continuously checking the data interval, you can ensure that the axis limits are always appropriate for the current data.
import matplotlib.pyplot as plt
import numpy as np

# Create a figure and axis
fig, ax = plt.subplots()
line, = ax.plot([], [], label='how2matplotlib.com')
ax.set_xlim(0, 10)
ax.set_ylim(-1, 1)

# Function to update the plot
def update(frame):
    x = np.linspace(0, frame, 100)
    y = np.sin(x)
    line.set_data(x, y)

    # Get the current data interval
    x_interval = ax.xaxis.get_data_interval()
    y_interval = ax.yaxis.get_data_interval()

    # Update axis limits if necessary
    if frame > x_interval[1]:
        ax.set_xlim(0, frame)
    if y_interval[0] < -1 or y_interval[1] > 1:
        ax.set_ylim(min(-1, y_interval[0]), max(1, y_interval[1]))

    return line,

# Create the animation
from matplotlib.animation import FuncAnimation
anim = FuncAnimation(fig, update, frames=np.linspace(0, 20, 200), interval=50, blit=True)

plt.legend()
plt.title('Dynamically Updating Sine Wave')
plt.show()
Output:
In this example, we create a dynamically updating sine wave plot. The Matplotlib.axis.Axis.get_data_interval() function is used within the update function to continuously check the current data intervals and adjust the axis limits accordingly.
4. Handling Logarithmic Scales
The Matplotlib.axis.Axis.get_data_interval() function can be particularly useful when working with logarithmic scales. It allows you to retrieve the data interval in the original scale, which can be helpful for setting appropriate limits or ticks.
import matplotlib.pyplot as plt
import numpy as np

# Create sample data
x = np.logspace(0, 3, 100)
y = x**2

# Create a plot with logarithmic scales
fig, ax = plt.subplots()
ax.loglog(x, y, label='how2matplotlib.com')

# Get the data interval of the x-axis
x_interval = ax.xaxis.get_data_interval()

# Set custom tick locations based on the data interval
tick_locations = np.logspace(np.log10(x_interval[0]), np.log10(x_interval[1]), 5)
ax.set_xticks(tick_locations)

plt.legend()
plt.title('Logarithmic Plot with Custom Ticks')
plt.show()
Output:
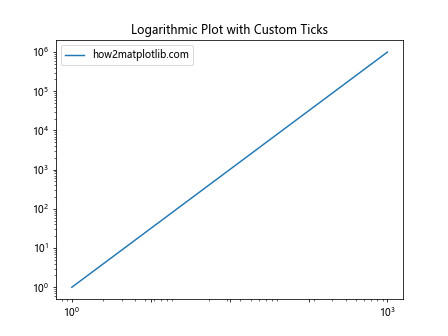
In this example, we create a logarithmic plot and use the Matplotlib.axis.Axis.get_data_interval() function to retrieve the x-axis data interval. We then use this information to set custom tick locations that are evenly spaced on the logarithmic scale.
5. Creating Histograms with Appropriate Bins
The Matplotlib.axis.Axis.get_data_interval() function can be helpful when creating histograms, especially when you want to set appropriate bin ranges based on the data.
import matplotlib.pyplot as plt
import numpy as np

# Generate sample data
data = np.random.normal(0, 1, 1000)

# Create a histogram
fig, ax = plt.subplots()
n, bins, patches = ax.hist(data, bins=30, label='how2matplotlib.com')

# Get the data interval of the x-axis
x_interval = ax.xaxis.get_data_interval()

# Set x-axis limits with some padding
padding = 0.1 * (x_interval[1] - x_interval[0])
ax.set_xlim(x_interval[0] - padding, x_interval[1] + padding)

plt.legend()
plt.title('Histogram with Adjusted X-axis Limits')
plt.show()
Output:
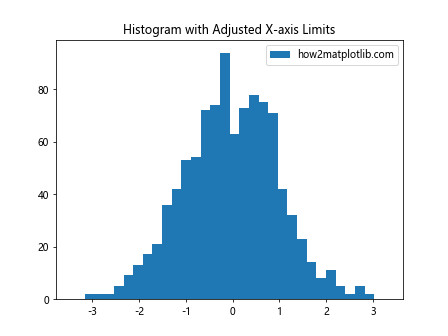
In this example, we create a histogram of normally distributed data. We use the Matplotlib.axis.Axis.get_data_interval() function to retrieve the x-axis data interval and then set the x-axis limits with some padding to ensure all bars are fully visible.
6. Creating Box Plots with Consistent Scales
When creating multiple box plots, the Matplotlib.axis.Axis.get_data_interval() function can be used to ensure that all plots have consistent scales.
import matplotlib.pyplot as plt
import numpy as np

# Generate sample data
data1 = np.random.normal(0, 1, 100)
data2 = np.random.normal(2, 1.5, 100)
data3 = np.random.normal(-1, 0.5, 100)

# Create box plots
fig, (ax1, ax2, ax3) = plt.subplots(1, 3, figsize=(12, 4))

ax1.boxplot(data1)
ax1.set_title('Dataset 1 - how2matplotlib.com')

ax2.boxplot(data2)
ax2.set_title('Dataset 2 - how2matplotlib.com')

ax3.boxplot(data3)
ax3.set_title('Dataset 3 - how2matplotlib.com')

# Get the data intervals for all axes
intervals = [ax.yaxis.get_data_interval() for ax in (ax1, ax2, ax3)]

# Set consistent y-axis limits for all subplots
y_min = min(interval[0] for interval in intervals)
y_max = max(interval[1] for interval in intervals)

for ax in (ax1, ax2, ax3):
    ax.set_ylim(y_min, y_max)

plt.tight_layout()
plt.show()
Output:
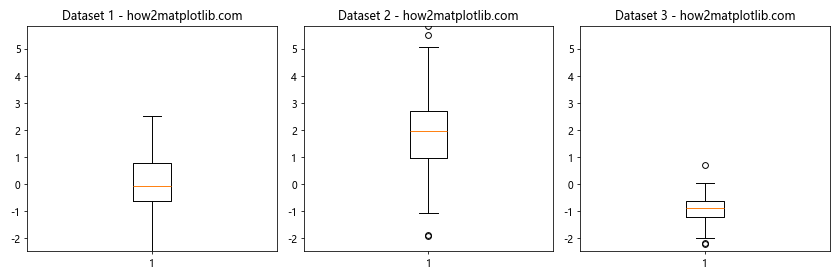
In this example, we create three box plots for different datasets. We use the Matplotlib.axis.Axis.get_data_interval() function to retrieve the y-axis data intervals for all subplots and then set consistent y-axis limits across all plots.
7. Creating Scatter Plots with Equal Aspect Ratio
The Matplotlib.axis.Axis.get_data_interval() function can be useful when creating scatter plots with an equal aspect ratio, ensuring that the plot appears visually balanced.
import matplotlib.pyplot as plt
import numpy as np

# Generate sample data
x = np.random.rand(100)
y = np.random.rand(100)

# Create a scatter plot
fig, ax = plt.subplots()
ax.scatter(x, y, label='how2matplotlib.com')

# Get the data intervals for both axes
x_interval = ax.xaxis.get_data_interval()
y_interval = ax.yaxis.get_data_interval()

# Calculate the range for both axes
x_range = x_interval[1] - x_interval[0]
y_range = y_interval[1] - y_interval[0]

# Set equal aspect ratio
ax.set_aspect(y_range / x_range)

plt.legend()
plt.title('Scatter Plot with Equal Aspect Ratio')
plt.show()
Output:
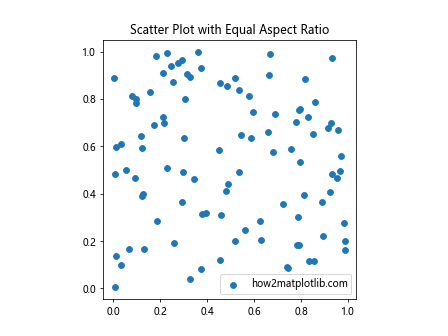
In this example, we create a scatter plot and use the Matplotlib.axis.Axis.get_data_interval() function to retrieve the data intervals for both axes. We then calculate the range for each axis and set the aspect ratio accordingly to ensure an equal aspect ratio.
8. Creating Stacked Bar Charts with Consistent Scales
When creating stacked bar charts, the Matplotlib.axis.Axis.get_data_interval() function can be used to ensure that all bars are fully visible and the y-axis scale is appropriate.
import matplotlib.pyplot as plt
import numpy as np

# Generate sample data
categories = ['A', 'B', 'C', 'D']
values1 = [1, 2, 3, 4]
values2 = [2, 3, 4, 5]
values3 = [3, 4, 5, 6]

# Create a stacked bar chart
fig, ax = plt.subplots()
ax.bar(categories, values1, label='Series 1 - how2matplotlib.com')
ax.bar(categories, values2, bottom=values1, label='Series 2 - how2matplotlib.com')
ax.bar(categories, values3, bottom=np.array(values1) + np.array(values2), label='Series 3 - how2matplotlib.com')

# Get the data interval of the y-axis
y_interval = ax.yaxis.get_data_interval()

# Set y-axis limits with some padding
padding = 0.1 * (y_interval[1] - y_interval[0])
ax.set_ylim(0, y_interval[1] + padding)

plt.legend()
plt.title('Stacked Bar Chart with Adjusted Y-axis Limits')
plt.show()
Output:
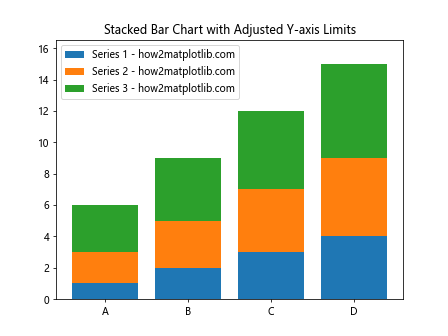
In this example, we create a stacked bar chart and use the Matplotlib.axis.Axis.get_data_interval() function to retrieve the y-axis data interval. We then set the y-axis limits with some padding to ensure all bars are fully visible.
9. Creating Polar Plots with Appropriate Limits
The Matplotlib.axis.Axis.get_data_interval() function can be useful when working with polar plots to set appropriate radial limits.
import matplotlib.pyplot as plt
import numpy as np

# Generate sample data
theta = np.linspace(0, 2*np.pi, 100)
r = 1 + np.sin(theta)

# Create a polar plot
fig, ax = plt.subplots(subplot_kw={'projection': 'polar'})
ax.plot(theta, r, label='how2matplotlib.com')

# Get the data interval of the y-axis (radial axis)
r_interval = ax.yaxis.get_data_interval()

# Set radial limits with some padding
padding = 0.1 * (r_interval[1] - r_interval[0])
ax.set_ylim(0, r_interval[1] + padding)

plt.legend()
plt.title('Polar Plot with Adjusted Radial Limits')
plt.show()
Output:
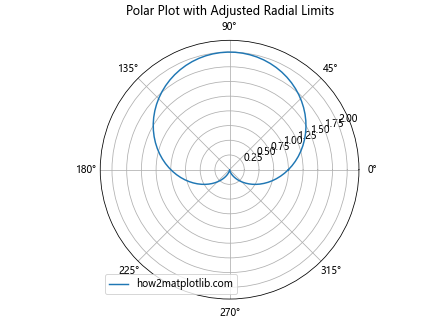
In this example, we create a polar plot and use the Matplotlib.axis.Axis.get_data_interval() function to retrieve the radial axis data interval. We then set the radial limits with some padding to ensure the entire plot is visible.
10. Creating 3D Surface Plots with Appropriate Limits
The Matplotlib.axis.Axis.get_data_interval() function can be helpful when working with 3D surface plots to set appropriate axis limits for all three dimensions.
import matplotlib.pyplot as plt
import numpy as np
from mpl_toolkits.mplot3d import Axes3D

# Generate sample data
x = np.linspace(-5, 5, 50)
y = np.linspace(-5, 5, 50)
X, Y = np.meshgrid(x, y)
Z = np.sin(np.sqrt(X**2 + Y**2))

# Create a 3D surface plot
fig = plt.figure()
ax = fig.add_subplot(111, projection='3d')
surf = ax.plot_surface(X, Y, Z, cmap='viridis', label='how2matplotlib.com')

# Get the data intervals for all axes
x_interval = ax.xaxis.get_data_interval()
y_interval = ax.yaxis.get_data_interval()
z_interval = ax.zaxis.get_data_interval()

# Set axis limits with some padding
padding = 0.1
ax.set_xlim(x_interval[0] - padding, x_interval[1] + padding)
ax.set_ylim(y_interval[0] - padding, y_interval[1] + padding)
ax.set_zlim(z_interval[0] - padding, z_interval[1] + padding)

plt.title('3D Surface Plot with Adjusted Axis Limits')
plt.show()
Output:
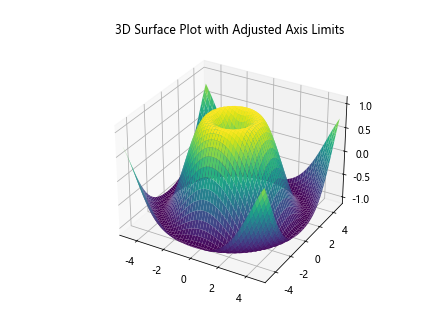
In this example, we create a 3D surface plot and use the Matplotlib.axis.Axis.get_data_interval() function to retrieve the data intervals for all three axes. We then set the axis limits with some padding to ensure the entire surface is visible.
Advanced Usage of Matplotlib.axis.Axis.get_data_interval()
While we’ve covered many practical applications of the Matplotlib.axis.Axis.get_data_interval() function, there are some advanced usage scenarios worth exploring.
1. Combining with set_data_interval()
The Matplotlib.axis.Axis.get_data_interval() function can be used in conjunction with its counterpart, set_data_interval(), to manually control the data range of an axis.
import matplotlib.pyplot as plt
import numpy as np

# Generate sample data
x = np.linspace(0, 10, 100)
y = np.sin(x)

# Create a plot
fig, ax = plt.subplots()
ax.plot(x, y, label='how2matplotlib.com')

# Get the current data interval
original_interval = ax.xaxis.get_data_interval()
print(f"Original x-axis interval: {original_interval}")

# Set a new data interval
new_interval = (2, 8)
ax.xaxis.set_data_interval(*new_interval)

# Get the updated data interval
updated_interval = ax.xaxis.get_data_interval()
print(f"Updated x-axis interval: {updated_interval}")

plt.legend()
plt.title('Sine Wave with Modified X-axis Interval')
plt.show()
Output:
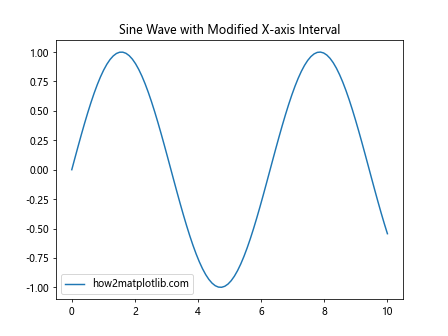
In this example, we first use get_data_interval() to retrieve the original x-axis interval, then use set_data_interval() to manually set a new interval, and finally use get_data_interval() again to confirm the change.
2. Working with Date Axes
The Matplotlib.axis.Axis.get_data_interval() function can be particularly useful when working with date axes, allowing you to retrieve the date range of your data.
import matplotlib.pyplot as plt
import numpy as np
import datetime

# Generate sample data
dates = [datetime.datetime(2023, 1, 1) + datetime.timedelta(days=i) for i in range(365)]
values = np.random.randn(365).cumsum()

# Create a plot
fig, ax = plt.subplots(figsize=(12, 6))
ax.plot(dates, values, label='how2matplotlib.com')

# Get the data interval of the x-axis
date_interval = ax.xaxis.get_data_interval()

# Convert numeric interval to datetime objects
start_date = datetime.datetime.fromordinal(int(date_interval[0]))
end_date = datetime.datetime.fromordinal(int(date_interval[1]))

print(f"Data start date: {start_date}")
print(f"Data end date: {end_date}")

plt.legend()
plt.title('Time Series Data with Date Axis')
plt.show()
Output:
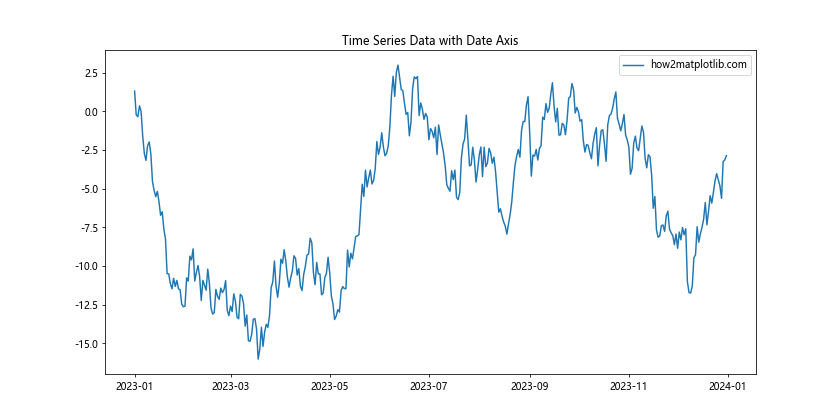
In this example, we create a time series plot and use the Matplotlib.axis.Axis.get_data_interval() function to retrieve the date range of the data. We then convert the numeric interval to datetime objects for easier interpretation.
3. Handling Multiple Data Series
When working with multiple data series on the same plot, the Matplotlib.axis.Axis.get_data_interval() function returns the overall data range across all series.
import matplotlib.pyplot as plt
import numpy as np

# Generate sample data
x1 = np.linspace(0, 10, 100)
y1 = np.sin(x1)
x2 = np.linspace(5, 15, 100)
y2 = np.cos(x2)

# Create a plot with multiple series
fig, ax = plt.subplots()
ax.plot(x1, y1, label='Sine - how2matplotlib.com')
ax.plot(x2, y2, label='Cosine - how2matplotlib.com')

# Get the data interval of the x-axis
x_interval = ax.xaxis.get_data_interval()
print(f"X-axis data interval: {x_interval}")

# Get the data interval of the y-axis
y_interval = ax.yaxis.get_data_interval()
print(f"Y-axis data interval: {y_interval}")

plt.legend()
plt.title('Multiple Data Series')
plt.show()
Output:
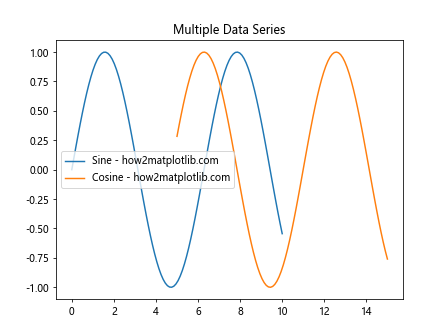
In this example, we plot two different data series with overlapping x-ranges. The Matplotlib.axis.Axis.get_data_interval() function returns the overall data range that encompasses both series.
Best Practices and Tips for Using Matplotlib.axis.Axis.get_data_interval()
When working with the Matplotlib.axis.Axis.get_data_interval() function, there are several best practices and tips to keep in mind:
- Always check the returned interval: The function may return unexpected values if no data has been plotted yet or if the axis limits have been manually set.
Use in combination with other Matplotlib functions: Combine get_data_interval() with functions like set_xlim(), set_ylim(), or set_aspect() for more precise control over your plots.
Be cautious with logarithmic scales: When working with logarithmic scales, remember that get_data_interval() returns values in the original scale, not the logarithmic scale.
Consider using get_data_interval() in custom functions: If you’re creating reusable plotting functions, get_data_interval() can be useful for dynamically adjusting plot properties based on the data.
Remember that get_data_interval() reflects the current state: The returned interval may change if you add or remove data from the plot, so call the function after all data has been added if you need the final interval.
Conclusion
The Matplotlib.axis.Axis.get_data_interval() function is a powerful tool in the Matplotlib library that provides valuable information about the data range of an axis. By understanding how to use this function effectively, you can create more dynamic, responsive, and informative visualizations. Throughout this comprehensive guide, we’ve explored various applications of the Matplotlib.axis.Axis.get_data_interval() function, from basic usage to advanced scenarios. We’ve seen how it can be used to adjust axis limits, create consistent scales across multiple plots, handle different types of plots (including histograms, box plots, and 3D surfaces), and work with special cases like logarithmic scales and date axes. By incorporating the Matplotlib.axis.Axis.get_data_interval() function into your data visualization workflow, you can enhance the flexibility and adaptability of your plots, ensuring that they accurately represent your data and provide meaningful insights to your audience.