How to Change Slider Color in Matplotlib
Matplotlib Change Slider Color is an essential topic for data visualization enthusiasts and professionals alike. In this comprehensive guide, we’ll explore various techniques to customize the appearance of sliders in Matplotlib, focusing specifically on changing their color. We’ll cover everything from basic color changes to advanced styling options, providing you with the knowledge and tools to create visually appealing and interactive plots.
Understanding Matplotlib Sliders
Before diving into changing slider colors, let’s first understand what Matplotlib sliders are and how they work. Matplotlib sliders are interactive widgets that allow users to dynamically adjust values in a plot. They are particularly useful for visualizing how changes in parameters affect the overall plot.
To create a basic slider in Matplotlib, you typically use the Slider class from matplotlib.widgets. Here’s a simple example:
import matplotlib.pyplot as plt
from matplotlib.widgets import Slider

fig, ax = plt.subplots()
plt.subplots_adjust(bottom=0.25)

t = np.arange(0.0, 1.0, 0.001)
s = np.sin(2 * np.pi * t)
l, = plt.plot(t, s)

ax_slider = plt.axes([0.1, 0.1, 0.8, 0.03])
slider = Slider(ax_slider, 'Amplitude', 0, 1, valinit=0.5)

plt.title('Slider Example - how2matplotlib.com')
plt.show()
In this example, we create a simple sine wave plot with a slider that adjusts the amplitude. The slider is positioned at the bottom of the plot, and its default color is determined by Matplotlib’s style settings.
Changing Slider Color: The Basics
Now that we understand the basics of Matplotlib sliders, let’s explore how to change their color. The most straightforward way to change a slider’s color is by modifying its color attribute. This attribute affects the color of the slider’s handle and the active part of the slider bar.
Here’s an example of how to change the slider color:
import matplotlib.pyplot as plt
from matplotlib.widgets import Slider
import numpy as np

fig, ax = plt.subplots()
plt.subplots_adjust(bottom=0.25)

t = np.arange(0.0, 1.0, 0.001)
s = np.sin(2 * np.pi * t)
l, = plt.plot(t, s)

ax_slider = plt.axes([0.1, 0.1, 0.8, 0.03])
slider = Slider(ax_slider, 'Amplitude', 0, 1, valinit=0.5, color='red')

plt.title('Red Slider - how2matplotlib.com')
plt.show()
Output:
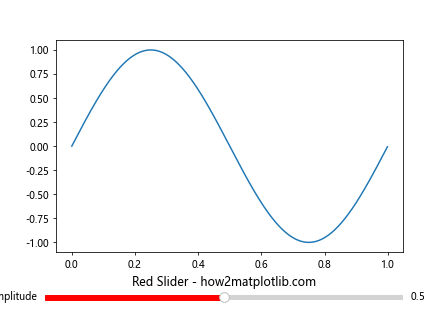
In this example, we’ve set the color parameter of the Slider to ‘red’. This changes the color of the slider handle and the active part of the slider bar to red.
Advanced Color Customization
While changing the overall color of the slider is useful, Matplotlib offers more granular control over the slider’s appearance. You can separately customize the colors of different parts of the slider, such as the handle, the active part of the slider bar, and the inactive part.
Here’s an example demonstrating how to customize these different parts:
import matplotlib.pyplot as plt
from matplotlib.widgets import Slider
import numpy as np

fig, ax = plt.subplots()
plt.subplots_adjust(bottom=0.25)

t = np.arange(0.0, 1.0, 0.001)
s = np.sin(2 * np.pi * t)
l, = plt.plot(t, s)

ax_slider = plt.axes([0.1, 0.1, 0.8, 0.03])
slider = Slider(
    ax_slider, 'Amplitude', 0, 1, valinit=0.5,
    color='red',  # Color of the slider handle and active part
    track_color='lightgray',  # Color of the inactive part of the slider
    handle_style={'facecolor': 'blue', 'edgecolor': 'green', 'size': 16}
)

plt.title('Custom Colored Slider - how2matplotlib.com')
plt.show()
Output:
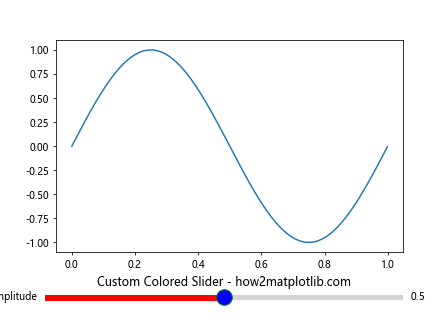
In this example, we’ve customized the slider’s appearance in several ways:
- The
colorparameter sets the color of the slider handle and the active part of the slider bar to red. - The
track_colorparameter sets the color of the inactive part of the slider bar to light gray. - The
handle_styledictionary allows us to customize the slider handle further. We’ve set its face color to blue, edge color to green, and increased its size.
Using Color Maps for Sliders
Another interesting way to change slider colors in Matplotlib is by using color maps. This can be particularly useful when you want the slider color to represent a range of values. Let’s look at an example:
import matplotlib.pyplot as plt
from matplotlib.widgets import Slider
import numpy as np

fig, ax = plt.subplots()
plt.subplots_adjust(bottom=0.25)

t = np.arange(0.0, 1.0, 0.001)
s = np.sin(2 * np.pi * t)
l, = plt.plot(t, s)

ax_slider = plt.axes([0.1, 0.1, 0.8, 0.03])
slider = Slider(ax_slider, 'Amplitude', 0, 1, valinit=0.5)

cmap = plt.get_cmap('viridis')

def update(val):
    color = cmap(val)
    slider.poly.set_color(color)
    slider.handle.set_facecolor(color)
    fig.canvas.draw_idle()

slider.on_changed(update)

plt.title('Color Map Slider - how2matplotlib.com')
plt.show()
Output:
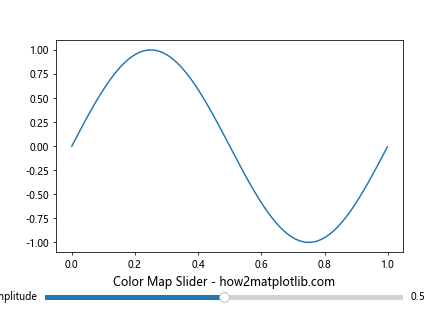
In this example, we’ve used the ‘viridis’ color map to dynamically change the slider’s color based on its value. As the slider moves, its color changes according to the color map.
Changing Slider Color Dynamically
Sometimes, you might want to change the slider color dynamically based on certain conditions or user interactions. Here’s an example of how you can achieve this:
import matplotlib.pyplot as plt
from matplotlib.widgets import Slider, Button
import numpy as np

fig, ax = plt.subplots()
plt.subplots_adjust(bottom=0.35)

t = np.arange(0.0, 1.0, 0.001)
s = np.sin(2 * np.pi * t)
l, = plt.plot(t, s)

ax_slider = plt.axes([0.1, 0.2, 0.8, 0.03])
slider = Slider(ax_slider, 'Amplitude', 0, 1, valinit=0.5)

ax_button = plt.axes([0.4, 0.1, 0.2, 0.05])
button = Button(ax_button, 'Change Color')

colors = ['red', 'green', 'blue', 'yellow', 'purple']
color_index = 0

def change_color(event):
    global color_index
    color = colors[color_index % len(colors)]
    slider.poly.set_color(color)
    slider.handle.set_facecolor(color)
    color_index += 1
    fig.canvas.draw_idle()

button.on_clicked(change_color)

plt.title('Dynamic Color Change - how2matplotlib.com')
plt.show()
Output:
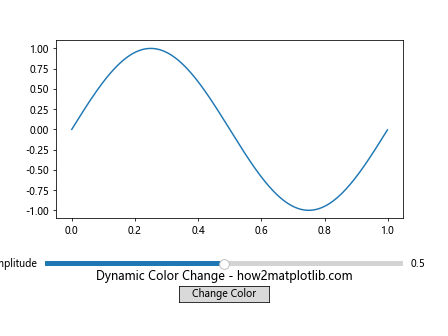
In this example, we’ve added a button that, when clicked, changes the color of the slider. The colors cycle through a predefined list of colors.
Customizing Slider Appearance with Styles
Matplotlib provides a powerful styling system that allows you to customize the appearance of your plots, including sliders. You can use style sheets to change the default appearance of sliders across your entire plot. Here’s an example:
import matplotlib.pyplot as plt
from matplotlib.widgets import Slider
import numpy as np

plt.style.use('dark_background')

fig, ax = plt.subplots()
plt.subplots_adjust(bottom=0.25)

t = np.arange(0.0, 1.0, 0.001)
s = np.sin(2 * np.pi * t)
l, = plt.plot(t, s)

ax_slider = plt.axes([0.1, 0.1, 0.8, 0.03])
slider = Slider(ax_slider, 'Amplitude', 0, 1, valinit=0.5)

plt.title('Styled Slider - how2matplotlib.com')
plt.show()
Output:
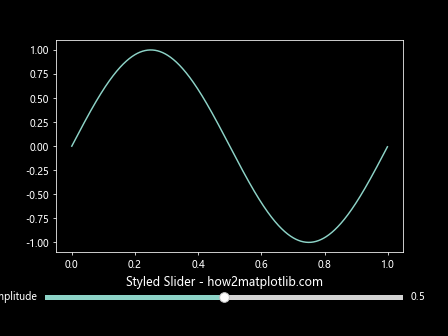
In this example, we’ve used the ‘dark_background’ style, which changes the overall appearance of the plot, including the slider. The slider color automatically adjusts to be visible against the dark background.
Creating Multiple Sliders with Different Colors
When working with multiple parameters, you might want to create several sliders, each with a different color. This can help users distinguish between different parameters more easily. Here’s an example:
import matplotlib.pyplot as plt
from matplotlib.widgets import Slider
import numpy as np

fig, ax = plt.subplots()
plt.subplots_adjust(bottom=0.35)

t = np.arange(0.0, 1.0, 0.001)
a, f = 0.5, 3
s = a * np.sin(2 * np.pi * f * t)
l, = plt.plot(t, s)

ax_amp = plt.axes([0.1, 0.2, 0.8, 0.03])
ax_freq = plt.axes([0.1, 0.15, 0.8, 0.03])

slider_amp = Slider(ax_amp, 'Amplitude', 0, 1, valinit=a, color='red')
slider_freq = Slider(ax_freq, 'Frequency', 0, 10, valinit=f, color='blue')

def update(val):
    amp = slider_amp.val
    freq = slider_freq.val
    l.set_ydata(amp * np.sin(2 * np.pi * freq * t))
    fig.canvas.draw_idle()

slider_amp.on_changed(update)
slider_freq.on_changed(update)

plt.title('Multiple Colored Sliders - how2matplotlib.com')
plt.show()
Output:
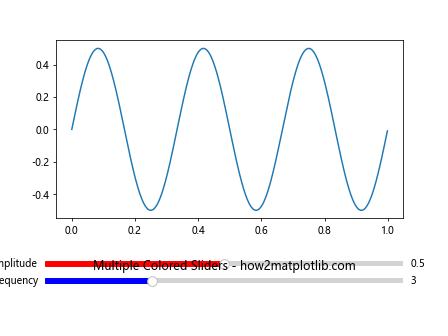
In this example, we’ve created two sliders: one for amplitude (in red) and one for frequency (in blue). This color coding helps users quickly identify which slider controls which parameter.
Using Gradients for Slider Colors
For a more visually appealing slider, you can use gradients to create a smooth transition of colors along the slider bar. Here’s an example of how to achieve this effect:
import matplotlib.pyplot as plt
from matplotlib.widgets import Slider
import numpy as np
from matplotlib.colors import LinearSegmentedColormap

fig, ax = plt.subplots()
plt.subplots_adjust(bottom=0.25)

t = np.arange(0.0, 1.0, 0.001)
s = np.sin(2 * np.pi * t)
l, = plt.plot(t, s)

ax_slider = plt.axes([0.1, 0.1, 0.8, 0.03])

# Create a custom colormap
colors = ['blue', 'green', 'red']
n_bins = 100
cmap = LinearSegmentedColormap.from_list('custom', colors, N=n_bins)

slider = Slider(ax_slider, 'Amplitude', 0, 1, valinit=0.5)

# Apply gradient to slider
gradient = np.linspace(0, 1, 256).reshape(1, -1)
ax_slider.imshow(gradient, aspect='auto', cmap=cmap)
ax_slider.set_xticks([])
ax_slider.set_yticks([])

plt.title('Gradient Slider - how2matplotlib.com')
plt.show()
Output:
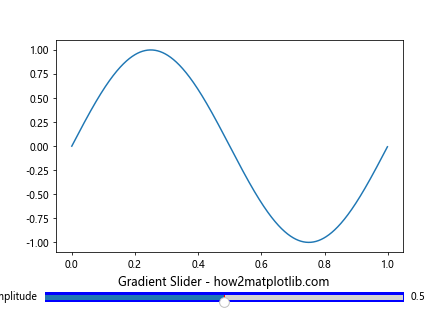
In this example, we’ve created a custom color map and applied it to the slider background. This creates a smooth gradient effect from blue to green to red along the slider bar.
Changing Slider Color Based on Value
You can also change the slider color dynamically based on its current value. This can be useful for providing visual feedback about the slider’s position. Here’s an example:
import matplotlib.pyplot as plt
from matplotlib.widgets import Slider
import numpy as np

fig, ax = plt.subplots()
plt.subplots_adjust(bottom=0.25)

t = np.arange(0.0, 1.0, 0.001)
s = np.sin(2 * np.pi * t)
l, = plt.plot(t, s)

ax_slider = plt.axes([0.1, 0.1, 0.8, 0.03])
slider = Slider(ax_slider, 'Amplitude', 0, 1, valinit=0.5)

def update(val):
    if val < 0.33:
        color = 'green'
    elif val < 0.66:
        color = 'yellow'
    else:
        color = 'red'
    slider.poly.set_color(color)
    slider.handle.set_facecolor(color)
    fig.canvas.draw_idle()

slider.on_changed(update)

plt.title('Value-Based Color Change - how2matplotlib.com')
plt.show()
Output:
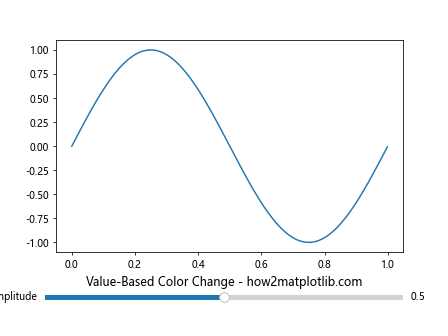
In this example, the slider color changes based on its value: green for low values, yellow for medium values, and red for high values.
Creating a Custom Slider Widget
For even more control over the slider's appearance, you can create a custom slider widget. This allows you to define every aspect of the slider's look and behavior. Here's an example of a custom slider:
import matplotlib.pyplot as plt
from matplotlib.widgets import AxesWidget
import numpy as np

class CustomSlider(AxesWidget):
    def __init__(self, ax, label, valmin, valmax, valinit=0.5, valfmt='%1.2f', color='blue', **kwargs):
        AxesWidget.__init__(self, ax)

        self.valmin = valmin
        self.valmax = valmax
        self.val = valinit
        self.color = color

        ax.set_yticks([])
        ax.set_xlim((0, 1))
        ax.set_xticks([])
        ax.set_navigate(False)

        self.poly = ax.axvspan(0, valinit, 0, 1, fc=color, ec='none')
        self.handle = ax.axvline(valinit, 0, 1, color='w', lw=4)

        ax.text(-0.02, 0.5, label, transform=ax.transAxes, verticalalignment='center', horizontalalignment='right')
        self.valtext = ax.text(1.02, 0.5, valfmt % valinit, transform=ax.transAxes, verticalalignment='center', horizontalalignment='left')

        self.connect_event('button_press_event', self._update)
        self.connect_event('button_release_event', self._update)
        self.connect_event('motion_notify_event', self._update)

    def _update(self, event):
        if self.ignore(event):
            return
        if event.button != 1:
            return
        if event.inaxes != self.ax:
            return
        val = event.xdata
        if val <= self.valmin:
            val = self.valmin
        elif val >= self.valmax:
            val = self.valmax
        self.set_val(val)

    def set_val(self, val):
        xy = self.poly.xy
        xy[2] = val, 1
        xy[3] = val, 0
        self.poly.xy = xy
        self.handle.set_xdata(val)
        self.valtext.set_text(self.valfmt % val)
        self.val = val
        if self.drawon:
            self.ax.figure.canvas.draw_idle()
        self.valtext.set_text(self.valfmt % val)
        if not self.eventson:
            return
        for cid, func in self.observers.items():
            func(val)

fig, ax = plt.subplots()
plt.subplots_adjust(bottom=0.25)

t = np.arange(0.0, 1.0, 0.001)
s = np.sin(2 * np.pi * t)
l, = plt.plot(t, s)

ax_slider = plt.axes([0.1, 0.1, 0.8, 0.03])
custom_slider = CustomSlider(ax_slider, 'Amplitude', 0, 1, valinit=0.5, color='purple')

plt.title('Custom Slider Widget - how2matplotlib.com')
plt.show()
Output:
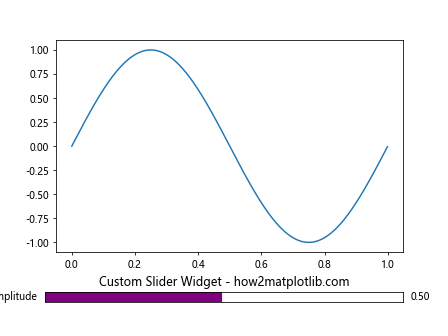
In this example, we've created a custom slider widget that allows for more detailed customization of the slider's appearance and behavior. The slider has a purple color and a white handle, with the current value displayed to the right of the slider.
Slider Color and Accessibility
When changing slider colors, it's important to consider accessibility. Ensure that there's enough contrast between the slider and the background, and consider using color-blind friendly palettes. Here's an example that uses a color-blind friendly palette:
import matplotlib.pyplot as plt
from matplotlib.widgets import Slider
import numpy as np
import seaborn as sns

fig, ax = plt.subplots()
plt.subplots_adjust(bottom=0.25)

t = np.arange(0.0, 1.0, 0.001)
s = np.sin(2 * np.pi * t)
l, = plt.plot(t, s)

ax_slider = plt.axes([0.1, 0.1, 0.8, 0.03])

# Use a color-blind friendly palette
colors = sns.color_palette("colorblind")

slider = Slider(ax_slider, 'Amplitude', 0, 1, valinit=0.5, color=colors[0])

plt.title('Accessible Slider Color - how2matplotlib.com')
plt.show()
Output:
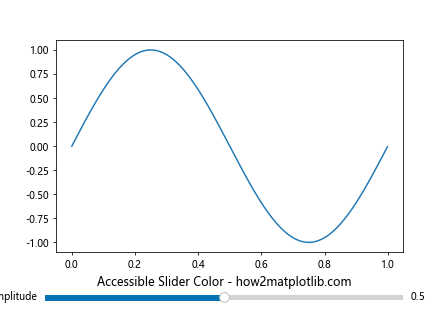
In this example, we've used Seaborn's color-blind friendly palette to choose a color for our slider that should be distinguishable by most users, including those with color vision deficiencies.
Combining Multiple Techniques
You can combine multiple techniques we've discussed to create highly customized and interactive sliders. Here's an example that combines dynamic color changes, multiple sliders, and custom styling:
import matplotlib.pyplot as plt
from matplotlib.widgets import Slider
import numpy as np

plt.style.use('dark_background')

fig, ax = plt.subplots()
plt.subplots_adjust(bottom=0.35)

t = np.arange(0.0, 1.0, 0.001)
a, f, p = 0.5, 3, 0
s = a * np.sin(2 * np.pi * f * t + p)
l, = plt.plot(t, s)

ax_amp = plt.axes([0.1, 0.2, 0.8, 0.03])
ax_freq = plt.axes([0.1, 0.15, 0.8, 0.03])
ax_phase = plt.axes([0.1, 0.1, 0.8, 0.03])

slider_amp = Slider(ax_amp, 'Amplitude', 0, 1, valinit=a, color='red')
slider_freq = Slider(ax_freq, 'Frequency', 0, 10, valinit=f, color='green')
slider_phase = Slider(ax_phase, 'Phase', 0, 2*np.pi, valinit=p, color='blue')

def update(val):
    amp = slider_amp.val
    freq = slider_freq.val
    phase = slider_phase.val
    l.set_ydata(amp * np.sin(2 * np.pi * freq * t + phase))
    fig.canvas.draw_idle()

slider_amp.on_changed(update)
slider_freq.on_changed(update)
slider_phase.on_changed(update)

cmap = plt.get_cmap('viridis')

def update_color(val):
    color = cmap(val)
    slider_amp.poly.set_color(color)
    slider_amp.handle.set_facecolor(color)
    fig.canvas.draw_idle()

slider_amp.on_changed(update_color)

plt.title('Advanced Slider Customization - how2matplotlib.com')
plt.show()
Output:
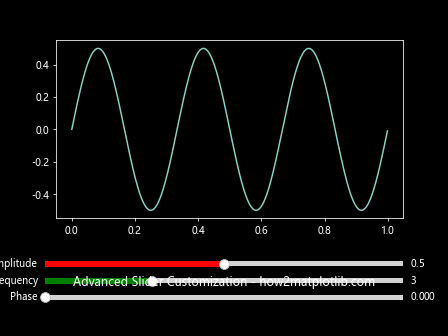
In this example, we've created three sliders controlling different aspects of a sine wave. The amplitude slider changes color based on its value, while the frequency and phase sliders have fixed colors. We've also applied a dark background style to the entire plot.
Conclusion
Changing slider colors in Matplotlib is a powerful way to enhance the visual appeal and functionality of your interactive plots. From simple color changes to advanced customizations, the techniques we've explored in this guide provide a wide range of options for tailoring sliders to your specific needs.
Remember that while aesthetics are important, it's crucial to balance visual appeal with clarity and usability. Always consider the purpose of your visualization and your target audience when deciding on color schemes and customizations.