Comprehensive Guide to Matplotlib.axis.Axis.get_children() Function in Python
Matplotlib.axis.Axis.get_children() function in Python is a powerful tool for accessing and manipulating the child elements of an axis in Matplotlib plots. This function is essential for developers who want to customize their plots and gain more control over individual components. In this comprehensive guide, we’ll explore the Matplotlib.axis.Axis.get_children() function in depth, covering its usage, applications, and providing numerous examples to help you master this important feature of Matplotlib.
Understanding the Matplotlib.axis.Axis.get_children() Function
The Matplotlib.axis.Axis.get_children() function is a method of the Axis class in Matplotlib. It returns a list of all the child artists of the axis. These child artists include various elements such as tick marks, tick labels, axis labels, and other decorative elements associated with the axis.
Let’s start with a simple example to demonstrate how to use the Matplotlib.axis.Axis.get_children() function:
import matplotlib.pyplot as plt

# Create a simple plot
fig, ax = plt.subplots()
ax.plot([1, 2, 3, 4], [1, 4, 2, 3], label='Data from how2matplotlib.com')

# Get the children of the x-axis
x_axis_children = ax.xaxis.get_children()

# Print the number of children
print(f"Number of x-axis children: {len(x_axis_children)}")

# Print the types of children
for child in x_axis_children:
    print(type(child))

plt.show()
Output:
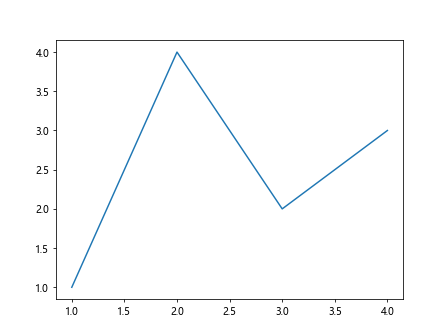
In this example, we create a simple line plot and then use the Matplotlib.axis.Axis.get_children() function to retrieve the children of the x-axis. We print the number of children and their types to get an idea of what elements are included.
Exploring the Types of Axis Children
The Matplotlib.axis.Axis.get_children() function returns various types of child artists. Let’s explore some of the common types you might encounter:
- Tick marks (matplotlib.axis.XTick or matplotlib.axis.YTick)
- Tick labels (matplotlib.text.Text)
- Axis labels (matplotlib.text.Text)
- Grid lines (matplotlib.lines.Line2D)
- Spine lines (matplotlib.spines.Spine)
Here’s an example that demonstrates how to identify and count these different types of children:
import matplotlib.pyplot as plt
from collections import Counter

# Create a plot with grid lines
fig, ax = plt.subplots()
ax.plot([1, 2, 3, 4], [1, 4, 2, 3], label='Data from how2matplotlib.com')
ax.set_xlabel('X-axis')
ax.set_ylabel('Y-axis')
ax.grid(True)

# Get the children of both x and y axes
all_children = ax.xaxis.get_children() + ax.yaxis.get_children()

# Count the types of children
child_types = Counter(type(child).__name__ for child in all_children)

# Print the counts
for child_type, count in child_types.items():
    print(f"{child_type}: {count}")

plt.show()
Output:
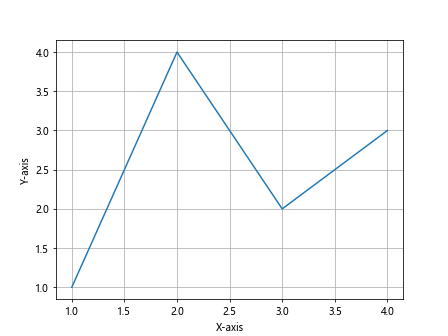
This example creates a plot with grid lines and axis labels, then uses the Matplotlib.axis.Axis.get_children() function to get all children of both x and y axes. It then counts and prints the different types of children.
Modifying Axis Children Using Matplotlib.axis.Axis.get_children()
One of the most powerful applications of the Matplotlib.axis.Axis.get_children() function is the ability to modify individual axis elements. Let’s look at some examples of how to customize various axis children:
Customizing Tick Labels
import matplotlib.pyplot as plt

fig, ax = plt.subplots()
ax.plot([1, 2, 3, 4], [1, 4, 2, 3], label='Data from how2matplotlib.com')

# Get x-axis children
x_children = ax.xaxis.get_children()

# Modify tick labels
for child in x_children:
    if isinstance(child, plt.Text):
        child.set_fontsize(14)
        child.set_color('red')

plt.show()
Output:
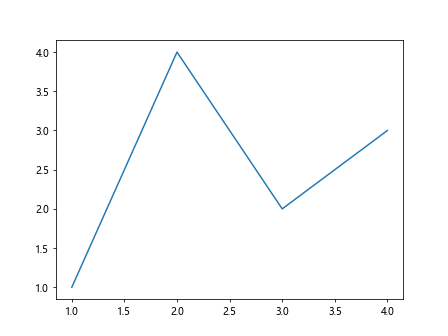
In this example, we use the Matplotlib.axis.Axis.get_children() function to access the x-axis children and modify the font size and color of the tick labels.
Customizing Tick Marks
import matplotlib.pyplot as plt

fig, ax = plt.subplots()
ax.plot([1, 2, 3, 4], [1, 4, 2, 3], label='Data from how2matplotlib.com')

# Get y-axis children
y_children = ax.yaxis.get_children()

# Modify tick marks
for child in y_children:
    if isinstance(child, plt.Line2D):
        child.set_markersize(10)
        child.set_markeredgewidth(2)
        child.set_color('green')

plt.show()
Output:
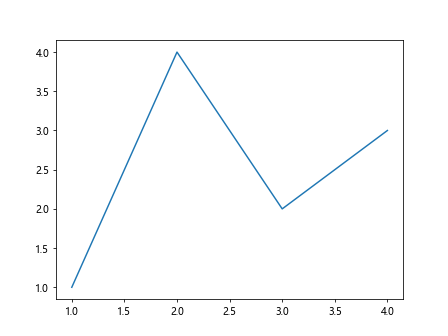
This example demonstrates how to use the Matplotlib.axis.Axis.get_children() function to access y-axis children and customize the appearance of tick marks.
Advanced Applications of Matplotlib.axis.Axis.get_children()
The Matplotlib.axis.Axis.get_children() function can be used for more advanced customizations and analysis of plot elements. Let’s explore some advanced applications:
Removing Specific Axis Children
import matplotlib.pyplot as plt

fig, ax = plt.subplots()
ax.plot([1, 2, 3, 4], [1, 4, 2, 3], label='Data from how2matplotlib.com')

# Get x-axis children
x_children = ax.xaxis.get_children()

# Remove every other tick label
for i, child in enumerate(x_children):
    if isinstance(child, plt.Text) and i % 2 == 0:
        child.set_visible(False)

plt.show()
Output:
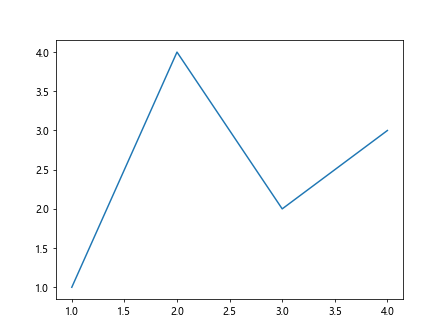
This example uses the Matplotlib.axis.Axis.get_children() function to access x-axis children and remove every other tick label, creating a less cluttered axis.
Customizing Grid Lines
import matplotlib.pyplot as plt

fig, ax = plt.subplots()
ax.plot([1, 2, 3, 4], [1, 4, 2, 3], label='Data from how2matplotlib.com')
ax.grid(True)

# Get all axis children
all_children = ax.xaxis.get_children() + ax.yaxis.get_children()

# Customize grid lines
for child in all_children:
    if isinstance(child, plt.Line2D) and child.get_linestyle() == ':':
        child.set_linestyle('--')
        child.set_color('red')
        child.set_alpha(0.5)

plt.show()
Output:
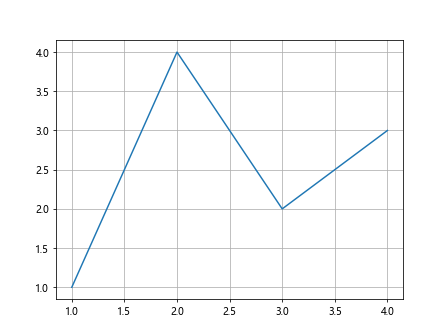
In this example, we use the Matplotlib.axis.Axis.get_children() function to access all axis children and customize the appearance of grid lines.
Combining Matplotlib.axis.Axis.get_children() with Other Matplotlib Functions
The Matplotlib.axis.Axis.get_children() function can be combined with other Matplotlib functions to create more complex and customized plots. Let’s explore some examples:
Creating a Custom Tick Formatter
import matplotlib.pyplot as plt
import matplotlib.ticker as ticker

fig, ax = plt.subplots()
ax.plot([1, 2, 3, 4], [100, 400, 200, 300], label='Data from how2matplotlib.com')

# Define a custom formatter function
def custom_formatter(x, pos):
    return f'${x:.0f}'

# Apply the custom formatter to y-axis
ax.yaxis.set_major_formatter(ticker.FuncFormatter(custom_formatter))

# Get y-axis children
y_children = ax.yaxis.get_children()

# Customize tick labels
for child in y_children:
    if isinstance(child, plt.Text):
        child.set_fontweight('bold')

plt.show()
Output:
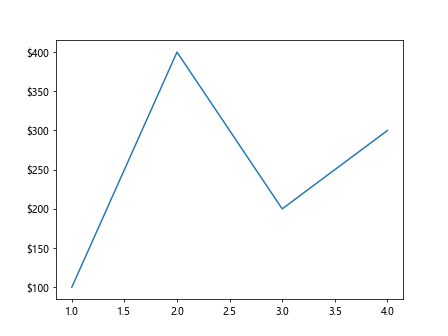
This example combines the Matplotlib.axis.Axis.get_children() function with a custom tick formatter to create a plot with dollar-formatted y-axis labels.
Creating a Dual-Axis Plot with Customized Axes
import matplotlib.pyplot as plt

fig, ax1 = plt.subplots()

# Plot data on the first axis
ax1.plot([1, 2, 3, 4], [1, 4, 2, 3], 'b-', label='Data 1 from how2matplotlib.com')
ax1.set_xlabel('X-axis')
ax1.set_ylabel('Y-axis 1', color='b')

# Create a second y-axis
ax2 = ax1.twinx()
ax2.plot([1, 2, 3, 4], [10, 20, 15, 25], 'r-', label='Data 2 from how2matplotlib.com')
ax2.set_ylabel('Y-axis 2', color='r')

# Customize both axes using get_children()
for ax in [ax1, ax2]:
    children = ax.get_children()
    for child in children:
        if isinstance(child, plt.Text):
            child.set_fontsize(12)
        elif isinstance(child, plt.Line2D):
            child.set_linewidth(2)

plt.title('Dual-Axis Plot')
plt.show()
Output:
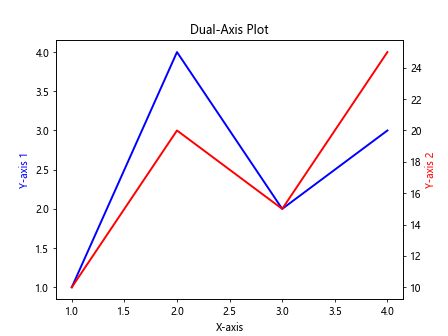
This example demonstrates how to use the Matplotlib.axis.Axis.get_children() function to customize a dual-axis plot, applying different styles to each axis.
Best Practices for Using Matplotlib.axis.Axis.get_children()
When working with the Matplotlib.axis.Axis.get_children() function, it’s important to follow some best practices to ensure your code is efficient and maintainable:
- Always check the type of child elements before modifying them to avoid errors.
- Use meaningful variable names when storing child elements for better code readability.
- Group similar modifications together to improve code organization.
- Consider creating helper functions for common customizations to reduce code duplication.
Here’s an example that demonstrates these best practices:
import matplotlib.pyplot as plt

def customize_tick_labels(axis, font_size=12, color='black'):
    for child in axis.get_children():
        if isinstance(child, plt.Text):
            child.set_fontsize(font_size)
            child.set_color(color)

def customize_tick_marks(axis, size=6, width=1, color='black'):
    for child in axis.get_children():
        if isinstance(child, plt.Line2D):
            child.set_markersize(size)
            child.set_markeredgewidth(width)
            child.set_color(color)

fig, ax = plt.subplots()
ax.plot([1, 2, 3, 4], [1, 4, 2, 3], label='Data from how2matplotlib.com')

customize_tick_labels(ax.xaxis, font_size=14, color='blue')
customize_tick_labels(ax.yaxis, font_size=14, color='red')
customize_tick_marks(ax.xaxis, size=8, width=2, color='blue')
customize_tick_marks(ax.yaxis, size=8, width=2, color='red')

plt.show()
Output:
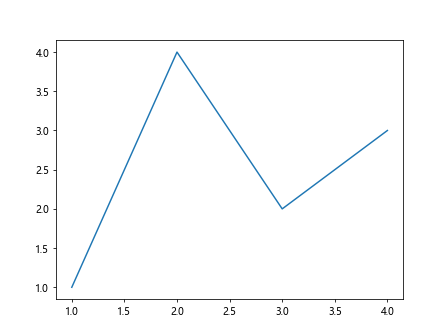
This example demonstrates how to create reusable functions for customizing tick labels and tick marks, making the code more organized and easier to maintain.
Common Pitfalls and How to Avoid Them
When working with the Matplotlib.axis.Axis.get_children() function, there are some common pitfalls that you should be aware of:
- Modifying the wrong child elements: Always check the type of child elements before modifying them.
- Forgetting to update the plot: Remember to call plt.draw() or plt.show() after making changes to see the updates.
- Overwriting existing customizations: Be cautious when applying global styles that might override specific customizations.
Here’s an example that demonstrates how to avoid these pitfalls:
import matplotlib.pyplot as plt

fig, ax = plt.subplots()
ax.plot([1, 2, 3, 4], [1, 4, 2, 3], label='Data from how2matplotlib.com')

# Custom style for x-axis
plt.setp(ax.xaxis.get_ticklabels(), fontsize=14, color='blue')

# Get y-axis children
y_children = ax.yaxis.get_children()

# Customize y-axis elements without overwriting x-axis styles
for child in y_children:
    if isinstance(child, plt.Text):
        child.set_fontsize(12)
        child.set_color('red')
    elif isinstance(child, plt.Line2D):
        child.set_markersize(8)
        child.set_markeredgewidth(2)
        child.set_color('red')

# Update the plot
plt.draw()
plt.show()
Output:
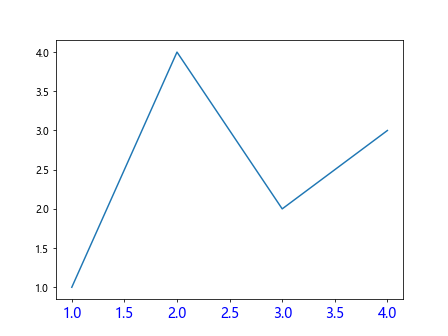
This example demonstrates how to apply custom styles to specific axes while avoiding overwriting existing customizations.
Matplotlib.axis.Axis.get_children() in Different Plot Types
The Matplotlib.axis.Axis.get_children() function can be used with various types of plots in Matplotlib. Let’s explore how to use it with different plot types:
Bar Plot
import matplotlib.pyplot as plt

fig, ax = plt.subplots()
ax.bar(['A', 'B', 'C', 'D'], [1, 4, 2, 3], label='Data from how2matplotlib.com')

# Customize x-axis tick labels
x_children = ax.xaxis.get_children()
for child in x_children:
    if isinstance(child, plt.Text):
        child.set_fontweight('bold')
        child.set_fontsize(14)

plt.show()
Output:
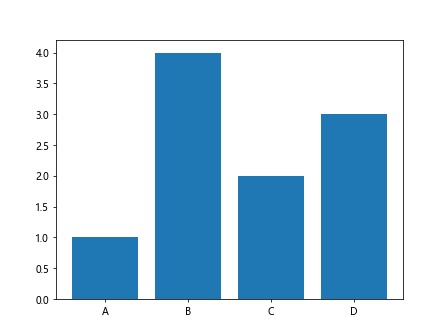
This example demonstrates how to use the Matplotlib.axis.Axis.get_children() function to customize tick labels in a bar plot.
Scatter Plot
import matplotlib.pyplot as plt
import numpy as np

fig, ax = plt.subplots()
x = np.random.rand(50)
y = np.random.rand(50)
colors = np.random.rand(50)
sizes = 1000 * np.random.rand(50)

scatter = ax.scatter(x, y, c=colors, s=sizes, alpha=0.5, label='Data from how2matplotlib.com')

# Customize y-axis tick marks
y_children = ax.yaxis.get_children()
for child in y_children:
    if isinstance(child, plt.Line2D):
        child.set_markersize(10)
        child.set_markeredgewidth(2)
        child.set_color('red')

plt.show()
Output:
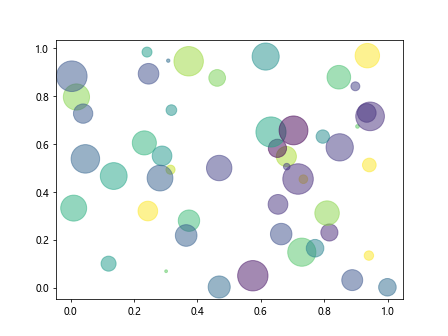
This example shows how to use the Matplotlib.axis.Axis.get_children() function to customize tick marks in a scatter plot.
Advanced Techniques with Matplotlib.axis.Axis.get_children()
Let’s explore some advanced techniques using the Matplotlib.axis.Axis.get_children() function:
Creating a Custom Axis Decorator
import matplotlib.pyplot as plt

def add_axis_decorator(axis, text, position):
    children = axis.get_children()
    for child in children:
        if isinstance(child, plt.Text) and child.get_position() == position:
            child.set_text(f"{child.get_text()} {text}")
            child.set_fontweight('bold')
            break

fig, ax = plt.subplots()
ax.plot([1, 2, 3, 4], [1, 4, 2, 3], label='Data from how2matplotlib.com')

add_axis_decorator(ax.xaxis, '(units)', (1, 0))
add_axis_decorator(ax.yaxis, '(values)', (0, 1))

plt.show()
Output:
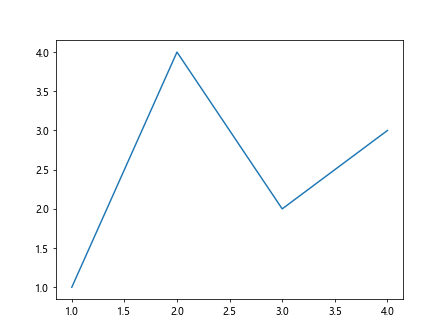
This example demonstrates how to create a custom axis decorator function using the Matplotlib.axis.Axis.get_children() function to add additional information to axis labels.
Matplotlib.axis.Axis.get_children() in 3D Plots
The Matplotlib.axis.Axis.get_children() function can also be used with 3D plots. Let’s explore an example:
import matplotlib.pyplot as plt
from mpl_toolkits.mplot3d import Axes3D
import numpy as np

fig = plt.figure()
ax = fig.add_subplot(111, projection='3d')

# Create data
x = np.linspace(-5, 5, 100)
y = np.linspace(-5, 5, 100)
X, Y = np.meshgrid(x, y)
Z = np.sin(np.sqrt(X**2 + Y**2))

# Plot surface
surf = ax.plot_surface(X, Y, Z, cmap='viridis', label='Surface from how2matplotlib.com')

# Customize z-axis using get_children()
z_children = ax.zaxis.get_children()
for child in z_children:
    if isinstance(child, plt.Text):
        child.set_fontsize(12)
        child.set_color('red')

plt.show()
Output:
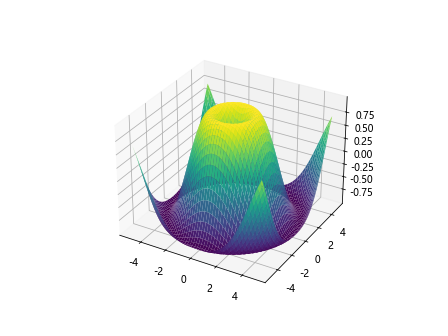
This example demonstrates how to use the Matplotlib.axis.Axis.get_children() function to customize the z-axis labels in a 3D surface plot.
Combining Matplotlib.axis.Axis.get_children() with Animation
The Matplotlib.axis.Axis.get_children() function can be used in combination with animation to create dynamic plots. Here’s an example:
import matplotlib.pyplot as plt
import matplotlib.animation as animation
import numpy as np

fig, ax = plt.subplots()
x = np.linspace(0, 2*np.pi, 100)
line, = ax.plot(x, np.sin(x), label='Sine wave from how2matplotlib.com')

def animate(frame):
    line.set_ydata(np.sin(x + frame/10))

    # Customize y-axis tick labels dynamically
    y_children = ax.yaxis.get_children()
    for child in y_children:
        if isinstance(child, plt.Text):
            child.set_color(plt.cm.viridis(frame/100))

    return line,

ani = animation.FuncAnimation(fig, animate, frames=100, interval=50, blit=True)

plt.show()
Output:
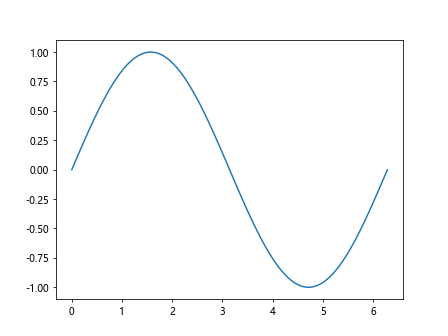
This example demonstrates how to use the Matplotlib.axis.Axis.get_children() function within an animation to dynamically change the color of y-axis tick labels.
Performance Considerations
When using the Matplotlib.axis.Axis.get_children() function, it’s important to consider performance, especially when working with large or complex plots. Here are some tips to optimize performance:
- Minimize the number of times you call get_children() by storing the results in a variable.
- Use list comprehensions or generator expressions for more efficient filtering of child elements.
- Avoid unnecessary modifications to child elements in loops or animations.
Here’s an example that demonstrates these performance optimizations:
import matplotlib.pyplot as plt
import numpy as np

fig, ax = plt.subplots()

# Plot a large number of points
x = np.linspace(0, 10, 1000)
y = np.sin(x) + np.random.normal(0, 0.1, 1000)
ax.plot(x, y, label='Data from how2matplotlib.com')

# Get all axis children once
all_children = ax.xaxis.get_children() + ax.yaxis.get_children()

# Use list comprehension for efficient filtering
tick_labels = [child for child in all_children if isinstance(child, plt.Text)]
tick_marks = [child for child in all_children if isinstance(child, plt.Line2D)]

# Modify tick labels and marks efficiently
for label in tick_labels:
    label.set_fontsize(10)
    label.set_color('navy')

for mark in tick_marks:
    mark.set_markersize(4)
    mark.set_color('red')

plt.show()
Output:
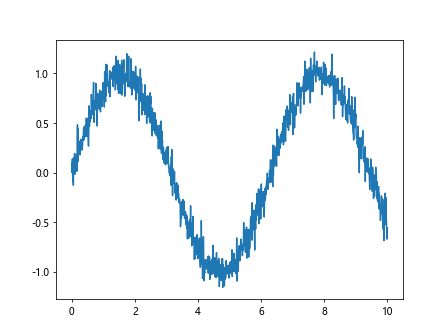
This example demonstrates how to optimize performance when working with a large number of data points and axis children.
Troubleshooting Common Issues
When working with the Matplotlib.axis.Axis.get_children() function, you may encounter some common issues. Here are some troubleshooting tips:
- If changes to axis children are not visible, make sure to call plt.draw() or plt.show() after making modifications.
- If you’re having trouble identifying specific child elements, use the type() function to print the types of all children.
- If customizations are not applied correctly, check that you’re modifying the correct axis (e.g., xaxis vs. yaxis).
Here’s an example that demonstrates these troubleshooting techniques:
import matplotlib.pyplot as plt

fig, ax = plt.subplots()
ax.plot([1, 2, 3, 4], [1, 4, 2, 3], label='Data from how2matplotlib.com')

# Get all axis children
all_children = ax.xaxis.get_children() + ax.yaxis.get_children()

# Print types of all children
print("Types of axis children:")
for child in all_children:
    print(type(child))

# Modify x-axis tick labels
x_labels = [child for child in ax.xaxis.get_children() if isinstance(child, plt.Text)]
for label in x_labels:
    label.set_fontsize(14)
    label.set_color('blue')

# Modify y-axis tick marks
y_marks = [child for child in ax.yaxis.get_children() if isinstance(child, plt.Line2D)]
for mark in y_marks:
    mark.set_markersize(8)
    mark.set_color('red')

# Update the plot
plt.draw()
plt.show()
Output:
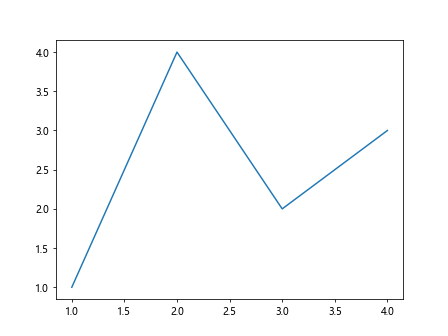
This example demonstrates how to troubleshoot common issues by printing the types of all axis children and ensuring that modifications are applied to the correct axis elements.
Conclusion
The Matplotlib.axis.Axis.get_children() function is a powerful tool for customizing and manipulating axis elements in Matplotlib plots. Throughout this comprehensive guide, we’ve explored various aspects of this function, including its basic usage, advanced applications, best practices, and common pitfalls to avoid.
By mastering the Matplotlib.axis.Axis.get_children() function, you can create highly customized and professional-looking plots that effectively communicate your data. Remember to experiment with different customizations and combinations to find the perfect visual representation for your specific needs.