How to Use Matplotlib Button Widget
Matplotlib Button Widget is a powerful tool for creating interactive visualizations in Python. This article will provide an in-depth exploration of the Matplotlib Button Widget, covering its features, implementation, and various use cases. We’ll dive into the details of how to create, customize, and utilize button widgets to enhance your data visualization projects.
Introduction to Matplotlib Button Widget
Matplotlib Button Widget is an essential component of the Matplotlib library, which is widely used for creating static, animated, and interactive visualizations in Python. The Button Widget allows users to add clickable buttons to their plots, enabling interactive elements within the visualization. This feature is particularly useful when you want to create dynamic plots that respond to user input or when you need to trigger specific actions based on button clicks.
Let’s start with a simple example of how to create a basic Matplotlib Button Widget:
import matplotlib.pyplot as plt
from matplotlib.widgets import Button

fig, ax = plt.subplots()
ax.set_title("How to use Matplotlib Button Widget - how2matplotlib.com")

def on_button_click(event):
    print("Button clicked!")

button_ax = plt.axes([0.7, 0.05, 0.1, 0.075])
button = Button(button_ax, 'Click me!')
button.on_clicked(on_button_click)

plt.show()
Output:
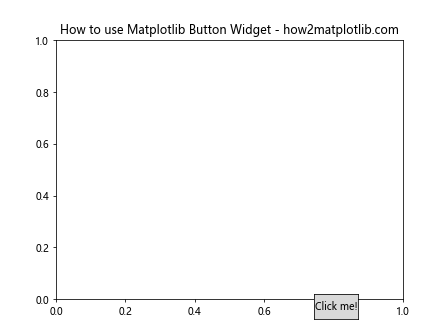
In this example, we create a simple button labeled “Click me!” in the lower right corner of the plot. When clicked, it will print “Button clicked!” to the console. This demonstrates the basic structure of creating and using a Matplotlib Button Widget.
Creating Matplotlib Button Widgets
To create a Matplotlib Button Widget, you need to follow these steps:
- Import the necessary modules
- Create a figure and axes
- Define a callback function
- Create a button axes
- Instantiate the Button widget
- Connect the button to the callback function
Let’s explore each of these steps in more detail:
Importing Modules
To use Matplotlib Button Widget, you need to import the required modules:
import matplotlib.pyplot as plt
from matplotlib.widgets import Button
Creating Figure and Axes
Before adding a button, you need to create a figure and axes for your plot:
fig, ax = plt.subplots()
ax.set_title("Matplotlib Button Widget Example - how2matplotlib.com")
Defining a Callback Function
The callback function is executed when the button is clicked. It should define the action you want to perform:
def on_button_click(event):
    print("Button clicked on how2matplotlib.com!")
Creating Button Axes
To position the button on your plot, you need to create a separate axes for it:
button_ax = plt.axes([0.7, 0.05, 0.1, 0.075])
The parameters [0.7, 0.05, 0.1, 0.075] represent the position and size of the button in normalized figure coordinates (left, bottom, width, height).
Instantiating the Button Widget
Now you can create the Button widget:
button = Button(button_ax, 'Click me!')
Connecting the Button to the Callback Function
Finally, connect the button to the callback function:
button.on_clicked(on_button_click)
Customizing Matplotlib Button Widgets
Matplotlib Button Widget offers various customization options to enhance the appearance and functionality of your buttons. Let’s explore some of these options:
Changing Button Colors
You can customize the color of the button and its text:
import matplotlib.pyplot as plt
from matplotlib.widgets import Button

fig, ax = plt.subplots()
ax.set_title("Customized Button Colors - how2matplotlib.com")

def on_button_click(event):
    print("Colorful button clicked!")

button_ax = plt.axes([0.7, 0.05, 0.2, 0.075])
button = Button(button_ax, 'Colorful Button', color='lightblue', hovercolor='lightgreen')
button.on_clicked(on_button_click)

plt.show()
Output:
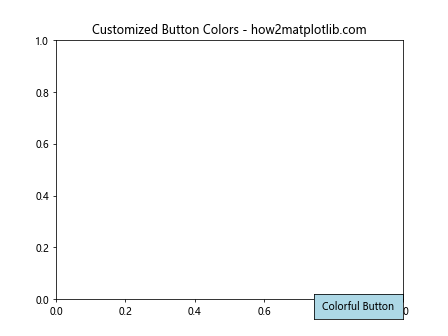
In this example, we set the button’s color to light blue and its hover color to light green.
Adjusting Button Size and Position
You can adjust the size and position of the button by modifying the axes parameters:
import matplotlib.pyplot as plt
from matplotlib.widgets import Button

fig, ax = plt.subplots()
ax.set_title("Adjusted Button Size and Position - how2matplotlib.com")

def on_button_click(event):
    print("Large button clicked!")

button_ax = plt.axes([0.3, 0.8, 0.4, 0.15])
button = Button(button_ax, 'Large Button')
button.on_clicked(on_button_click)

plt.show()
Output:
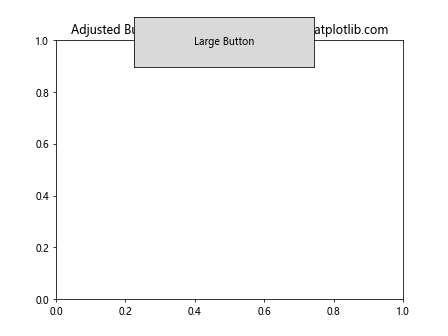
This example creates a larger button positioned at the top of the plot.
Customizing Button Text
You can customize the button’s text properties, such as font size, weight, and style:
import matplotlib.pyplot as plt
from matplotlib.widgets import Button

fig, ax = plt.subplots()
ax.set_title("Customized Button Text - how2matplotlib.com")

def on_button_click(event):
    print("Stylish button clicked!")

button_ax = plt.axes([0.7, 0.05, 0.2, 0.075])
button = Button(button_ax, 'Stylish Button')
button.label.set_fontsize(14)
button.label.set_weight('bold')
button.label.set_style('italic')
button.on_clicked(on_button_click)

plt.show()
Output:
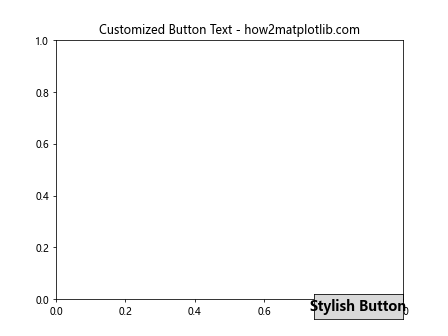
This example demonstrates how to change the font size, weight, and style of the button text.
Using Multiple Matplotlib Button Widgets
In many cases, you might want to use multiple buttons in your visualization. Let’s explore how to create and manage multiple Matplotlib Button Widgets:
import matplotlib.pyplot as plt
from matplotlib.widgets import Button

fig, ax = plt.subplots()
ax.set_title("Multiple Buttons Example - how2matplotlib.com")

def button1_click(event):
    print("Button 1 clicked on how2matplotlib.com!")

def button2_click(event):
    print("Button 2 clicked on how2matplotlib.com!")

def button3_click(event):
    print("Button 3 clicked on how2matplotlib.com!")

button1_ax = plt.axes([0.2, 0.05, 0.1, 0.075])
button2_ax = plt.axes([0.45, 0.05, 0.1, 0.075])
button3_ax = plt.axes([0.7, 0.05, 0.1, 0.075])

button1 = Button(button1_ax, 'Button 1')
button2 = Button(button2_ax, 'Button 2')
button3 = Button(button3_ax, 'Button 3')

button1.on_clicked(button1_click)
button2.on_clicked(button2_click)
button3.on_clicked(button3_click)

plt.show()
Output:
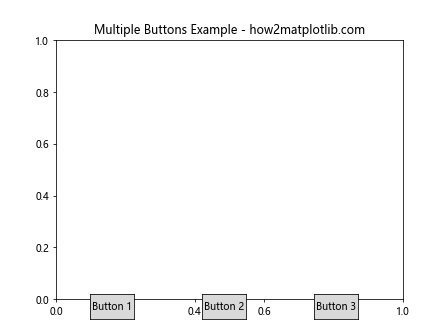
This example creates three buttons with different callback functions, demonstrating how to manage multiple Matplotlib Button Widgets in a single plot.
Integrating Matplotlib Button Widget with Plots
One of the most powerful features of Matplotlib Button Widget is its ability to interact with and modify plots. Let’s explore some examples of how to use buttons to manipulate plot elements:
Changing Plot Data
Here’s an example of using a button to change the data displayed in a plot:
import matplotlib.pyplot as plt
import numpy as np
from matplotlib.widgets import Button

fig, ax = plt.subplots()
ax.set_title("Change Plot Data - how2matplotlib.com")

x = np.linspace(0, 10, 100)
line, = ax.plot(x, np.sin(x))

def update_plot(event):
    new_y = np.cos(x)
    line.set_ydata(new_y)
    ax.set_ylim(min(new_y), max(new_y))
    plt.draw()

button_ax = plt.axes([0.7, 0.05, 0.1, 0.075])
button = Button(button_ax, 'Update')
button.on_clicked(update_plot)

plt.show()
Output:
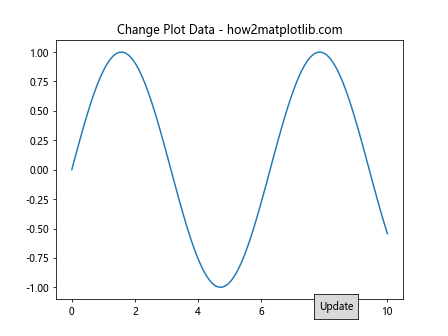
This example creates a plot of the sine function and adds a button that, when clicked, updates the plot to show the cosine function instead.
Toggling Plot Elements
You can use buttons to toggle the visibility of plot elements:
import matplotlib.pyplot as plt
import numpy as np
from matplotlib.widgets import Button

fig, ax = plt.subplots()
ax.set_title("Toggle Plot Elements - how2matplotlib.com")

x = np.linspace(0, 10, 100)
line1, = ax.plot(x, np.sin(x), label='Sin')
line2, = ax.plot(x, np.cos(x), label='Cos', visible=False)
ax.legend()

def toggle_lines(event):
    line1.set_visible(not line1.get_visible())
    line2.set_visible(not line2.get_visible())
    plt.draw()

button_ax = plt.axes([0.7, 0.05, 0.1, 0.075])
button = Button(button_ax, 'Toggle')
button.on_clicked(toggle_lines)

plt.show()
Output:
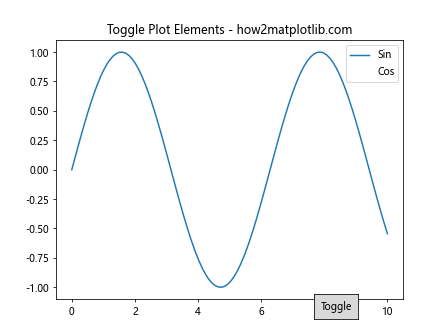
This example creates two lines (sine and cosine) and adds a button that toggles their visibility when clicked.
Zooming and Panning
You can use buttons to implement zooming and panning functionality:
import matplotlib.pyplot as plt
import numpy as np
from matplotlib.widgets import Button

fig, ax = plt.subplots()
ax.set_title("Zoom and Pan - how2matplotlib.com")

x = np.linspace(0, 10, 100)
ax.plot(x, np.sin(x))

def zoom_in(event):
    ax.set_xlim(ax.get_xlim()[0] * 1.5, ax.get_xlim()[1] * 0.5)
    ax.set_ylim(ax.get_ylim()[0] * 1.5, ax.get_ylim()[1] * 0.5)
    plt.draw()

def zoom_out(event):
    ax.set_xlim(ax.get_xlim()[0] * 0.5, ax.get_xlim()[1] * 1.5)
    ax.set_ylim(ax.get_ylim()[0] * 0.5, ax.get_ylim()[1] * 1.5)
    plt.draw()

def pan_left(event):
    ax.set_xlim(ax.get_xlim()[0] - 1, ax.get_xlim()[1] - 1)
    plt.draw()

def pan_right(event):
    ax.set_xlim(ax.get_xlim()[0] + 1, ax.get_xlim()[1] + 1)
    plt.draw()

zoom_in_ax = plt.axes([0.7, 0.15, 0.1, 0.075])
zoom_out_ax = plt.axes([0.81, 0.15, 0.1, 0.075])
pan_left_ax = plt.axes([0.7, 0.05, 0.1, 0.075])
pan_right_ax = plt.axes([0.81, 0.05, 0.1, 0.075])

zoom_in_button = Button(zoom_in_ax, 'Zoom In')
zoom_out_button = Button(zoom_out_ax, 'Zoom Out')
pan_left_button = Button(pan_left_ax, 'Pan Left')
pan_right_button = Button(pan_right_ax, 'Pan Right')

zoom_in_button.on_clicked(zoom_in)
zoom_out_button.on_clicked(zoom_out)
pan_left_button.on_clicked(pan_left)
pan_right_button.on_clicked(pan_right)

plt.show()
Output:
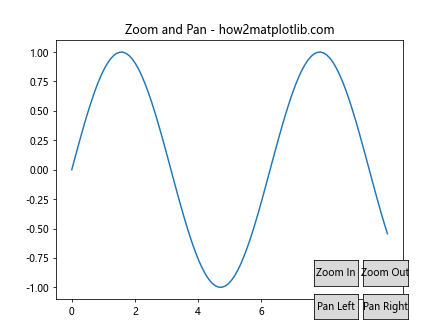
This example adds four buttons that allow the user to zoom in, zoom out, pan left, and pan right on the plot.
Advanced Matplotlib Button Widget Techniques
Now that we’ve covered the basics of Matplotlib Button Widget, let’s explore some advanced techniques to further enhance your visualizations:
Creating Radio Buttons
While not strictly a Button Widget, radio buttons are closely related and can be useful in many scenarios:
import matplotlib.pyplot as plt
import numpy as np
from matplotlib.widgets import RadioButtons

fig, ax = plt.subplots()
ax.set_title("Radio Buttons Example - how2matplotlib.com")

x = np.linspace(0, 10, 100)
line, = ax.plot(x, np.sin(x))

def update_plot(label):
    if label == 'Sin':
        line.set_ydata(np.sin(x))
    elif label == 'Cos':
        line.set_ydata(np.cos(x))
    elif label == 'Tan':
        line.set_ydata(np.tan(x))
    ax.set_ylim(min(line.get_ydata()), max(line.get_ydata()))
    plt.draw()

radio_ax = plt.axes([0.05, 0.7, 0.15, 0.15])
radio = RadioButtons(radio_ax, ('Sin', 'Cos', 'Tan'))
radio.on_clicked(update_plot)

plt.show()
Output:
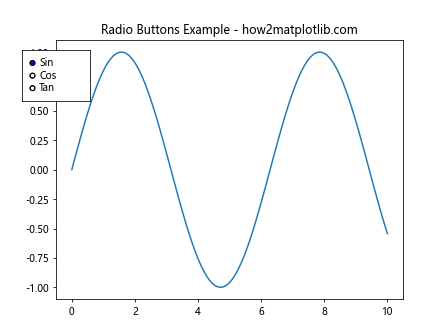
This example creates a set of radio buttons that allow the user to switch between sine, cosine, and tangent functions in the plot.
Implementing a Reset Button
A reset button can be useful to return the plot to its initial state:
import matplotlib.pyplot as plt
import numpy as np
from matplotlib.widgets import Button

fig, ax = plt.subplots()
ax.set_title("Reset Button Example - how2matplotlib.com")

x = np.linspace(0, 10, 100)
initial_y = np.sin(x)
line, = ax.plot(x, initial_y)

def update_plot(event):
    new_y = np.random.rand(100)
    line.set_ydata(new_y)
    ax.set_ylim(min(new_y), max(new_y))
    plt.draw()

def reset_plot(event):
    line.set_ydata(initial_y)
    ax.set_ylim(-1, 1)
    plt.draw()

update_ax = plt.axes([0.7, 0.05, 0.1, 0.075])
reset_ax = plt.axes([0.81, 0.05, 0.1, 0.075])

update_button = Button(update_ax, 'Update')
reset_button = Button(reset_ax, 'Reset')

update_button.on_clicked(update_plot)
reset_button.on_clicked(reset_plot)

plt.show()
Output:
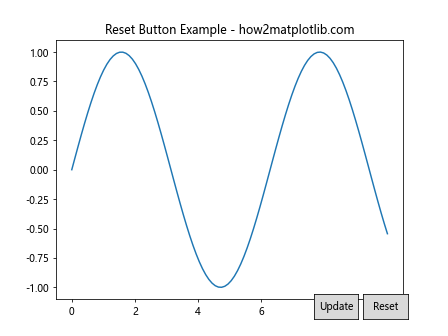
This example adds an “Update” button that changes the plot to random data and a “Reset” button that returns the plot to its initial sine wave.
Creating a Button to Save the Plot
You can use a button to save the current state of the plot:
import matplotlib.pyplot as plt
import numpy as np
from matplotlib.widgets import Button

fig, ax = plt.subplots()
ax.set_title("Save Plot Button Example - how2matplotlib.com")

x = np.linspace(0, 10, 100)
ax.plot(x, np.sin(x))

def save_plot(event):
    plt.savefig('how2matplotlib_plot.png')
    print("Plot saved as how2matplotlib_plot.png")

save_ax = plt.axes([0.7, 0.05, 0.1, 0.075])
save_button = Button(save_ax, 'Save')
save_button.on_clicked(save_plot)

plt.show()
Output:
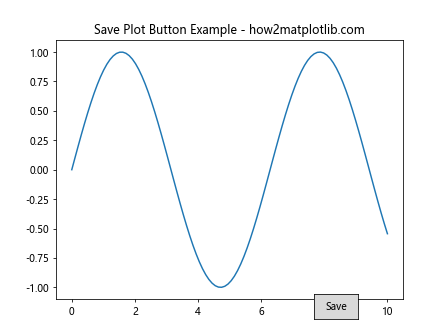
This example adds a “Save” button that, when clicked, saves the current plot as a PNG file.
Implementing a Play/Pause Button forAnimations
Matplotlib Button Widget can be used to control animations. Here’s an example of implementing a play/pause button for an animated plot:
import matplotlib.pyplot as plt
import numpy as np
from matplotlib.widgets import Button
from matplotlib.animation import FuncAnimation

fig, ax = plt.subplots()
ax.set_title("Play/Pause Animation - how2matplotlib.com")

x = np.linspace(0, 2 * np.pi, 100)
line, = ax.plot(x, np.sin(x))

animation_running = True

def animate(frame):
    if animation_running:
        line.set_ydata(np.sin(x + frame / 10))
    return line,

def toggle_animation(event):
    global animation_running
    animation_running = not animation_running

anim = FuncAnimation(fig, animate, frames=200, interval=50, blit=True)

button_ax = plt.axes([0.7, 0.05, 0.1, 0.075])
button = Button(button_ax, 'Play/Pause')
button.on_clicked(toggle_animation)

plt.show()
Output:
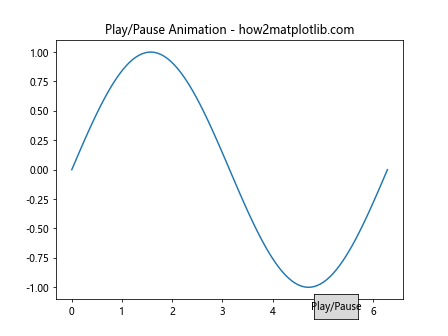
This example creates an animated sine wave and adds a “Play/Pause” button that toggles the animation on and off.
Best Practices for Using Matplotlib Button Widget
When working with Matplotlib Button Widget, it’s important to follow some best practices to ensure your visualizations are effective and user-friendly:
- Keep button labels clear and concise
- Use consistent positioning for related buttons
- Provide visual feedback when buttons are clicked
- Limit the number of buttons to avoid cluttering the plot
- Use appropriate colors and styles to make buttons stand out
- Ensure buttons are large enough to be easily clickable
- Add tooltips or help text for complex button functions
Let’s implement some of these best practices in an example:
import matplotlib.pyplot as plt
import numpy as np
from matplotlib.widgets import Button

fig, ax = plt.subplots(figsize=(10, 6))
ax.set_title("Best Practices Example - how2matplotlib.com")

x = np.linspace(0, 10, 100)
line, = ax.plot(x, np.sin(x))

def update_sin(event):
    line.set_ydata(np.sin(x))
    ax.set_ylim(-1, 1)
    plt.draw()

def update_cos(event):
    line.set_ydata(np.cos(x))
    ax.set_ylim(-1, 1)
    plt.draw()

def update_tan(event):
    line.set_ydata(np.tan(x))
    ax.set_ylim(-10, 10)
    plt.draw()

sin_ax = plt.axes([0.7, 0.15, 0.1, 0.075])
cos_ax = plt.axes([0.81, 0.15, 0.1, 0.075])
tan_ax = plt.axes([0.7, 0.05, 0.1, 0.075])

sin_button = Button(sin_ax, 'Sin', color='lightblue', hovercolor='skyblue')
cos_button = Button(cos_ax, 'Cos', color='lightgreen', hovercolor='limegreen')
tan_button = Button(tan_ax, 'Tan', color='lightsalmon', hovercolor='salmon')

sin_button.on_clicked(update_sin)
cos_button.on_clicked(update_cos)
tan_button.on_clicked(update_tan)

# Add tooltips
sin_button.ax.set_title('Plot sine function', fontsize=8)
cos_button.ax.set_title('Plot cosine function', fontsize=8)
tan_button.ax.set_title('Plot tangent function', fontsize=8)

plt.show()
Output:
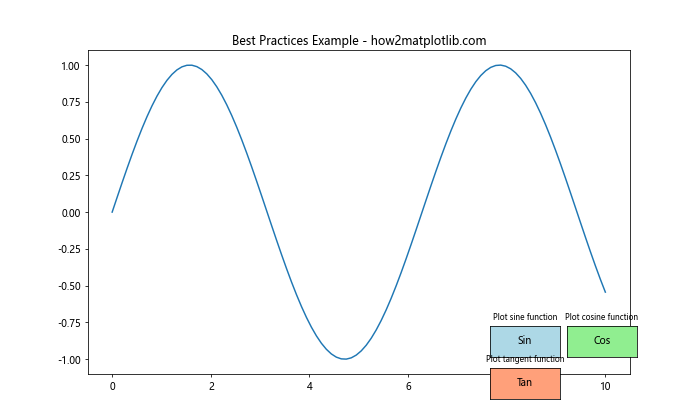
This example demonstrates several best practices:
- Clear and concise button labels
- Consistent positioning for related buttons
- Distinct colors for each button
- Tooltips for additional information
- Appropriate button sizes
Troubleshooting Common Issues with Matplotlib Button Widget
When working with Matplotlib Button Widget, you may encounter some common issues. Here are some problems and their solutions:
Buttons Not Responding
If your buttons are not responding to clicks, check the following:
- Ensure that you’ve connected the button to a callback function using
button.on_clicked(callback_function). - Make sure your callback function is defined correctly and takes an
eventparameter. - Verify that
plt.show()is called at the end of your script to display the plot and enable interactivity.
Buttons Appearing Outside the Plot
If buttons appear outside the plot area, adjust their position using the axes coordinates:
import matplotlib.pyplot as plt
from matplotlib.widgets import Button

fig, ax = plt.subplots()
ax.set_title("Button Position Fix - how2matplotlib.com")

def on_button_click(event):
    print("Button clicked!")

button_ax = plt.axes([0.7, 0.05, 0.1, 0.075])
button = Button(button_ax, 'Click me!')
button.on_clicked(on_button_click)

plt.tight_layout()
plt.show()
Output:
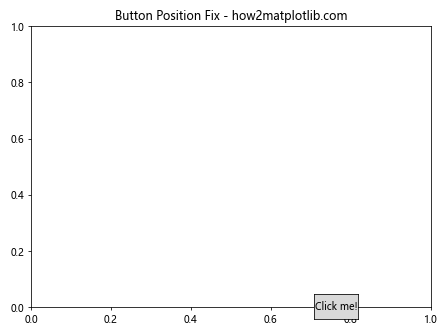
Using plt.tight_layout() can help adjust the plot layout to accommodate the buttons.
Button Text Overlapping
If button text is overlapping or cut off, you can adjust the button size or reduce the font size:
import matplotlib.pyplot as plt
from matplotlib.widgets import Button

fig, ax = plt.subplots()
ax.set_title("Button Text Fix - how2matplotlib.com")

def on_button_click(event):
    print("Button clicked!")

button_ax = plt.axes([0.7, 0.05, 0.2, 0.075])
button = Button(button_ax, 'Long Button Text')
button.label.set_fontsize(8)
button.on_clicked(on_button_click)

plt.show()
Output:
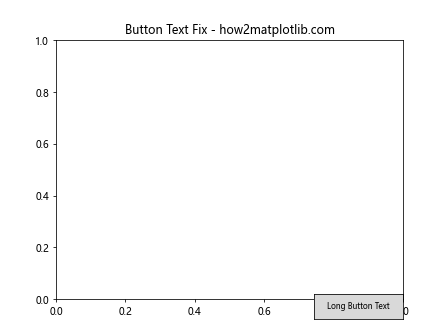
This example increases the button width and reduces the font size to accommodate longer text.
Advanced Applications of Matplotlib Button Widget
Matplotlib Button Widget can be used in various advanced applications to create interactive and dynamic visualizations. Let’s explore some of these applications:
Interactive Data Explorer
Create an interactive data explorer that allows users to switch between different datasets:
import matplotlib.pyplot as plt
import numpy as np
from matplotlib.widgets import Button

fig, ax = plt.subplots()
ax.set_title("Interactive Data Explorer - how2matplotlib.com")

x = np.linspace(0, 10, 100)
datasets = {
    'Dataset 1': np.sin(x),
    'Dataset 2': np.cos(x),
    'Dataset 3': np.tan(x),
    'Dataset 4': x**2
}

line, = ax.plot(x, datasets['Dataset 1'])
ax.set_ylim(-10, 10)

def update_plot(dataset):
    def update(event):
        line.set_ydata(datasets[dataset])
        ax.set_title(f"Interactive Data Explorer - {dataset}")
        plt.draw()
    return update

button_height = 0.075
button_width = 0.15
for i, dataset in enumerate(datasets):
    button_ax = plt.axes([0.7, 0.8 - i * 0.1, button_width, button_height])
    button = Button(button_ax, dataset)
    button.on_clicked(update_plot(dataset))

plt.show()
Output:
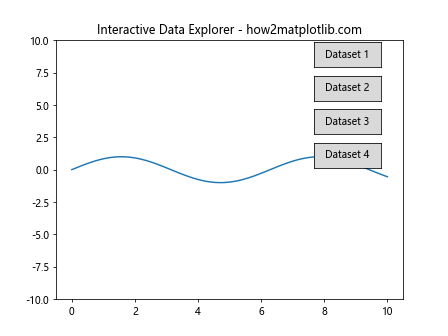
This example creates buttons for different datasets, allowing users to switch between them interactively.
Parameter Tuning Interface
Create an interface for tuning parameters of a function:
import matplotlib.pyplot as plt
import numpy as np
from matplotlib.widgets import Button, Slider

fig, ax = plt.subplots()
ax.set_title("Parameter Tuning Interface - how2matplotlib.com")

x = np.linspace(0, 10, 100)
a, b, c = 1, 1, 0
line, = ax.plot(x, a * np.sin(b * x + c))

def update_plot(val):
    a = a_slider.val
    b = b_slider.val
    c = c_slider.val
    line.set_ydata(a * np.sin(b * x + c))
    plt.draw()

def reset(event):
    a_slider.reset()
    b_slider.reset()
    c_slider.reset()

a_slider_ax = plt.axes([0.25, 0.1, 0.65, 0.03])
b_slider_ax = plt.axes([0.25, 0.15, 0.65, 0.03])
c_slider_ax = plt.axes([0.25, 0.2, 0.65, 0.03])

a_slider = Slider(a_slider_ax, 'Amplitude', 0.1, 5.0, valinit=a)
b_slider = Slider(b_slider_ax, 'Frequency', 0.1, 5.0, valinit=b)
c_slider = Slider(c_slider_ax, 'Phase', 0, 2*np.pi, valinit=c)

a_slider.on_changed(update_plot)
b_slider.on_changed(update_plot)
c_slider.on_changed(update_plot)

reset_ax = plt.axes([0.8, 0.025, 0.1, 0.04])
reset_button = Button(reset_ax, 'Reset')
reset_button.on_clicked(reset)

plt.show()
Output:
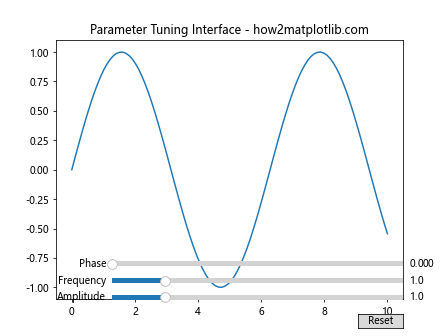
This example combines sliders for parameter tuning with a reset button, demonstrating how Matplotlib Button Widget can be used in conjunction with other widgets.
Conclusion
Matplotlib Button Widget is a powerful tool for creating interactive visualizations in Python. Throughout this article, we’ve explored various aspects of using and customizing button widgets, from basic implementation to advanced applications. We’ve covered topics such as:
- Creating and customizing buttons
- Using multiple buttons in a single plot
- Integrating buttons with plot elements
- Implementing advanced features like animations and parameter tuning
- Best practices for using button widgets
- Troubleshooting common issues
By mastering Matplotlib Button Widget, you can create more engaging and interactive data visualizations that allow users to explore and manipulate data in real-time. Whether you’re building simple toggle switches or complex data exploration tools, Matplotlib Button Widget provides the flexibility and functionality to bring your visualizations to life.