Comprehensive Guide to Matplotlib.axis.Axis.get_animated() Function in Python
Matplotlib.axis.Axis.get_animated() function in Python is an essential method for working with animated axes in Matplotlib plots. This function allows you to retrieve the animation status of an axis, which can be crucial for creating dynamic and interactive visualizations. In this comprehensive guide, we’ll explore the Matplotlib.axis.Axis.get_animated() function in depth, covering its usage, applications, and providing numerous examples to help you master this powerful tool.
Understanding the Basics of Matplotlib.axis.Axis.get_animated()
The Matplotlib.axis.Axis.get_animated() function is a method of the Axis class in Matplotlib. Its primary purpose is to return a boolean value indicating whether the axis is currently set to be animated or not. This information is particularly useful when working with animations or when you need to check the status of an axis before performing certain operations.
Let’s start with a simple example to demonstrate how to use the Matplotlib.axis.Axis.get_animated() function:
import matplotlib.pyplot as plt

# Create a figure and axis
fig, ax = plt.subplots()

# Check if the x-axis is animated
is_animated = ax.xaxis.get_animated()

print(f"Is the x-axis animated? {is_animated}")

plt.title("how2matplotlib.com - Checking Axis Animation Status")
plt.show()
Output:
In this example, we create a simple plot and use the get_animated() function to check if the x-axis is animated. By default, axes are not animated, so the function will return False.
Setting and Getting Animation Status with Matplotlib.axis.Axis.get_animated()
To fully understand the Matplotlib.axis.Axis.get_animated() function, it’s important to know how to set the animation status of an axis. Let’s explore this with an example:
import matplotlib.pyplot as plt

# Create a figure and axis
fig, ax = plt.subplots()

# Set the x-axis to be animated
ax.xaxis.set_animated(True)

# Check if the x-axis is animated
is_animated = ax.xaxis.get_animated()

print(f"Is the x-axis animated? {is_animated}")

plt.title("how2matplotlib.com - Setting and Getting Animation Status")
plt.show()
Output:
In this example, we first set the x-axis to be animated using the set_animated() method, and then we use get_animated() to confirm the status. This time, the function will return True.
Combining Matplotlib.axis.Axis.get_animated() with Other Axis Properties
The Matplotlib.axis.Axis.get_animated() function can be used in conjunction with other axis properties to create more complex visualizations. Let’s explore an example that combines animation status with axis limits:
import matplotlib.pyplot as plt
import numpy as np

# Create data
x = np.linspace(0, 10, 100)
y = np.sin(x)

# Create figure and axis
fig, ax = plt.subplots()
line, = ax.plot(x, y)

# Set x-axis to be animated
ax.xaxis.set_animated(True)

# Check animation status and adjust axis limits
if ax.xaxis.get_animated():
    ax.set_xlim(0, 5)
else:
    ax.set_xlim(0, 10)

plt.title("how2matplotlib.com - Adjusting Axis Limits Based on Animation Status")
plt.show()
Output:
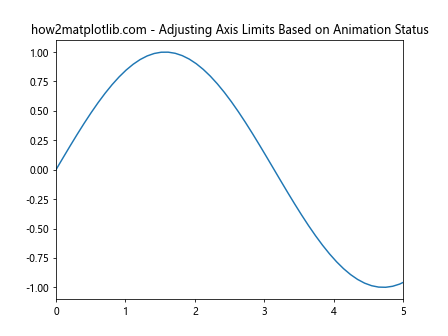
In this example, we adjust the x-axis limits based on whether the axis is animated or not. This demonstrates how the get_animated() function can be used to make decisions about plot appearance and behavior.
Matplotlib.axis.Axis.get_animated() and Multiple Axes
When working with multiple axes in a single figure, the Matplotlib.axis.Axis.get_animated() function can be used to manage the animation status of each axis independently. Let’s explore an example:
import matplotlib.pyplot as plt
import numpy as np

# Create figure with two subplots
fig, (ax1, ax2) = plt.subplots(2, 1, figsize=(8, 8))

# Create data
x = np.linspace(0, 10, 100)
y1 = np.sin(x)
y2 = np.cos(x)

# Plot data
line1, = ax1.plot(x, y1)
line2, = ax2.plot(x, y2)

# Set animation status for each axis
ax1.xaxis.set_animated(True)
ax2.xaxis.set_animated(False)

# Check and print animation status
print(f"Is ax1 x-axis animated? {ax1.xaxis.get_animated()}")
print(f"Is ax2 x-axis animated? {ax2.xaxis.get_animated()}")

plt.suptitle("how2matplotlib.com - Multiple Axes with Different Animation Status")
plt.show()
Output:
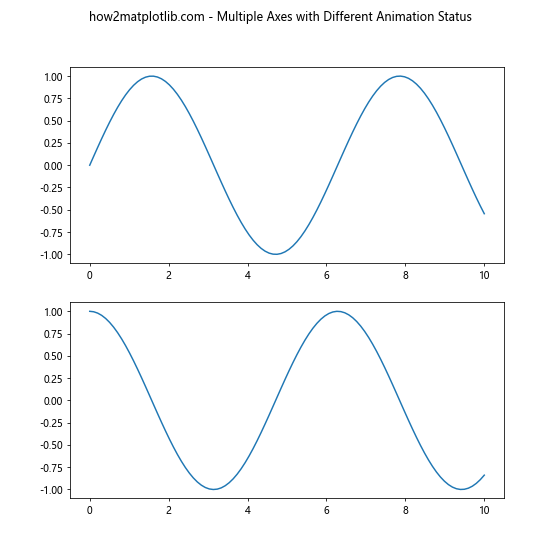
In this example, we create two subplots and set different animation statuses for their x-axes. We then use get_animated() to check and print the status of each axis.
Matplotlib.axis.Axis.get_animated() in Interactive Plots
The Matplotlib.axis.Axis.get_animated() function can be particularly useful when creating interactive plots. Let’s look at an example where we use a button to toggle the animation status of an axis:
import matplotlib.pyplot as plt
from matplotlib.widgets import Button
import numpy as np

# Create data
x = np.linspace(0, 10, 100)
y = np.sin(x)

# Create figure and axis
fig, ax = plt.subplots()
line, = ax.plot(x, y)

# Create a button to toggle animation
ax_button = plt.axes([0.8, 0.05, 0.1, 0.075])
button = Button(ax_button, 'Toggle')

def toggle_animation(event):
    current_status = ax.xaxis.get_animated()
    ax.xaxis.set_animated(not current_status)
    print(f"Animation status: {ax.xaxis.get_animated()}")
    plt.draw()

button.on_clicked(toggle_animation)

plt.title("how2matplotlib.com - Interactive Animation Toggle")
plt.show()
Output:
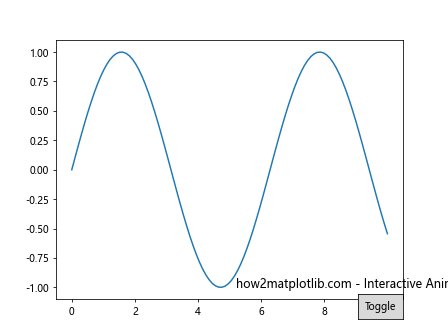
In this example, we create a button that toggles the animation status of the x-axis. The get_animated() function is used to check the current status before toggling.
Advanced Usage of Matplotlib.axis.Axis.get_animated()
For more advanced applications, the Matplotlib.axis.Axis.get_animated() function can be combined with other Matplotlib features to create complex visualizations. Let’s explore an example that uses animation status to control the appearance of multiple plot elements:
import matplotlib.pyplot as plt
import numpy as np

# Create data
x = np.linspace(0, 10, 100)
y1 = np.sin(x)
y2 = np.cos(x)

# Create figure and axis
fig, ax = plt.subplots()
line1, = ax.plot(x, y1, label='Sin')
line2, = ax.plot(x, y2, label='Cos')

# Set x-axis to be animated
ax.xaxis.set_animated(True)

# Adjust plot based on animation status
if ax.xaxis.get_animated():
    ax.set_facecolor('lightgray')
    ax.grid(True, linestyle='--')
    ax.legend(loc='upper right')
else:
    ax.set_facecolor('white')
    ax.grid(False)
    ax.legend(loc='upper left')

plt.title("how2matplotlib.com - Advanced Plot Customization Based on Animation Status")
plt.show()
Output:
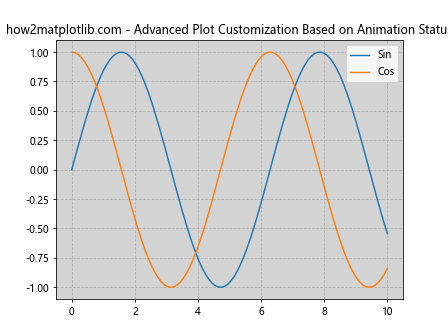
In this example, we use the animation status of the x-axis to control various aspects of the plot, including background color, grid visibility, and legend position.
Matplotlib.axis.Axis.get_animated() in Real-time Data Visualization
The Matplotlib.axis.Axis.get_animated() function can be particularly useful in real-time data visualization scenarios. Let’s look at an example that simulates real-time data updates:
import matplotlib.pyplot as plt
import numpy as np
from matplotlib.animation import FuncAnimation

# Create figure and axis
fig, ax = plt.subplots()
line, = ax.plot([], [])

# Set x-axis to be animated
ax.xaxis.set_animated(True)

# Initialize data
x_data = []
y_data = []

def update(frame):
    # Simulate new data point
    x_data.append(frame)
    y_data.append(np.sin(frame))

    # Update plot data
    line.set_data(x_data, y_data)

    # Adjust x-axis limit if animated
    if ax.xaxis.get_animated():
        ax.set_xlim(max(0, frame - 50), frame + 10)

    return line,

# Create animation
ani = FuncAnimation(fig, update, frames=np.linspace(0, 100, 500), interval=50, blit=True)

plt.title("how2matplotlib.com - Real-time Data Visualization")
plt.show()
Output:
In this example, we create a real-time plot that updates with new data points. The get_animated() function is used to determine whether the x-axis limits should be adjusted dynamically.
Matplotlib.axis.Axis.get_animated() and Subplots
When working with multiple subplots, the Matplotlib.axis.Axis.get_animated() function can be used to manage the animation status of individual axes. Let’s explore an example:
import matplotlib.pyplot as plt
import numpy as np

# Create figure with multiple subplots
fig, axs = plt.subplots(2, 2, figsize=(10, 10))

# Flatten the 2D array of axes for easier iteration
axs = axs.flatten()

# Create data
x = np.linspace(0, 10, 100)
y = np.sin(x)

# Plot data and set animation status for each subplot
for i, ax in enumerate(axs):
    ax.plot(x, y + i)
    ax.xaxis.set_animated(i % 2 == 0)  # Set every other x-axis as animated
    ax.set_title(f"Subplot {i+1}")

# Check and print animation status for each subplot
for i, ax in enumerate(axs):
    print(f"Is subplot {i+1} x-axis animated? {ax.xaxis.get_animated()}")

plt.suptitle("how2matplotlib.com - Multiple Subplots with Different Animation Status")
plt.tight_layout()
plt.show()
Output:
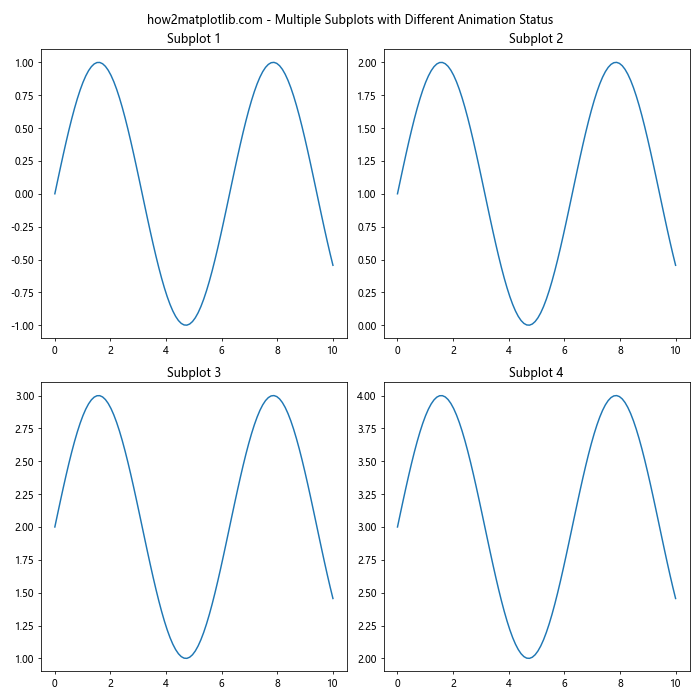
In this example, we create a 2×2 grid of subplots and set different animation statuses for their x-axes. We then use get_animated() to check and print the status of each axis.
Matplotlib.axis.Axis.get_animated() in 3D Plots
The Matplotlib.axis.Axis.get_animated() function can also be used with 3D plots. Let’s look at an example:
import matplotlib.pyplot as plt
from mpl_toolkits.mplot3d import Axes3D
import numpy as np

# Create figure and 3D axis
fig = plt.figure()
ax = fig.add_subplot(111, projection='3d')

# Create data
x = np.linspace(-5, 5, 100)
y = np.linspace(-5, 5, 100)
X, Y = np.meshgrid(x, y)
Z = np.sin(np.sqrt(X**2 + Y**2))

# Create surface plot
surf = ax.plot_surface(X, Y, Z, cmap='viridis')

# Set animation status for each axis
ax.xaxis.set_animated(True)
ax.yaxis.set_animated(False)# Check and print animation status for each axis
print(f"Is x-axis animated? {ax.xaxis.get_animated()}")
print(f"Is y-axis animated? {ax.yaxis.get_animated()}")

plt.title("how2matplotlib.com - 3D Plot with Different Axis Animation Status")
plt.show()
Output:
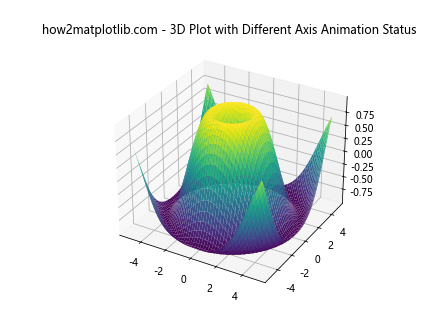
In this example, we create a 3D surface plot and set different animation statuses for the x and y axes. We then use get_animated() to check and print the status of each axis.
Matplotlib.axis.Axis.get_animated() and Custom Colormaps
The animation status of an axis can be used to control various aspects of a plot, including colormaps. Let’s explore an example that demonstrates this:
import matplotlib.pyplot as plt
import numpy as np

# Create data
x = np.linspace(0, 10, 100)
y = np.linspace(0, 10, 100)
X, Y = np.meshgrid(x, y)
Z = np.sin(X) * np.cos(Y)

# Create figure and axis
fig, ax = plt.subplots()

# Set x-axis to be animated
ax.xaxis.set_animated(True)

# Choose colormap based on animation status
if ax.xaxis.get_animated():
    cmap = 'viridis'
else:
    cmap = 'coolwarm'

# Create heatmap
im = ax.imshow(Z, cmap=cmap, extent=[0, 10, 0, 10])

# Add colorbar
plt.colorbar(im)

plt.title("how2matplotlib.com - Heatmap with Colormap Based on Animation Status")
plt.show()
Output:
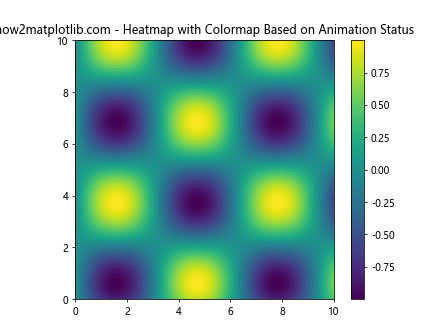
In this example, we create a heatmap and choose the colormap based on whether the x-axis is animated or not. This demonstrates how the get_animated() function can be used to control complex plot properties.
Matplotlib.axis.Axis.get_animated() in Polar Plots
The Matplotlib.axis.Axis.get_animated() function can also be used with polar plots. Let’s look at an example:
import matplotlib.pyplot as plt
import numpy as np

# Create data
r = np.linspace(0, 2, 100)
theta = 2 * np.pi * r

# Create figure and polar axis
fig, ax = plt.subplots(subplot_kw=dict(projection='polar'))

# Plot data
ax.plot(theta, r)

# Set animation status for radial axis
ax.yaxis.set_animated(True)

# Check and print animation status
print(f"Is radial axis animated? {ax.yaxis.get_animated()}")

plt.title("how2matplotlib.com - Polar Plot with Animated Radial Axis")
plt.show()
Output:
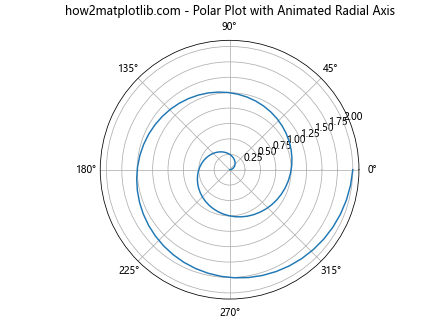
In this example, we create a polar plot and set the radial axis (y-axis in polar coordinates) to be animated. We then use get_animated() to check and print the animation status.
Matplotlib.axis.Axis.get_animated() and Custom Tick Formatters
The animation status of an axis can be used to control tick formatters. Let’s explore an example:
import matplotlib.pyplot as plt
import numpy as np

# Create data
x = np.linspace(0, 10, 100)
y = np.sin(x)

# Create figure and axis
fig, ax = plt.subplots()
ax.plot(x, y)

# Set x-axis to be animated
ax.xaxis.set_animated(True)

# Define custom tick formatter
def custom_formatter(x, pos):
    if ax.xaxis.get_animated():
        return f"{x:.2f}"
    else:
        return f"{x:.1f}"

# Set custom tick formatter
ax.xaxis.set_major_formatter(plt.FuncFormatter(custom_formatter))

plt.title("how2matplotlib.com - Custom Tick Formatter Based on Animation Status")
plt.show()
Output:
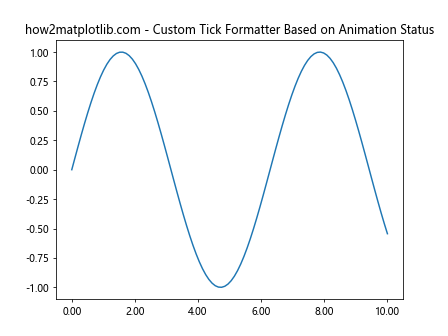
In this example, we create a custom tick formatter that changes its precision based on whether the x-axis is animated or not. This demonstrates how the get_animated() function can be used to control fine details of axis appearance.
Matplotlib.axis.Axis.get_animated() in Animations with Blitting
When creating animations with blitting (a technique to improve animation performance), the Matplotlib.axis.Axis.get_animated() function can be used to determine which plot elements should be updated. Let’s look at an example:
import matplotlib.pyplot as plt
import numpy as np
from matplotlib.animation import FuncAnimation

# Create figure and axis
fig, ax = plt.subplots()

# Create initial plot
x = np.linspace(0, 2*np.pi, 100)
line, = ax.plot(x, np.sin(x))

# Set x-axis to be animated
ax.xaxis.set_animated(True)

def update(frame):
    if ax.xaxis.get_animated():
        line.set_ydata(np.sin(x + frame/10))
    else:
        line.set_ydata(np.cos(x + frame/10))
    return line,

# Create animation
ani = FuncAnimation(fig, update, frames=np.linspace(0, 2*np.pi, 128),
                    interval=50, blit=True)

plt.title("how2matplotlib.com - Animation with Blitting")
plt.show()
Output:
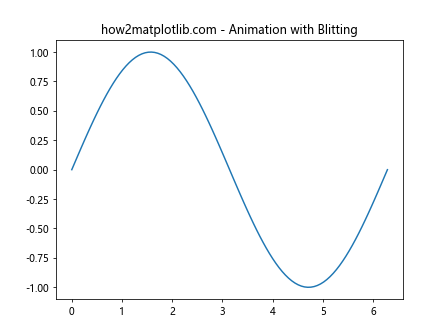
In this example, we create an animation that updates the plot differently based on whether the x-axis is animated or not. The get_animated() function is used in the update function to determine which data to plot.
Conclusion: Mastering Matplotlib.axis.Axis.get_animated()
Throughout this comprehensive guide, we’ve explored the Matplotlib.axis.Axis.get_animated() function in Python, demonstrating its versatility and power in creating dynamic and interactive visualizations. From basic usage to advanced applications, we’ve covered a wide range of scenarios where this function can be invaluable.
The Matplotlib.axis.Axis.get_animated() function provides a simple yet powerful way to check the animation status of an axis, allowing you to create more responsive and dynamic plots. Whether you’re working with simple line plots, complex 3D visualizations, or real-time data updates, understanding how to use get_animated() can greatly enhance your ability to create sophisticated and interactive matplotlib plots.