How to Make Subplots Span Multiple Grid Rows and Columns in Matplotlib
Make subplots span multiple grid rows and columns in Matplotlib is an essential skill for creating complex and informative visualizations. This article will explore various techniques and methods to achieve this, providing detailed explanations and examples along the way. We’ll cover everything from basic concepts to advanced techniques, ensuring you have a thorough understanding of how to make subplots span multiple grid rows and columns in Matplotlib.
Understanding the Basics of Subplots in Matplotlib
Before we dive into making subplots span multiple grid rows and columns in Matplotlib, it’s crucial to understand the fundamentals of subplots. Subplots are individual plots arranged in a grid-like structure within a single figure. They allow you to display multiple plots side by side or in a grid layout, making it easier to compare and analyze different datasets or visualizations.
To create basic subplots in Matplotlib, you can use the plt.subplots() function. Here’s a simple example:
import matplotlib.pyplot as plt
import numpy as np

fig, axs = plt.subplots(2, 2, figsize=(10, 8))
x = np.linspace(0, 10, 100)

for i in range(2):
    for j in range(2):
        axs[i, j].plot(x, np.sin(x + i + j))
        axs[i, j].set_title(f'Subplot {i+1},{j+1} - how2matplotlib.com')

plt.tight_layout()
plt.show()
Output:
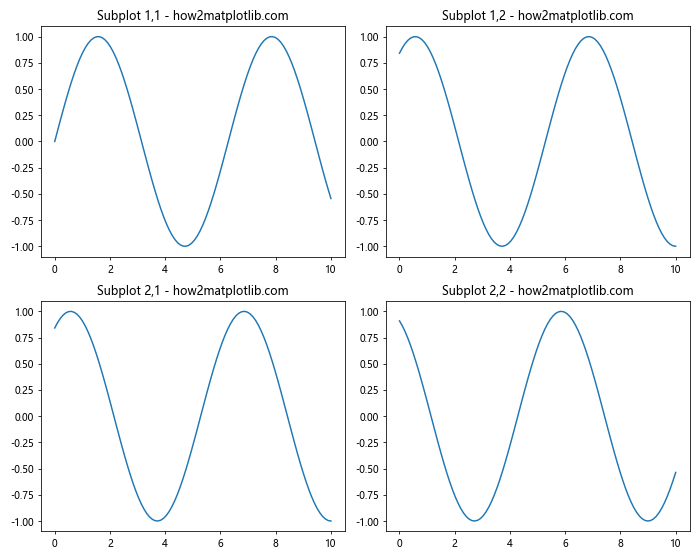
In this example, we create a 2×2 grid of subplots. Each subplot displays a sine wave with a slight phase shift. This basic understanding of subplots is essential before we move on to making subplots span multiple grid rows and columns in Matplotlib.
Introduction to GridSpec: The Key to Spanning Subplots
To make subplots span multiple grid rows and columns in Matplotlib, we need to introduce the concept of GridSpec. GridSpec is a powerful tool that allows for more flexible subplot layouts, including the ability to make subplots span multiple grid rows and columns in Matplotlib.
Here’s a simple example of how to use GridSpec to create a basic grid:
import matplotlib.pyplot as plt
from matplotlib.gridspec import GridSpec

fig = plt.figure(figsize=(10, 8))
gs = GridSpec(3, 3, figure=fig)

ax1 = fig.add_subplot(gs[0, 0])
ax2 = fig.add_subplot(gs[0, 1:])
ax3 = fig.add_subplot(gs[1:, :])

ax1.set_title('Subplot 1 - how2matplotlib.com')
ax2.set_title('Subplot 2 - how2matplotlib.com')
ax3.set_title('Subplot 3 - how2matplotlib.com')

plt.tight_layout()
plt.show()
Output:
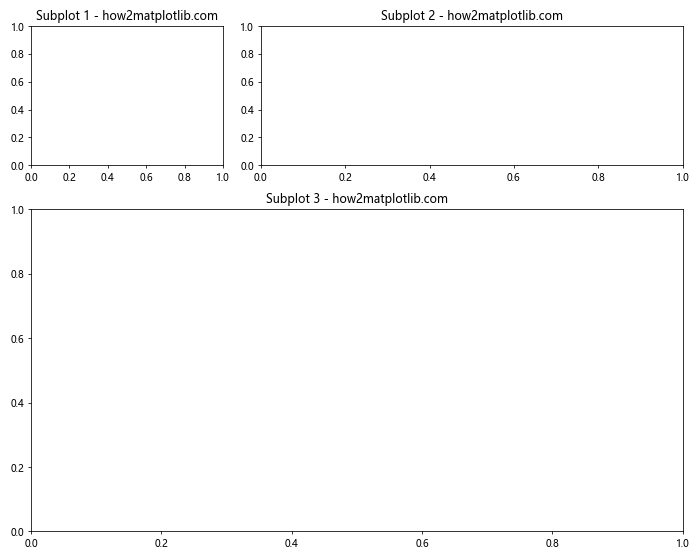
In this example, we create a 3×3 grid using GridSpec. We then add three subplots: one in the top-left corner, one spanning the top-right two columns, and one spanning the bottom two rows across all columns. This demonstrates how GridSpec allows us to make subplots span multiple grid rows and columns in Matplotlib.
Making Subplots Span Multiple Rows
Now that we understand the basics of GridSpec, let’s focus on making subplots span multiple rows. This technique is particularly useful when you want to emphasize certain plots or display data that requires more vertical space.
Here’s an example of how to make subplots span multiple rows:
import matplotlib.pyplot as plt
from matplotlib.gridspec import GridSpec
import numpy as np

fig = plt.figure(figsize=(10, 12))
gs = GridSpec(4, 2, figure=fig)

ax1 = fig.add_subplot(gs[0:2, 0])
ax2 = fig.add_subplot(gs[0:2, 1])
ax3 = fig.add_subplot(gs[2, :])
ax4 = fig.add_subplot(gs[3, :])

x = np.linspace(0, 10, 100)

ax1.plot(x, np.sin(x))
ax1.set_title('Subplot 1 - how2matplotlib.com')

ax2.plot(x, np.cos(x))
ax2.set_title('Subplot 2 - how2matplotlib.com')

ax3.plot(x, np.tan(x))
ax3.set_title('Subplot 3 - how2matplotlib.com')

ax4.plot(x, np.exp(x))
ax4.set_title('Subplot 4 - how2matplotlib.com')

plt.tight_layout()
plt.show()
Output:
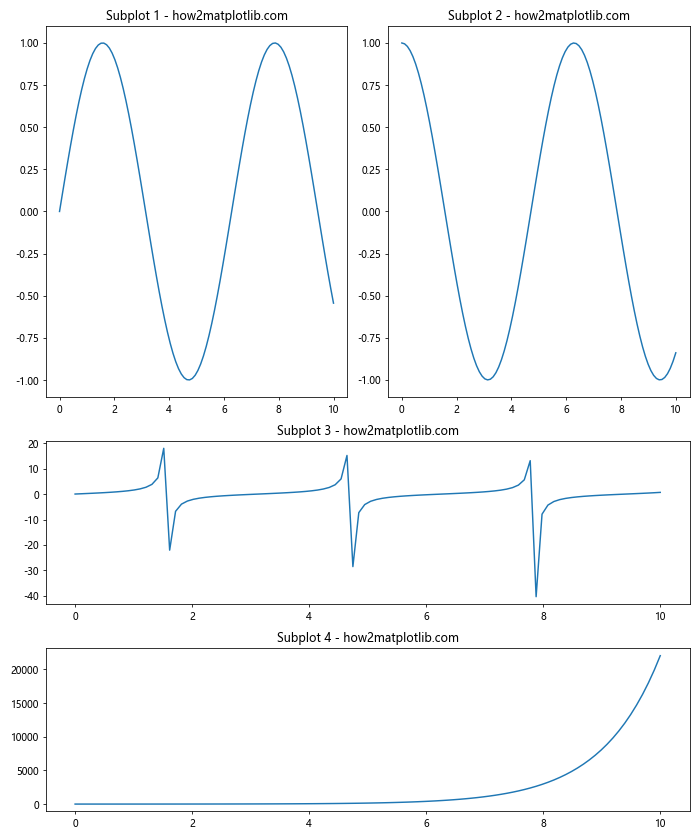
In this example, we create a 4×2 grid using GridSpec. The first two subplots span two rows each, while the last two subplots span the full width of the figure. This layout demonstrates how to make subplots span multiple rows in Matplotlib, allowing for more flexible and visually appealing arrangements.
Making Subplots Span Multiple Columns
Similar to spanning multiple rows, we can also make subplots span multiple columns in Matplotlib. This is useful when you want to create wider plots or emphasize horizontal relationships in your data.
Here’s an example of how to make subplots span multiple columns:
import matplotlib.pyplot as plt
from matplotlib.gridspec import GridSpec
import numpy as np

fig = plt.figure(figsize=(12, 8))
gs = GridSpec(2, 3, figure=fig)

ax1 = fig.add_subplot(gs[0, :2])
ax2 = fig.add_subplot(gs[0, 2])
ax3 = fig.add_subplot(gs[1, :])

x = np.linspace(0, 10, 100)

ax1.plot(x, np.sin(x))
ax1.set_title('Subplot 1 - how2matplotlib.com')

ax2.plot(x, np.cos(x))
ax2.set_title('Subplot 2 - how2matplotlib.com')

ax3.plot(x, np.tan(x))
ax3.set_title('Subplot 3 - how2matplotlib.com')

plt.tight_layout()
plt.show()
Output:
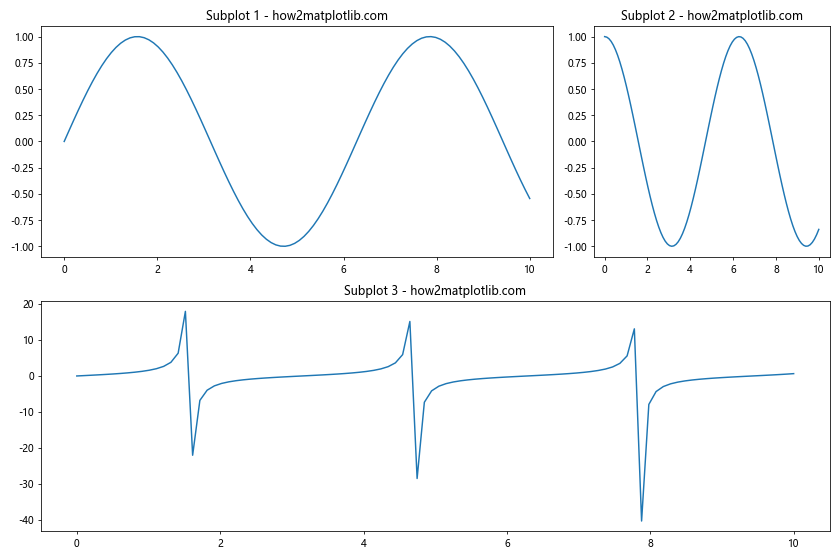
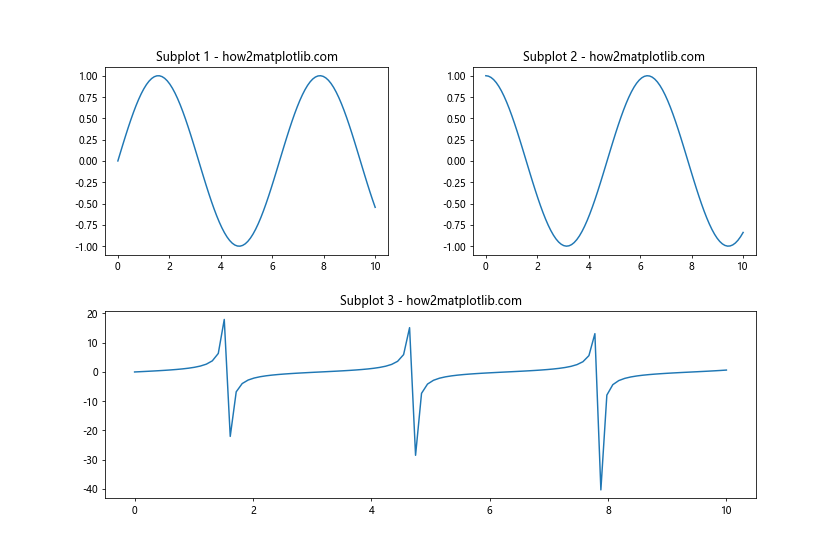
In this example, we create a 2×3 grid using GridSpec. The first subplot spans two columns, the second subplot occupies a single column, and the third subplot spans all three columns in the second row. This layout showcases how to make subplots span multiple columns in Matplotlib, allowing for more dynamic and informative visualizations.
Combining Row and Column Spanning
To create even more complex layouts, we can combine row and column spanning in Matplotlib. This technique allows for highly customized subplot arrangements that can effectively communicate complex data relationships.
Here’s an example of how to combine row and column spanning:
import matplotlib.pyplot as plt
from matplotlib.gridspec import GridSpec
import numpy as np

fig = plt.figure(figsize=(12, 10))
gs = GridSpec(3, 3, figure=fig)

ax1 = fig.add_subplot(gs[0, :2])
ax2 = fig.add_subplot(gs[0, 2])
ax3 = fig.add_subplot(gs[1:, :2])
ax4 = fig.add_subplot(gs[1, 2])
ax5 = fig.add_subplot(gs[2, 2])

x = np.linspace(0, 10, 100)

ax1.plot(x, np.sin(x))
ax1.set_title('Subplot 1 - how2matplotlib.com')

ax2.plot(x, np.cos(x))
ax2.set_title('Subplot 2 - how2matplotlib.com')

ax3.plot(x, np.tan(x))
ax3.set_title('Subplot 3 - how2matplotlib.com')

ax4.plot(x, np.exp(x))
ax4.set_title('Subplot 4 - how2matplotlib.com')

ax5.plot(x, np.log(x))
ax5.set_title('Subplot 5 - how2matplotlib.com')

plt.tight_layout()
plt.show()
Output:
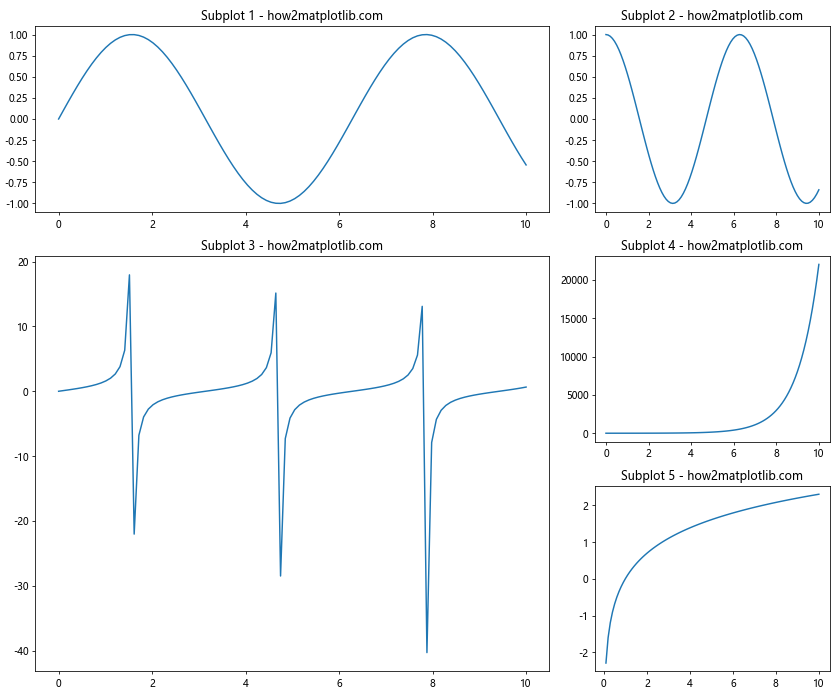
In this example, we create a 3×3 grid using GridSpec. We then create five subplots with various spanning configurations:
- Subplot 1 spans two columns in the first row
- Subplot 2 occupies a single cell in the top-right corner
- Subplot 3 spans two columns and two rows
- Subplots 4 and 5 occupy single cells in the right column
This layout demonstrates how to combine row and column spanning to create complex and informative visualizations in Matplotlib.
Using GridSpec with Uneven Subplot Sizes
GridSpec also allows us to create uneven subplot sizes when making subplots span multiple grid rows and columns in Matplotlib. This is particularly useful when you want to emphasize certain plots or accommodate different types of data visualizations within the same figure.
Here’s an example of how to create uneven subplot sizes:
import matplotlib.pyplot as plt
from matplotlib.gridspec import GridSpec
import numpy as np

fig = plt.figure(figsize=(12, 8))
gs = GridSpec(2, 3, width_ratios=[1, 2, 1], height_ratios=[2, 1], figure=fig)

ax1 = fig.add_subplot(gs[0, 0])
ax2 = fig.add_subplot(gs[0, 1:])
ax3 = fig.add_subplot(gs[1, :2])
ax4 = fig.add_subplot(gs[1, 2])

x = np.linspace(0, 10, 100)

ax1.plot(x, np.sin(x))
ax1.set_title('Subplot 1 - how2matplotlib.com')

ax2.plot(x, np.cos(x))
ax2.set_title('Subplot 2 - how2matplotlib.com')

ax3.plot(x, np.tan(x))
ax3.set_title('Subplot 3 - how2matplotlib.com')

ax4.plot(x, np.exp(x))
ax4.set_title('Subplot 4 - how2matplotlib.com')

plt.tight_layout()
plt.show()
Output:
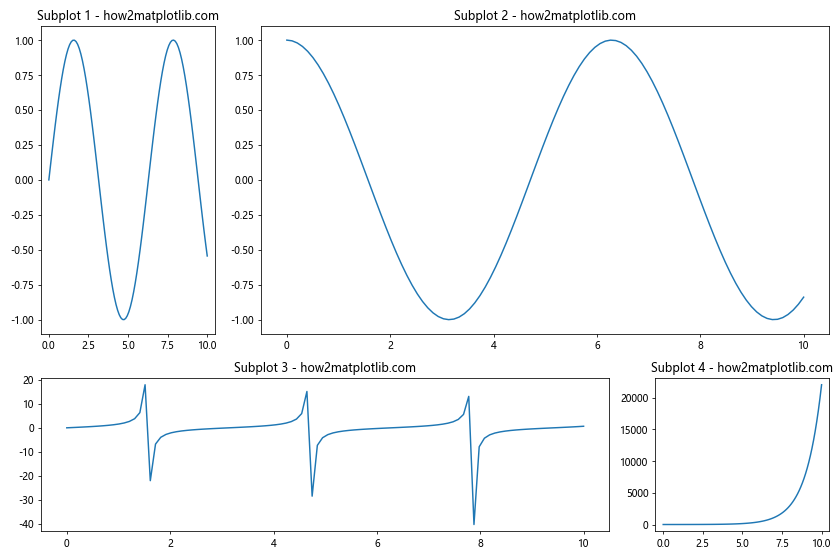
In this example, we create a 2×3 grid with uneven column widths and row heights. The width_ratios and height_ratios parameters in GridSpec allow us to specify the relative sizes of columns and rows. This results in subplots of different sizes, demonstrating how to make subplots span multiple grid rows and columns in Matplotlib with varying dimensions.
Adding Spacing Between Subplots
When making subplots span multiple grid rows and columns in Matplotlib, it’s often necessary to add spacing between subplots for better visual separation. GridSpec provides parameters to control this spacing.
Here’s an example of how to add spacing between subplots:
import matplotlib.pyplot as plt
from matplotlib.gridspec import GridSpec
import numpy as np

fig = plt.figure(figsize=(12, 8))
gs = GridSpec(2, 2, figure=fig, hspace=0.3, wspace=0.3)

ax1 = fig.add_subplot(gs[0, 0])
ax2 = fig.add_subplot(gs[0, 1])
ax3 = fig.add_subplot(gs[1, :])

x = np.linspace(0, 10, 100)

ax1.plot(x, np.sin(x))
ax1.set_title('Subplot 1 - how2matplotlib.com')

ax2.plot(x, np.cos(x))
ax2.set_title('Subplot 2 - how2matplotlib.com')

ax3.plot(x, np.tan(x))
ax3.set_title('Subplot 3 - how2matplotlib.com')

plt.show()
Output:
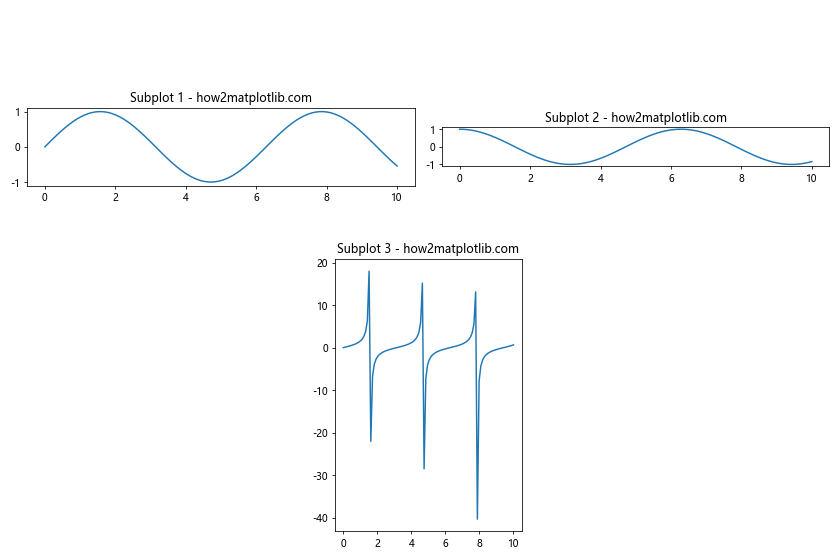
In this example, we use the hspace and wspace parameters in GridSpec to add horizontal and vertical spacing between subplots. This improves the visual separation of subplots when making them span multiple grid rows and columns in Matplotlib.
Creating Subplots with Varying Aspect Ratios
When making subplots span multiple grid rows and columns in Matplotlib, you might want to create subplots with different aspect ratios. This can be achieved by combining GridSpec with the set_aspect() method.
Here’s an example of how to create subplots with varying aspect ratios:
import matplotlib.pyplot as plt
from matplotlib.gridspec import GridSpec
import numpy as np

fig = plt.figure(figsize=(12, 8))
gs = GridSpec(2, 2, figure=fig)

ax1 = fig.add_subplot(gs[0, 0])
ax2 = fig.add_subplot(gs[0, 1])
ax3 = fig.add_subplot(gs[1, :])

x = np.linspace(0, 10, 100)

ax1.plot(x, np.sin(x))
ax1.set_title('Subplot 1 - how2matplotlib.com')
ax1.set_aspect(1)

ax2.plot(x, np.cos(x))
ax2.set_title('Subplot 2 - how2matplotlib.com')
ax2.set_aspect(0.5)

ax3.plot(x, np.tan(x))
ax3.set_title('Subplot 3 - how2matplotlib.com')
ax3.set_aspect(0.25)

plt.tight_layout()
plt.show()
Output:
In this example, we use the set_aspect() method to set different aspect ratios for each subplot. This allows for more control over the shape of each subplot when making them span multiple grid rows and columns in Matplotlib.
Creating Inset Axes within Spanning Subplots
When working with subplots that span multiple grid rows and columns in Matplotlib, you might want to add inset axes to highlight specific data or provide additional context. This can be achieved using the inset_axes() function.
Here’s an example of how to create inset axes within spanning subplots:
import matplotlib.pyplot as plt
from matplotlib.gridspec import GridSpec
from mpl_toolkits.axes_grid1.inset_locator import inset_axes
import numpy as np

fig = plt.figure(figsize=(12, 8))
gs = GridSpec(2, 2, figure=fig)

ax1 = fig.add_subplot(gs[0, :])
ax2 = fig.add_subplot(gs[1, 0])
ax3 = fig.add_subplot(gs[1, 1])

x = np.linspace(0, 10, 1000)

ax1.plot(x, np.sin(x))
ax1.set_title('Subplot 1 - how2matplotlib.com')

ax2.plot(x, np.cos(x))
ax2.set_title('Subplot 2 - how2matplotlib.com')

ax3.plot(x, np.tan(x))
ax3.set_title('Subplot 3 - how2matplotlib.com')

# Create inset axes
axins1 = inset_axes(ax1, width="30%", height="30%", loc=1)
axins2 = inset_axes(ax2, width="40%", height="40%", loc=4)
axins3 = inset_axes(ax3, width="40%", height="40%", loc=2)

# Plot data in inset axes
axins1.plot(x, np.sin(x))
axins1.set_xlim(4, 6)
axins1.set_ylim(-1, 1)

axins2.plot(x, np.cos(x))
axins2.set_xlim(2, 4)
axins2.set_ylim(-1, 1)

axins3.plot(x, np.tan(x))
axins3.set_xlim(1, 2)
axins3.set_ylim(-5, 5)

plt.tight_layout()
plt.show()
Output:
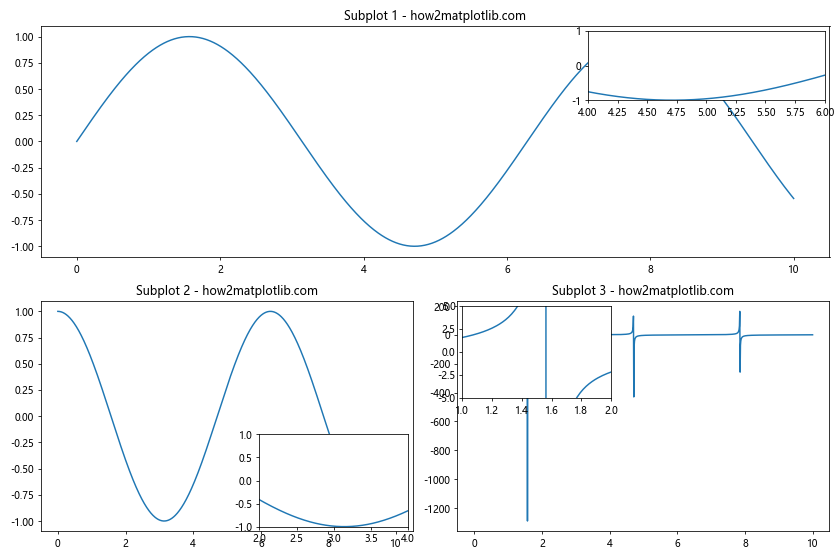
In this example, we create three subplots with different spanning configurations. We then add inset axes to each subplot using inset_axes(). This allows us to highlight specific regions of the data within the context of the larger plots, demonstrating how to create inset axes when making subplots span multiple grid rows and columns in Matplotlib.
Adjusting Subplot Positions Manually
While GridSpec provides a powerful way to make subplots span multiple grid rows and columns in Matplotlib, sometimes you might need more fine-grained control over subplot positions. In such cases, you can manually adjust subplot positions using the set_position() method.
Here’s an example of how to manually adjust subplot positions:
import matplotlib.pyplot as plt
from matplotlib.gridspec import GridSpec
import numpy as np

fig = plt.figure(figsize=(12, 8))
gs = GridSpec(2, 2, figure=fig)

ax1 = fig.add_subplot(gs[0, :])
ax2 = fig.add_subplot(gs[1, 0])
ax3 = fig.add_subplot(gs[1, 1])

x = np.linspace(0, 10, 100)

ax1.plot(x, np.sin(x))
ax1.set_title('Subplot 1 - how2matplotlib.com')

ax2.plot(x, np.cos(x))
ax2.set_title('Subplot 2 - how2matplotlib.com')

ax3.plot(x, np.tan(x))
ax3.set_title('Subplot 3 - how2matplotlib.com')

# Manually adjust subplot positions
ax1.set_position([0.1, 0.55, 0.8, 0.35])  # [left, bottom, width, height]
ax2.set_position([0.1, 0.1, 0.35, 0.35])
ax3.set_position([0.55, 0.1, 0.35, 0.35])

plt.show()
Output:
In this example, we first create subplots using GridSpec, and then manually adjust their positions using set_position(). This allows for precise control over subplot placement when making subplots span multiple grid rows and columns in Matplotlib.
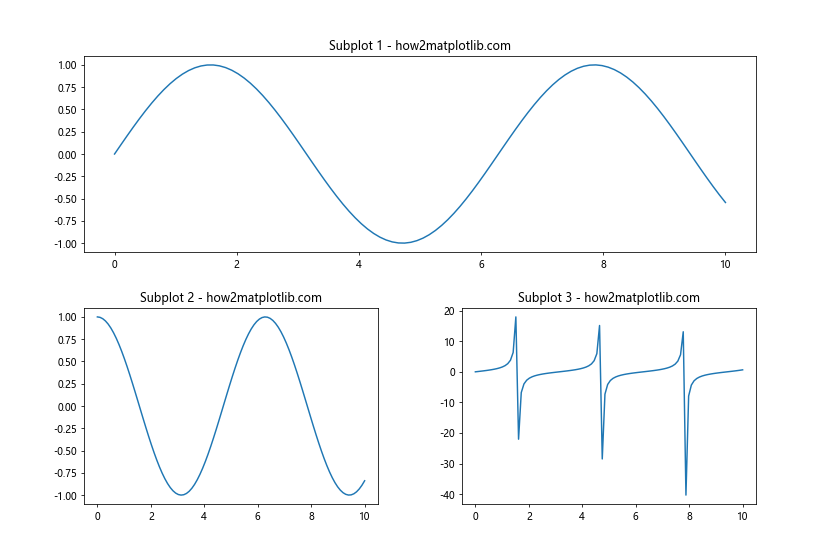
Creating Subplots with Shared Axes
When making subplots span multiple grid rows and columns in Matplotlib, you might want to create subplots with shared axes. This is particularly useful when comparing data across multiple plots with the same scale.
Here’s an example of how to create subplots with shared axes:
import matplotlib.pyplot as plt
from matplotlib.gridspec import GridSpec
import numpy as np

fig = plt.figure(figsize=(12, 8))
gs = GridSpec(2, 2, figure=fig)

ax1 = fig.add_subplot(gs[0, :])
ax2 = fig.add_subplot(gs[1, 0], sharex=ax1, sharey=ax1)
ax3 = fig.add_subplot(gs[1, 1], sharex=ax1, sharey=ax1)

x = np.linspace(0, 10, 100)

ax1.plot(x, np.sin(x))
ax1.set_title('Subplot 1 - how2matplotlib.com')

ax2.plot(x, np.sin(x + 1))
ax2.set_title('Subplot 2 - how2matplotlib.com')

ax3.plot(x, np.sin(x + 2))
ax3.set_title('Subplot 3 - how2matplotlib.com')

# Remove redundant tick labels
plt.setp(ax1.get_xticklabels(), visible=False)
plt.setp(ax3.get_yticklabels(), visible=False)

plt.tight_layout()
plt.show()
Output:
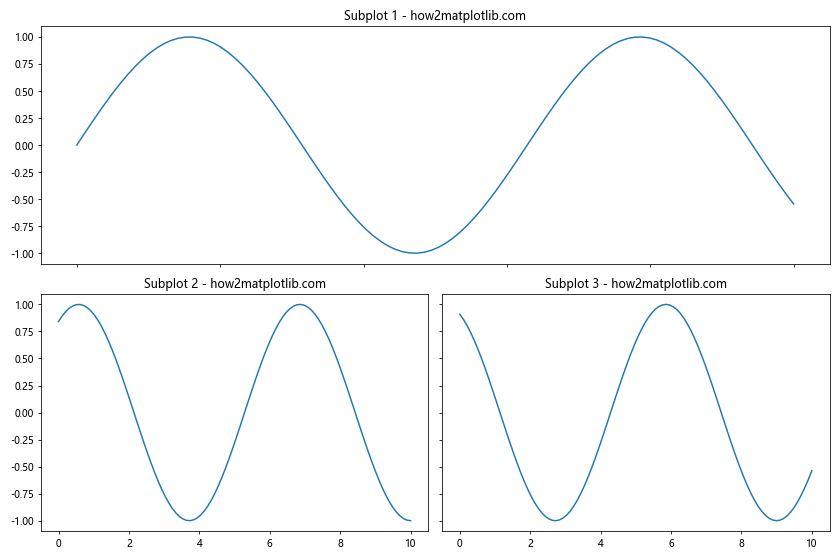
In this example, we create three subplots with shared x and y axes. The sharex and sharey parameters in add_subplot() ensure that the axes are shared across subplots. We also remove redundant tick labels to improve the overall appearance of the figure.
Conclusion
In this comprehensive guide, we’ve explored various techniques to make subplots span multiple grid rows and columns in Matplotlib. We’ve covered everything from basic GridSpec usage to advanced techniques like nesting GridSpecs, adding colorbars, creating inset axes, and manually adjusting subplot positions.