Matplotlib.axis.Axis.get_alpha() Function in Python

Matplotlib.axis.Axis.get_alpha() Function in Python

Matplotlib.axis.Axis.get_alpha() function in Python is an essential method for retrieving the alpha (transparency) value of an Axis object in Matplotlib. This function is part of the Matplotlib library, which is widely used for creating static, animated, and interactive visualizations in Python. In this comprehensive guide, we’ll explore the Matplotlib.axis.Axis.get_alpha() function in detail, covering its usage, parameters, return values, and practical applications in various plotting scenarios.

Understanding the Basics of Matplotlib.axis.Axis.get_alpha()

The Matplotlib.axis.Axis.get_alpha() function is a method associated with the Axis class in Matplotlib. Its primary purpose is to return the alpha value of the Axis object, which determines the transparency of the axis elements. The alpha value ranges from 0 (completely transparent) to 1 (completely opaque).

Let’s start with a simple example to demonstrate how to use the Matplotlib.axis.Axis.get_alpha() function:

import matplotlib.pyplot as plt

# Create a figure and axis
fig, ax = plt.subplots()

# Set the alpha value for the x-axis
ax.xaxis.set_alpha(0.5)

# Get the alpha value of the x-axis
alpha_value = ax.xaxis.get_alpha()

print(f"Alpha value of x-axis: {alpha_value}")

# Add a title with the website name
plt.title("Alpha Value Example - how2matplotlib.com")

plt.show()

Output:
Matplotlib.axis.Axis.get_alpha() Function in Python

In this example, we create a figure and axis using plt.subplots(). We then set the alpha value of the x-axis to 0.5 using the set_alpha() method. Finally, we use the Matplotlib.axis.Axis.get_alpha() function to retrieve the alpha value and print it.

Exploring the Parameters of Matplotlib.axis.Axis.get_alpha()

The Matplotlib.axis.Axis.get_alpha() function doesn’t take any parameters. It’s a simple getter method that returns the current alpha value of the Axis object. This simplicity makes it easy to use and integrate into your Matplotlib workflows.

Here’s an example that demonstrates the lack of parameters:

import matplotlib.pyplot as plt

fig, ax = plt.subplots()

# Get the alpha value of the y-axis without any parameters
y_axis_alpha = ax.yaxis.get_alpha()

print(f"Alpha value of y-axis: {y_axis_alpha}")

plt.title("Parameter-less get_alpha() - how2matplotlib.com")
plt.show()

Output:
Matplotlib.axis.Axis.get_alpha() Function in Python

In this example, we call the Matplotlib.axis.Axis.get_alpha() function on the y-axis without passing any parameters. The function returns the current alpha value of the y-axis.

Understanding the Return Value of Matplotlib.axis.Axis.get_alpha()

The Matplotlib.axis.Axis.get_alpha() function returns a float value representing the alpha (transparency) of the Axis object. This value ranges from 0.0 to 1.0, where:

  • 0.0 represents complete transparency (invisible)
  • 1.0 represents complete opacity (fully visible)

Any value between 0.0 and 1.0 represents partial transparency.

Let’s look at an example that demonstrates different alpha values:

import matplotlib.pyplot as plt

fig, (ax1, ax2, ax3) = plt.subplots(1, 3, figsize=(15, 5))

# Set different alpha values for each axis
ax1.xaxis.set_alpha(0.2)
ax2.xaxis.set_alpha(0.5)
ax3.xaxis.set_alpha(0.8)

# Get and print the alpha values
alpha1 = ax1.xaxis.get_alpha()
alpha2 = ax2.xaxis.get_alpha()
alpha3 = ax3.xaxis.get_alpha()

print(f"Alpha values: {alpha1}, {alpha2}, {alpha3}")

# Add titles with the website name
ax1.set_title(f"Alpha: {alpha1} - how2matplotlib.com")
ax2.set_title(f"Alpha: {alpha2} - how2matplotlib.com")
ax3.set_title(f"Alpha: {alpha3} - how2matplotlib.com")

plt.tight_layout()
plt.show()

Output:
Matplotlib.axis.Axis.get_alpha() Function in Python

In this example, we create three subplots and set different alpha values for their x-axes. We then use Matplotlib.axis.Axis.get_alpha() to retrieve these values and display them in the subplot titles.

Practical Applications of Matplotlib.axis.Axis.get_alpha()

The Matplotlib.axis.Axis.get_alpha() function is particularly useful when you need to check or verify the current transparency of an axis. This can be helpful in various scenarios, such as:

  1. Debugging: When you’re troubleshooting visibility issues in your plots.
  2. Dynamic plotting: When you’re creating plots that change based on user input or data.
  3. Consistency checks: When you want to ensure that multiple plots have consistent transparency settings.

Let’s explore some practical applications:

1. Debugging Axis Visibility

import matplotlib.pyplot as plt

fig, ax = plt.subplots()

# Set a very low alpha value
ax.xaxis.set_alpha(0.1)

# Check if the axis is nearly invisible
alpha = ax.xaxis.get_alpha()
if alpha < 0.2:
    print(f"Warning: X-axis is nearly invisible (alpha = {alpha})")

plt.title("Debugging Axis Visibility - how2matplotlib.com")
plt.show()

Output:
Matplotlib.axis.Axis.get_alpha() Function in Python

In this example, we set a very low alpha value for the x-axis and then use Matplotlib.axis.Axis.get_alpha() to check if the axis might be too transparent to see clearly.

2. Dynamic Axis Transparency

import matplotlib.pyplot as plt
import numpy as np

def update_alpha(event):
    if event.key == 'up':
        current_alpha = ax.xaxis.get_alpha()
        new_alpha = min(current_alpha + 0.1, 1.0)
        ax.xaxis.set_alpha(new_alpha)
    elif event.key == 'down':
        current_alpha = ax.xaxis.get_alpha()
        new_alpha = max(current_alpha - 0.1, 0.0)
        ax.xaxis.set_alpha(new_alpha)

    plt.title(f"Alpha: {ax.xaxis.get_alpha():.1f} - how2matplotlib.com")
    fig.canvas.draw()

fig, ax = plt.subplots()
ax.plot(np.random.rand(10))

ax.xaxis.set_alpha(0.5)
fig.canvas.mpl_connect('key_press_event', update_alpha)

plt.title("Dynamic Axis Transparency - how2matplotlib.com")
plt.show()

Output:
Matplotlib.axis.Axis.get_alpha() Function in Python

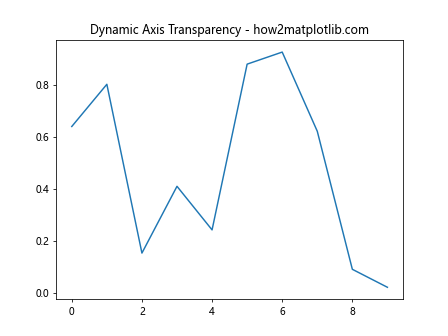
This example creates an interactive plot where you can change the x-axis transparency using the up and down arrow keys. The Matplotlib.axis.Axis.get_alpha() function is used to retrieve the current alpha value and update it accordingly.

3. Ensuring Consistent Transparency Across Multiple Plots

import matplotlib.pyplot as plt
import numpy as np

def create_subplot(ax, alpha):
    ax.plot(np.random.rand(10))
    ax.xaxis.set_alpha(alpha)
    ax.yaxis.set_alpha(alpha)
    actual_alpha = ax.xaxis.get_alpha()
    ax.set_title(f"Alpha: {actual_alpha:.2f} - how2matplotlib.com")

fig, axes = plt.subplots(2, 2, figsize=(10, 10))
target_alpha = 0.6

for ax in axes.flat:
    create_subplot(ax, target_alpha)

plt.tight_layout()
plt.show()

Output:
Matplotlib.axis.Axis.get_alpha() Function in Python

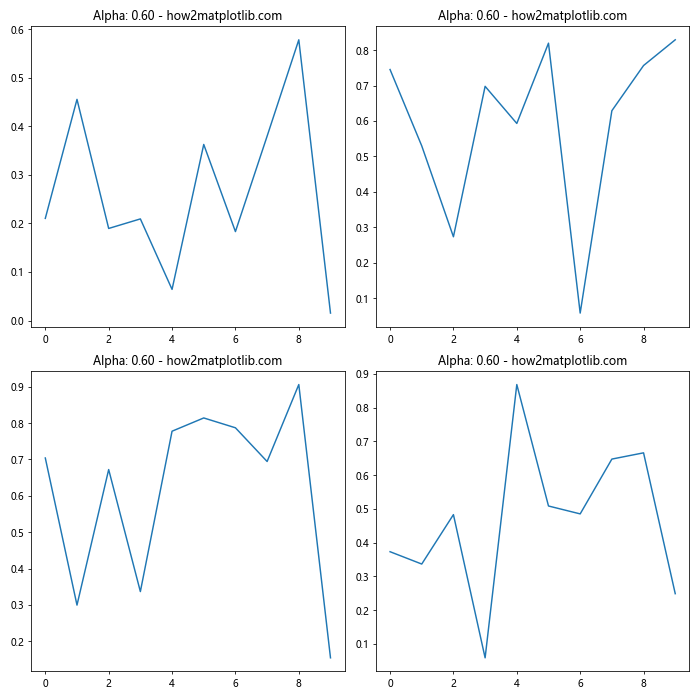
In this example, we create multiple subplots with a target alpha value. We use Matplotlib.axis.Axis.get_alpha() to verify that the actual alpha value matches the target value for each subplot.

Advanced Usage of Matplotlib.axis.Axis.get_alpha()

While the Matplotlib.axis.Axis.get_alpha() function is straightforward, it can be combined with other Matplotlib features for more advanced usage. Let’s explore some advanced scenarios:

1. Comparing Alpha Values of Different Axis Elements

import matplotlib.pyplot as plt

fig, ax = plt.subplots()

# Set different alpha values for various axis elements
ax.xaxis.set_alpha(0.7)
ax.yaxis.set_alpha(0.5)
ax.spines['top'].set_alpha(0.3)
ax.spines['right'].set_alpha(0.9)

# Get and compare alpha values
alpha_values = {
    'x-axis': ax.xaxis.get_alpha(),
    'y-axis': ax.yaxis.get_alpha(),
    'top spine': ax.spines['top'].get_alpha(),
    'right spine': ax.spines['right'].get_alpha()
}

for element, alpha in alpha_values.items():
    print(f"{element}: {alpha}")

plt.title("Comparing Alpha Values - how2matplotlib.com")
plt.show()

Output:
Matplotlib.axis.Axis.get_alpha() Function in Python

This example demonstrates how to set and retrieve alpha values for different axis elements, including the axis lines and spines.

2. Using get_alpha() in Custom Axis Formatters

import matplotlib.pyplot as plt
import matplotlib.ticker as ticker

def alpha_formatter(x, pos):
    alpha = ax.xaxis.get_alpha()
    return f"{x:.2f} (α={alpha:.2f})"

fig, ax = plt.subplots()

ax.plot([1, 2, 3, 4], [1, 4, 2, 3])
ax.xaxis.set_alpha(0.6)

ax.xaxis.set_major_formatter(ticker.FuncFormatter(alpha_formatter))

plt.title("Custom Axis Formatter - how2matplotlib.com")
plt.show()

Output:
Matplotlib.axis.Axis.get_alpha() Function in Python

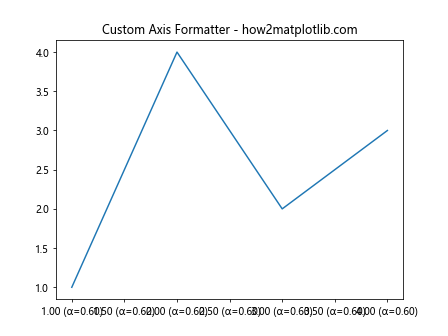
In this example, we create a custom axis formatter that includes the current alpha value of the x-axis in the tick labels.

3. Animating Axis Transparency

import matplotlib.pyplot as plt
import matplotlib.animation as animation
import numpy as np

fig, ax = plt.subplots()
line, = ax.plot(np.random.rand(10))

def update(frame):
    alpha = (np.sin(frame / 10) + 1) / 2  # Oscillate between 0 and 1
    ax.xaxis.set_alpha(alpha)
    ax.yaxis.set_alpha(alpha)
    current_alpha = ax.xaxis.get_alpha()
    ax.set_title(f"Current Alpha: {current_alpha:.2f} - how2matplotlib.com")
    return line,

ani = animation.FuncAnimation(fig, update, frames=100, interval=50, blit=True)

plt.show()

Output:
Matplotlib.axis.Axis.get_alpha() Function in Python

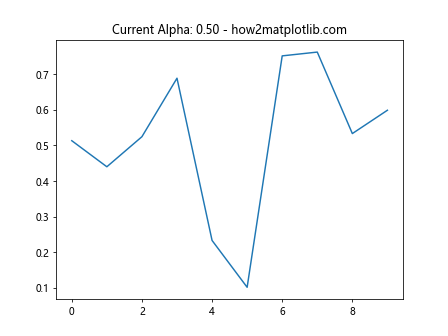
This example creates an animation where the transparency of both axes oscillates over time. The Matplotlib.axis.Axis.get_alpha() function is used to display the current alpha value in the plot title.

Common Pitfalls and Best Practices

When working with the Matplotlib.axis.Axis.get_alpha() function, there are a few things to keep in mind:

  1. Default Alpha Value: If you haven’t explicitly set an alpha value for an axis, get_alpha() may return None. It’s a good practice to handle this case in your code.

  2. Inheritance: The alpha value of an axis may be inherited from its parent Artist. In such cases, get_alpha() might not return the expected value.

  3. Performance: While get_alpha() is a lightweight function, calling it repeatedly in tight loops may impact performance. Consider caching the value if you need to use it multiple times.

Let’s look at some examples that address these points:

Handling Default Alpha Values

import matplotlib.pyplot as plt

fig, ax = plt.subplots()

# Get alpha value without setting it first
default_alpha = ax.xaxis.get_alpha()

if default_alpha is None:
    print("Alpha value is not set (None)")
    # Set a default value
    ax.xaxis.set_alpha(1.0)
else:
    print(f"Alpha value: {default_alpha}")

plt.title("Handling Default Alpha - how2matplotlib.com")
plt.show()

Output:

Matplotlib.axis.Axis.get_alpha() Function in Python

This example demonstrates how to handle the case where an alpha value hasn’t been explicitly set.

Understanding Alpha Inheritance

import matplotlib.pyplot as plt

fig, ax = plt.subplots()

# Set alpha for the entire axes
ax.set_alpha(0.5)

# Check alpha values
axes_alpha = ax.get_alpha()
xaxis_alpha = ax.xaxis.get_alpha()
yaxis_alpha = ax.yaxis.get_alpha()

print(f"Axes alpha: {axes_alpha}")
print(f"X-axis alpha: {xaxis_alpha}")
print(f"Y-axis alpha: {yaxis_alpha}")

plt.title("Alpha Inheritance - how2matplotlib.com")
plt.show()

Output:

Matplotlib.axis.Axis.get_alpha() Function in Python

This example shows how alpha values can be inherited from parent Artists, and how get_alpha() behaves in such cases.

Optimizing Performance

import matplotlib.pyplot as plt
import time

fig, ax = plt.subplots()

# Set an alpha value
ax.xaxis.set_alpha(0.7)

# Measure time for multiple calls to get_alpha()
start_time = time.time()
for _ in range(10000):
    alpha = ax.xaxis.get_alpha()
end_time = time.time()

print(f"Time for 10000 get_alpha() calls: {end_time - start_time:.4f} seconds")

# Measure time for caching the alpha value
start_time = time.time()
cached_alpha = ax.xaxis.get_alpha()
for _ in range(10000):
    alpha = cached_alpha
end_time = time.time()

print(f"Time for 10000 cached alpha accesses: {end_time - start_time:.4f} seconds")

plt.title("Performance Optimization - how2matplotlib.com")
plt.show()

Output:

Matplotlib.axis.Axis.get_alpha() Function in Python

This example compares the performance of repeatedly calling get_alpha() versus caching the value.

Integration with Other Matplotlib Features

The Matplotlib.axis.Axis.get_alpha() function can be effectively integrated with other Matplotlib features to create more complex and informative visualizations. Let’s explore some examples:

1. Combining with Colormaps

import matplotlib.pyplot as plt
import numpy as np

fig, ax = plt.subplots()

# Create a colormap
cmap = plt.get_cmap('viridis')

# Create data
x = np.linspace(0, 10, 100)
y = np.sin(x)

# Plot with varying alpha based on x values
scatter = ax.scatter(x, y, c=x, cmap=cmap, alpha=x/10)

# Add colorbar
cbar = plt.colorbar(scatter)
cbar.set_label('X values')

# Get and display the axis alpha
axis_alpha = ax.xaxis.get_alpha()
plt.title(f"Colormap with Varying Alpha (Axis Alpha: {axis_alpha}) - how2matplotlib.com")

plt.show()

Output:

Matplotlib.axis.Axis.get_alpha() Function in Python

This example combines a colormap with varying alpha values for the scatter plot points, while also displaying the axis alpha value in the title.

2. Using get_alpha() with Custom Legends

import matplotlib.pyplot as plt
import matplotlib.patches as patches

fig, ax = plt.subplots()

# Create some sample data
ax.plot([1, 2, 3, 4], [1, 4, 2, 3], label='Data')

# Set and get alpha for x-axis
ax.xaxis.set_alpha(0.5)
x_alpha = ax.xaxis.get_alpha()

# Create a custom legend
legend_elements = [
    patches.Patch(facecolor='white', edgecolor='black', label='Data'),
    patches.Patch(facecolor='gray', alpha=x_alpha, label=f'X-Axis Alpha: {x_alpha:.2f}')
]

ax.legend(handles=legend_elements, loc='upper right')

plt.title("Custom Legend with Alpha - how2matplotlib.com")
plt.show()

Output:

Matplotlib.axis.Axis.get_alpha() Function in Python

This example creates a custom legend that includes a patch representing the alpha value of the x-axis, which is retrieved using get_alpha().

3. Combining with Subplots and Gridspec

import matplotlib.pyplot as plt
import matplotlib.gridspec as gridspec
import numpy as np

fig = plt.figure(figsize=(12, 8))
gs = gridspec.GridSpec(2, 2)

def create_subplot(gs_pos, alpha):
    ax = fig.add_subplot(gs_pos)
    x = np.linspace(0, 10, 100)
    ax.plot(x, np.sin(x))
    ax.xaxis.set_alpha(alpha)
    ax.yaxis.set_alpha(alpha)
    actual_alpha = ax.xaxis.get_alpha()
    ax.set_title(f"Alpha: {actual_alpha:.2f} - how2matplotlib.com")
    return ax

ax1 = create_subplot(gs[0, 0], 0.3)
ax2 = create_subplot(gs[0, 1], 0.6)
ax3 = create_subplot(gs[1, :], 0.9)

plt.tight_layout()
plt.show()

Output:

Matplotlib.axis.Axis.get_alpha() Function in Python

This example demonstrates how to use Matplotlib.axis.Axis.get_alpha() in combination with subplots and GridSpec to create a complex layout with varying axis transparencies.

Troubleshooting Common Issues with Matplotlib.axis.Axis.get_alpha()

When working with the Matplotlib.axis.Axis.get_alpha() function, you might encounter some common issues. Let’s address these and provide solutions:

1. Unexpected None Return Value

import matplotlib.pyplot as plt

fig, ax = plt.subplots()

# Get alpha without setting it
alpha = ax.xaxis.get_alpha()

if alpha is None:
    print("Alpha is None. Setting a default value.")
    ax.xaxis.set_alpha(1.0)
    alpha = ax.xaxis.get_alpha()

print(f"X-axis alpha: {alpha}")

plt.title("Handling None Alpha - how2matplotlib.com")
plt.show()

Output:

Matplotlib.axis.Axis.get_alpha() Function in Python

This example shows how to handle the case where get_alpha() returns None, which can happen if the alpha value hasn’t been explicitly set.

2. Alpha Not Affecting Axis Visibility

import matplotlib.pyplot as plt
import numpy as np

fig, ax = plt.subplots()

x = np.linspace(0, 10, 100)
ax.plot(x, np.sin(x))

# Set alpha for x-axis
ax.xaxis.set_alpha(0.2)

# Check if alpha is applied
alpha = ax.xaxis.get_alpha()
print(f"X-axis alpha: {alpha}")

# Force update of axis artists
ax.xaxis._update_axisinfo()

plt.title("Ensuring Alpha Affects Visibility - how2matplotlib.com")
plt.show()

Output:

Matplotlib.axis.Axis.get_alpha() Function in Python

Sometimes, setting the alpha value might not immediately affect the axis visibility. This example demonstrates how to force an update of the axis artists to ensure the alpha value is applied.

3. Inconsistent Alpha Values Across Subplots

import matplotlib.pyplot as plt

fig, (ax1, ax2) = plt.subplots(1, 2, figsize=(10, 5))

# Set alpha for both axes
target_alpha = 0.5
ax1.xaxis.set_alpha(target_alpha)
ax2.xaxis.set_alpha(target_alpha)

# Check alpha values
alpha1 = ax1.xaxis.get_alpha()
alpha2 = ax2.xaxis.get_alpha()

print(f"Ax1 alpha: {alpha1}, Ax2 alpha: {alpha2}")

if alpha1 != alpha2:
    print("Warning: Alpha values are inconsistent")
    # Synchronize alpha values
    ax2.xaxis.set_alpha(alpha1)

ax1.set_title(f"Alpha: {ax1.xaxis.get_alpha()} - how2matplotlib.com")
ax2.set_title(f"Alpha: {ax2.xaxis.get_alpha()} - how2matplotlib.com")

plt.tight_layout()
plt.show()

Output:

Matplotlib.axis.Axis.get_alpha() Function in Python

This example addresses the issue of inconsistent alpha values across subplots and demonstrates how to synchronize them.

Best Practices for Using Matplotlib.axis.Axis.get_alpha()

To make the most of the Matplotlib.axis.Axis.get_alpha() function, consider the following best practices:

  1. Always check for None values when using get_alpha().
  2. Use get_alpha() in combination with set_alpha() for consistency checks.
  3. Consider caching the alpha value if you need to use it multiple times in performance-critical code.
  4. Use get_alpha() to create dynamic and interactive visualizations.

Let’s see these best practices in action:

import matplotlib.pyplot as plt
import numpy as np

def create_plot(alpha):
    fig, ax = plt.subplots()

    # Set alpha and verify
    ax.xaxis.set_alpha(alpha)
    actual_alpha = ax.xaxis.get_alpha()

    if actual_alpha is None:
        print("Warning: Alpha is None. Setting to default.")
        ax.xaxis.set_alpha(1.0)
        actual_alpha = ax.xaxis.get_alpha()

    # Cache the alpha value for repeated use
    cached_alpha = actual_alpha

    # Use the cached alpha value in the plot
    x = np.linspace(0, 10, 100)
    ax.plot(x, np.sin(x), alpha=cached_alpha)

    ax.set_title(f"Alpha: {cached_alpha:.2f} - how2matplotlib.com")
    return fig, ax

# Create plots with different alpha values
alphas = [0.3, 0.7, None]
for alpha in alphas:
    fig, ax = create_plot(alpha)
    plt.show()

Output:

Matplotlib.axis.Axis.get_alpha() Function in Python

This example demonstrates several best practices:
– Checking for None values
– Verifying the set alpha value
– Caching the alpha value for repeated use
– Using the alpha value consistently across the plot

Advanced Topics Related to Matplotlib.axis.Axis.get_alpha()

While Matplotlib.axis.Axis.get_alpha() is a relatively simple function, it can be used in more advanced scenarios. Let’s explore some of these:

Alpha Animations

You can create animations that dynamically change the alpha value:

import matplotlib.pyplot as plt
import matplotlib.animation as animation
import numpy as np

fig, ax = plt.subplots()

x = np.linspace(0, 2*np.pi, 100)
line, = ax.plot(x, np.sin(x))

def animate(frame):
    alpha = (np.sin(frame/10) + 1) / 2  # Oscillate between 0 and 1
    ax.xaxis.set_alpha(alpha)
    current_alpha = ax.xaxis.get_alpha()
    ax.set_title(f"Alpha: {current_alpha:.2f} - how2matplotlib.com")
    return line,

ani = animation.FuncAnimation(fig, animate, frames=100, interval=50, blit=True)

plt.show()

Output:

Matplotlib.axis.Axis.get_alpha() Function in Python

This animation changes the alpha value of the x-axis over time, using get_alpha() to display the current value.

Conclusion

The Matplotlib.axis.Axis.get_alpha() function is a simple yet powerful tool in the Matplotlib library. It allows you to retrieve the transparency value of an axis, which can be crucial for creating visually appealing and informative plots. By understanding how to use this function effectively, you can create more dynamic and interactive visualizations, debug transparency issues, and ensure consistency across multiple plots.

Throughout this guide, we’ve explored various aspects of the Matplotlib.axis.Axis.get_alpha() function, including:

  • Basic usage and syntax
  • Understanding the return value
  • Practical applications in different plotting scenarios
  • Integration with other Matplotlib features
  • Troubleshooting common issues
  • Best practices for using the function
  • Advanced topics and custom implementations

By mastering the Matplotlib.axis.Axis.get_alpha() function and related concepts, you’ll be better equipped to create sophisticated and visually appealing data visualizations using Matplotlib. Remember to experiment with different alpha values and combinations to find the best visual representation for your data.

Like(0)