Matplotlib Color Based on Value
When plotting data with Matplotlib, it is important to be able to customize the colors based on the values being displayed. In this article, we will explore different ways to assign colors to data points in a plot based on their values.
1. Coloring Scatter Plot Points
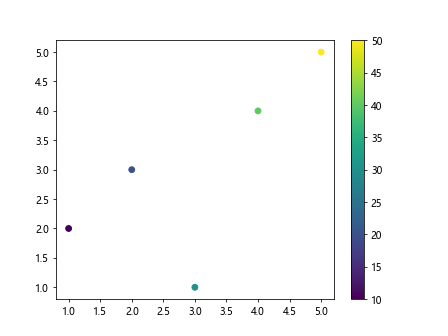
You can color scatter plot points based on their values using the c parameter in the scatter function.
import matplotlib.pyplot as plt

x = [1, 2, 3, 4, 5]
y = [2, 3, 1, 4, 5]
values = [10, 20, 30, 40, 50]

plt.scatter(x, y, c=values, cmap='viridis')
plt.colorbar()
plt.show()
Output:
2. Customizing Colormap
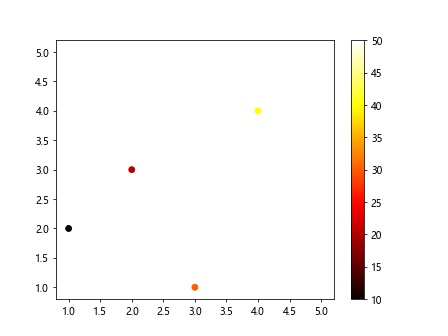
You can customize the colormap used for coloring by specifying a different colormap name, such as 'hot', 'cool', or 'spring'.
import matplotlib.pyplot as plt

x = [1, 2, 3, 4, 5]
y = [2, 3, 1, 4, 5]
values = [10, 20, 30, 40, 50]

plt.scatter(x, y, c=values, cmap='hot')
plt.colorbar()
plt.show()
Output:
3. Setting Color Limits
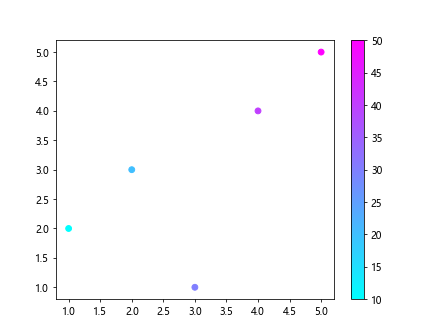
You can set the color limits for the plot using the vmin and vmax parameters in the scatter function.
import matplotlib.pyplot as plt

x = [1, 2, 3, 4, 5]
y = [2, 3, 1, 4, 5]
values = [10, 20, 30, 40, 50]

plt.scatter(x, y, c=values, cmap='cool', vmin=10, vmax=50)
plt.colorbar()
plt.show()
Output:
4. Coloring Line Plots
You can also color line plots based on their values by using the c parameter in the plot function.
import matplotlib.pyplot as plt

x = [1, 2, 3, 4, 5]
y = [2, 3, 1, 4, 5]
values = [10, 20, 30, 40, 50]

plt.plot(x, y, c=values, cmap='spring')
plt.show()
5. Bar Chart Colors
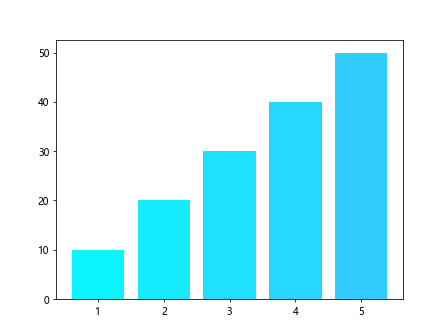
In a bar chart, you can customize the bar colors based on their values by using the color parameter.
import matplotlib.pyplot as plt

x = [1, 2, 3, 4, 5]
y = [2, 3, 1, 4, 5]
values = [10, 20, 30, 40, 50]

plt.bar(x, values, color=plt.cm.cool(values))
plt.show()
Output:
6. Customizing Colorbars
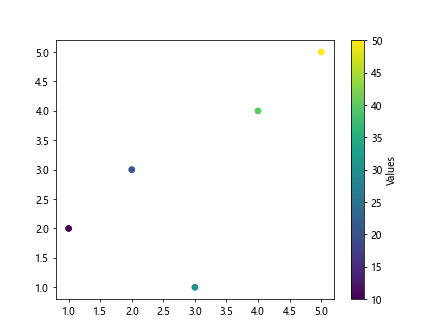
You can customize the colorbar by setting the label and ticks using the colorbar function.
import matplotlib.pyplot as plt

x = [1, 2, 3, 4, 5]
y = [2, 3, 1, 4, 5]
values = [10, 20, 30, 40, 50]

scatter = plt.scatter(x, y, c=values, cmap='viridis')
plt.colorbar(scatter, label='Values')
plt.show()
Output:
7. Discrete Color Mapping
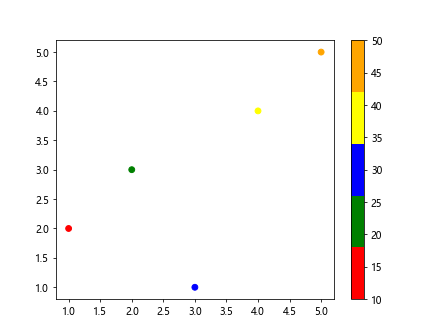
You can create a discrete color mapping by using a ListedColormap with specified colors.
from matplotlib.colors import ListedColormap
import matplotlib.pyplot as plt

x = [1, 2, 3, 4, 5]
y = [2, 3, 1, 4, 5]
values = [10, 20, 30, 40, 50]

colors = ['red', 'green', 'blue', 'yellow', 'orange']
cmap = ListedColormap(colors)

plt.scatter(x, y, c=values, cmap=cmap)
plt.colorbar()
plt.show()
Output:
8. Normalizing Colors
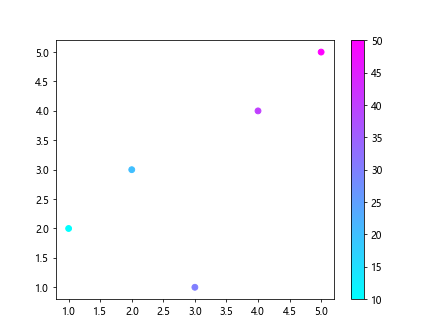
You can normalize the colors based on a specific range using the Normalize class.
from matplotlib.colors import Normalize
import matplotlib.pyplot as plt

x = [1, 2, 3, 4, 5]
y = [2, 3, 1, 4, 5]
values = [10, 20, 30, 40, 50]

norm = Normalize(vmin=10, vmax=50)

plt.scatter(x, y, c=values, cmap='cool', norm=norm)
plt.colorbar()
plt.show()
Output:
9. Logarithmic Color Mapping
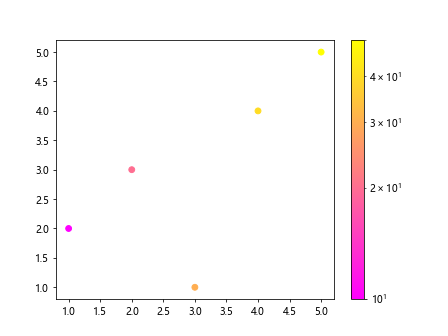
You can create a logarithmic color mapping by using the LogNorm class.
from matplotlib.colors import LogNorm
import matplotlib.pyplot as plt

x = [1, 2, 3, 4, 5]
y = [2, 3, 1, 4, 5]
values = [10, 20, 30, 40, 50]

norm = LogNorm(vmin=10, vmax=50)

plt.scatter(x, y, c=values, cmap='spring', norm=norm)
plt.colorbar()
plt.show()
Output:
10. Discrete Colorbar Ticks
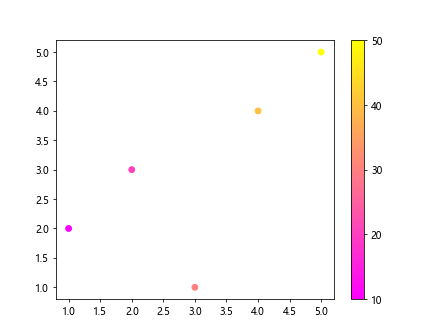
You can set discrete colorbar ticks using the locator parameter in the colorbar function.
import matplotlib.pyplot as plt

x = [1, 2, 3, 4, 5]
y = [2, 3, 1, 4, 5]
values = [10, 20, 30, 40, 50]

scatter = plt.scatter(x, y, c=values, cmap='spring')
cbar = plt.colorbar(scatter)
cbar.set_ticks([10, 20, 30, 40, 50])
plt.show()
Output:
Conclusion
In this article, we have explored different ways to color data points in plots based on their values using Matplotlib. By customizing the colors, you can effectively convey information in your visualizations. Experiment with the provided examples to create visually appealing plots that highlight the data patterns.