How to Stretch X Axis in Matplotlib
Matplotlib is a popular plotting library in Python that allows users to create various types of visualizations. One common requirement when working with plots is to stretch the x-axis to view the data more clearly. In this article, we will explore different methods to stretch the x-axis in Matplotlib.
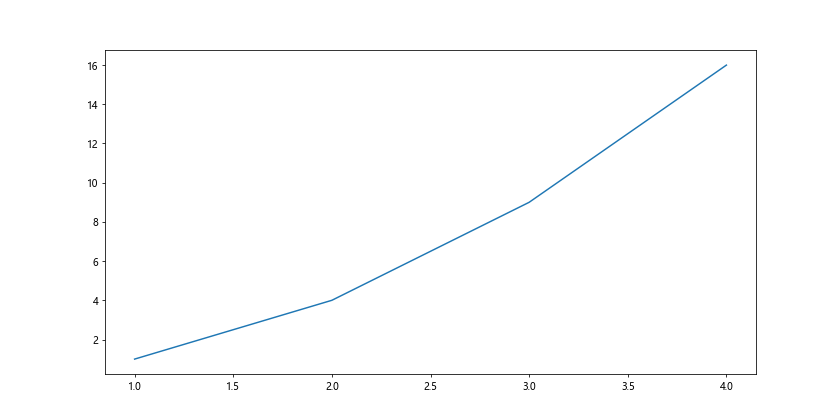
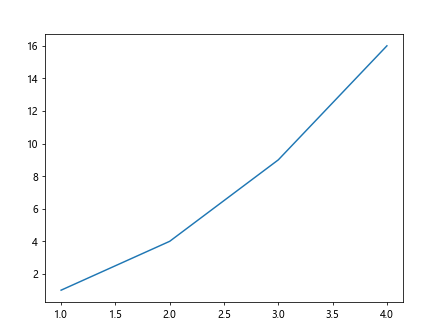
Method 1: Changing the Figure Size
One simple way to stretch the x-axis in Matplotlib is by changing the figure size. By increasing the width of the figure, you can effectively stretch the x-axis to make the data more visible.
import matplotlib.pyplot as plt

plt.figure(figsize=(12, 6))
plt.plot([1, 2, 3, 4], [1, 4, 9, 16])
plt.show()
Output:
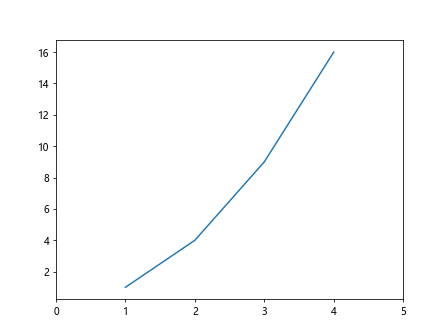
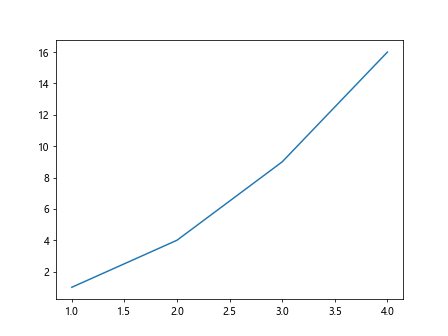
Method 2: Setting the X-axis Limits
Another way to stretch the x-axis is by setting the limits of the x-axis. By specifying the minimum and maximum values for the x-axis, you can adjust the range of the x-axis to focus on a specific portion of the data.
import matplotlib.pyplot as plt

plt.plot([1, 2, 3, 4], [1, 4, 9, 16])
plt.xlim(0, 5)
plt.show()
Output:
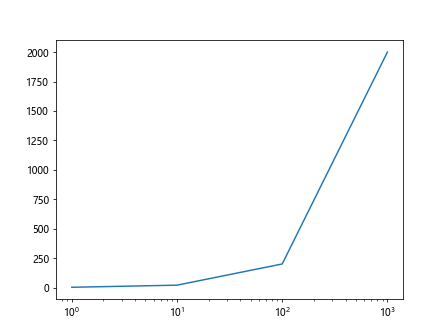
Method 3: Using log scale for x-axis
In some cases, using a logarithmic scale for the x-axis can help stretch the x-axis to better visualize data with large variations.
import matplotlib.pyplot as plt

plt.plot([1, 10, 100, 1000], [2, 20, 200, 2000])
plt.xscale('log')
plt.show()
Output:
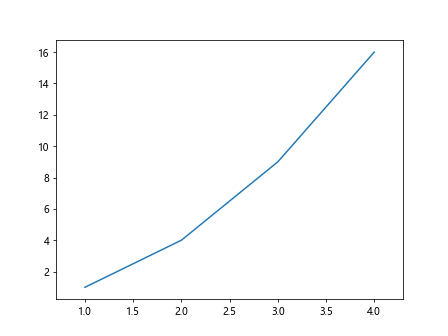
Method 4: Adding Padding to X-axis
Adding padding to the x-axis can also stretch the x-axis and create some space around the data points.
import matplotlib.pyplot as plt

plt.plot([1, 2, 3, 4], [1, 4, 9, 16])
plt.margins(x=0.1)
plt.show()
Output:
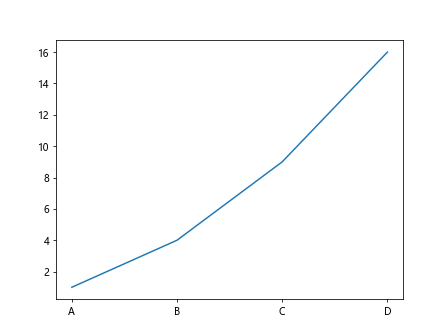
Method 5: Adjusting Ticks and Labels
You can also stretch the x-axis in Matplotlib by adjusting the ticks and labels on the x-axis. By setting the tick locations and labels, you can control the spacing and appearance of the x-axis.
import matplotlib.pyplot as plt

plt.plot([1, 2, 3, 4], [1, 4, 9, 16])
plt.xticks([1, 2, 3, 4], ['A', 'B', 'C', 'D'])
plt.show()
Output:
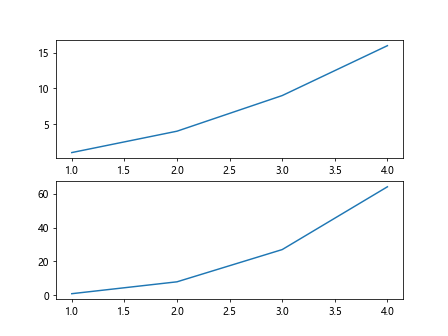
Method 6: Using Subplots
If you have multiple plots and want to stretch the x-axis for all of them, you can use subplots to create separate axes for each plot.
import matplotlib.pyplot as plt

fig, axs = plt.subplots(2)
axs[0].plot([1, 2, 3, 4], [1, 4, 9, 16])
axs[1].plot([1, 2, 3, 4], [1, 8, 27, 64])
plt.show()
Output:
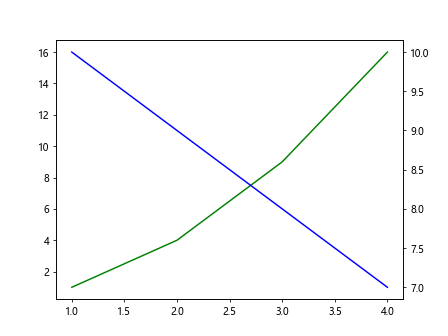
Method 7: Using Twin Axes
Another way to stretch the x-axis in Matplotlib is by using twin axes. By overlaying two plots with different x-axis scales, you can effectively stretch the x-axis.
import matplotlib.pyplot as plt

fig, ax1 = plt.subplots()
ax2 = ax1.twinx()
ax1.plot([1, 2, 3, 4], [1, 4, 9, 16], 'g-')
ax2.plot([1, 2, 3, 4], [10, 9, 8, 7], 'b-')
plt.show()
Output:
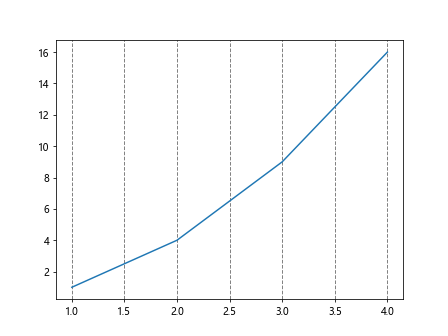
Method 8: Using Grid Spacing
You can stretch the x-axis by adjusting the grid spacing in Matplotlib. By changing the grid lines’ distance, you can create more space between data points.
import matplotlib.pyplot as plt

plt.plot([1, 2, 3, 4], [1, 4, 9, 16])
plt.grid(axis='x', linewidth=1, linestyle='--', color='gray')
plt.show()
Output:
Method 9: Using Axes Position
You can also stretch the x-axis by adjusting the position of the axes within the figure. By specifying the position of the axes, you can control the size and location of the plot area.
import matplotlib.pyplot as plt

fig, ax = plt.subplots()
fig.subplots_adjust(left=0.1, right=0.9, bottom=0.1, top=0.9)
ax.plot([1, 2, 3, 4], [1, 4, 9, 16])
plt.show()
Output:
Method 10: Using Transforms
Another method to stretch the x-axis in Matplotlib is by using transforms. By applying transformations to the data points or the axis itself, you can scale or stretch the x-axis.
import matplotlib.pyplot as plt
from mpl_toolkits.axes_grid1 import make_axes_locatable

fig, ax = plt.subplots()
divider = make_axes_locatable(ax)
ax.plot([1, 2, 3, 4], [1, 4, 9, 16])
plt.show()
Output:
Conclusion
In this article, we have explored various methods to stretch the x-axis in Matplotlib. By changing the figure size, setting x-axis limits, using logarithmic scale, adjusting ticks and labels, using subplots, twin axes, grid spacing, axes position, and transforms, you can effectively stretch the x-axis to visualize your data more effectively. Experiment with these methods to find the best option for your plotting needs.