How to Set Legend Position in Matplotlib
Matplotlib is a popular Python library for creating static, animated, and interactive visualizations in Python. One important aspect of creating visualizations is adding legends to your plots to provide additional information about the data being displayed. In this article, we will explore how to set the position of the legend in Matplotlib plots.
Example 1: Setting Legend Position
import matplotlib.pyplot as plt

x = [1, 2, 3, 4, 5]
y = [2, 3, 5, 7, 11]

plt.plot(x, y, label='Prime Numbers')
plt.legend(loc='upper right')

plt.show()
Output:
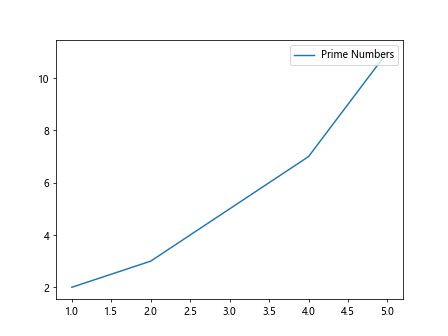
In the example above, we use the legend() function to add a legend to the plot. By specifying the loc parameter as 'upper right', we set the legend position to the upper right corner of the plot.
Example 2: Customizing Legend Position
import matplotlib.pyplot as plt

x = [1, 2, 3, 4, 5]
y = [2, 3, 5, 7, 11]

plt.plot(x, y, label='Prime Numbers')
plt.legend(loc='lower left')

plt.show()
Output:
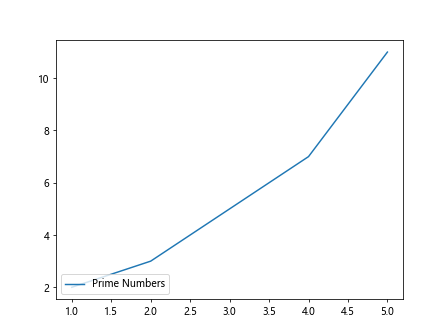
In this example, we set the legend position to the lower left corner of the plot by specifying 'lower left' as the value for the loc parameter.
Example 3: Setting Legend Outside the Plot
import matplotlib.pyplot as plt

x = [1, 2, 3, 4, 5]
y = [2, 3, 5, 7, 11]

plt.plot(x, y, label='Prime Numbers')
plt.legend(loc='center left', bbox_to_anchor=(1, 0.5))

plt.show()
Output:
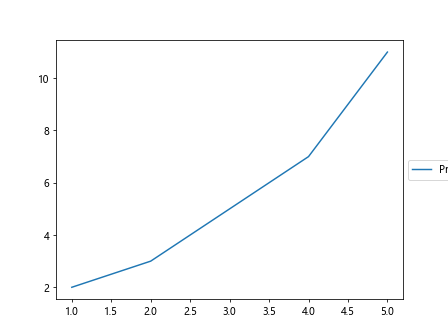
By using the bbox_to_anchor parameter, we can set the legend position outside the plot area. In this example, the legend is placed to the right of the plot.
Example 4: Customizing Legend Box Position
import matplotlib.pyplot as plt

x = [1, 2, 3, 4, 5]
y = [2, 3, 5, 7, 11]

plt.plot(x, y, label='Prime Numbers')
plt.legend(loc='center right', bbox_to_anchor=(0.5, 0.5))

plt.show()
Output:
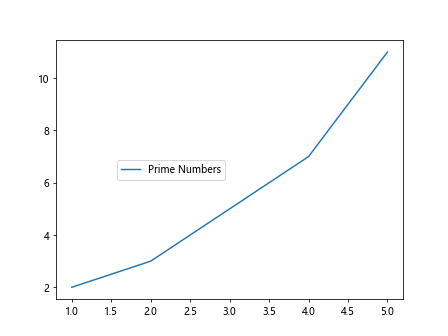
In this example, we set the legend position to the right of the plot and adjust the position of the legend box using the bbox_to_anchor parameter.
Example 5: Setting Legend Outside the Plot
import matplotlib.pyplot as plt

x = [1, 2, 3, 4, 5]
y = [2, 3, 5, 7, 11]

plt.plot(x, y, label='Prime Numbers')
plt.legend(loc='upper center', bbox_to_anchor=(0.5, -0.1))

plt.show()
Output:
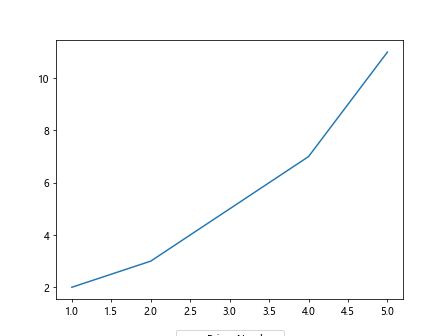
By specifying a negative value for the bbox_to_anchor parameter, we can move the legend box outside the plot area. In this example, the legend is displayed below the plot.
Example 6: Customizing Legend Position
import matplotlib.pyplot as plt

x = [1, 2, 3, 4, 5]
y = [2, 3, 5, 7, 11]

plt.plot(x, y, label='Prime Numbers')
plt.legend(loc='lower center', bbox_to_anchor=(0.5, 1.1))

plt.show()
Output:
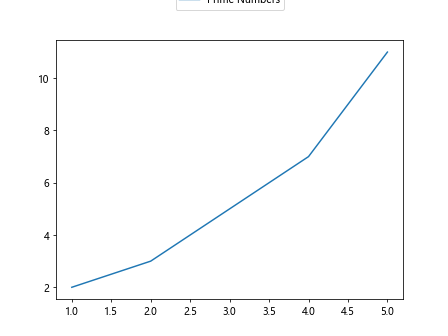
In this example, we set the legend position to the top of the plot by specifying a value greater than 1 for the bbox_to_anchor parameter.
Example 7: Setting Legend Inside the Plot
import matplotlib.pyplot as plt

x = [1, 2, 3, 4, 5]
y = [2, 3, 5, 7, 11]

plt.plot(x, y, label='Prime Numbers')
plt.legend(loc='upper right', bbox_to_anchor=(0.5, 0.5))

plt.show()
Output:
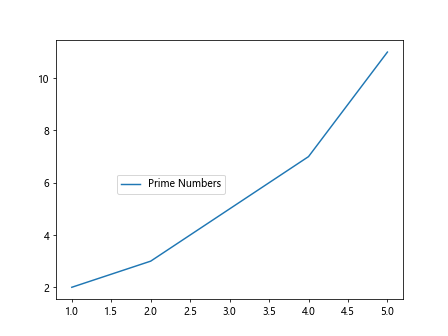
By setting the bbox_to_anchor parameter with a value within the range of 0 to 1, we can position the legend inside the plot area. In this example, the legend is placed in the upper right corner of the plot.
Example 8: Customizing Legend Position
import matplotlib.pyplot as plt

x = [1, 2, 3, 4, 5]
y = [2, 3, 5, 7, 11]

plt.plot(x, y, label='Prime Numbers')
plt.legend(loc='upper left', bbox_to_anchor=(-0.1, 0.5))

plt.show()
Output:
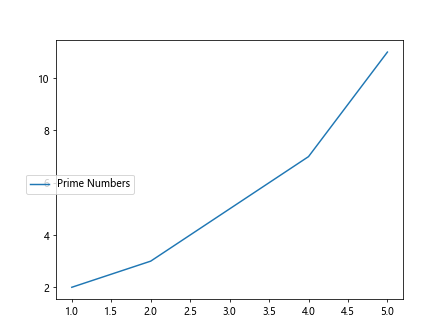
By specifying a negative value for the bbox_to_anchor parameter, we can adjust the position of the legend inside the plot. In this example, the legend is displayed in the upper left corner of the plot slightly outside the plot area.
Example 9: Setting Legend Position
import matplotlib.pyplot as plt

x = [1, 2, 3, 4, 5]
y = [2, 3, 5, 7, 11]

plt.plot(x, y, label='Prime Numbers')
plt.legend(loc='lower right', bbox_to_anchor=(1.1, 0.5))

plt.show()
Output:
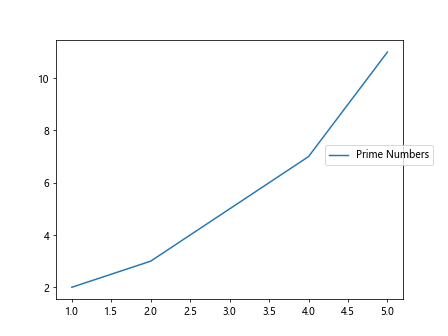
In this example, we set the legend position to the lower right corner of the plot and position the legend box slightly outside the plot area by specifying a value greater than 1 for the bbox_to_anchor parameter.
Example 10: Customizing Legend Position
import matplotlib.pyplot as plt

x = [1, 2, 3, 4, 5]
y = [2, 3, 5, 7, 11]

plt.plot(x, y, label='Prime Numbers')
plt.legend(loc='center', bbox_to_anchor=(0.5, 0.5))

plt.show()
Output:
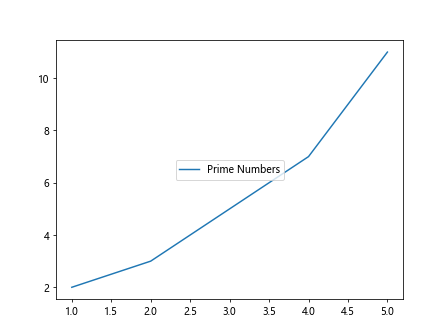
By setting the bbox_to_anchor parameter with a value of (0.5, 0.5), we can position the legend in the center of the plot.
Conclusion
Setting the legend position in Matplotlib plots is an important aspect of creating informative and visually appealing visualizations. By using the loc parameter and the bbox_to_anchor parameter, you can customize the position of the legend to suit your specific requirements. Experiment with different values for these parameters to achieve the desired legend position in your plots.