How to Set Figure Size in Matplotlib
Matplotlib is a popular Python library used for creating static, interactive, and animated visualizations in Python. One common task when using Matplotlib is setting the figure size to customize the appearance of plots. In this article, we will explore different ways to set the figure size in Matplotlib.
Setting Figure Size Using figsize Parameter
One way to set the figure size in Matplotlib is by using the figsize parameter within the plt.figure() function. The figsize parameter takes a tuple of two values representing the width and height of the figure in inches.
import matplotlib.pyplot as plt

# Set figure size to 8 inches wide and 6 inches high
plt.figure(figsize=(8, 6))
Using rcParams to Set Figure Size
Another way to set the figure size globally for all plots is by using the rcParams configuration. We can set the figure.figsize parameter in rcParams to specify the default figure size for all plots.
import matplotlib.pyplot as plt
import matplotlib as mpl

# Set figure size globally using rcParams
mpl.rcParams['figure.figsize'] = (10, 8)
Setting Figure Size for Subplots
When creating subplots in Matplotlib, we can set the figure size for each subplot individually. We can use the plt.subplots() function with the figsize parameter to specify the figure size for the subplots.
import matplotlib.pyplot as plt

# Create subplots with different figure sizes
fig, axs = plt.subplots(2, 2, figsize=(12, 10))
Setting Figure Size in Object-Oriented Interface
In Matplotlib, we can also set the figure size when using the Object-Oriented interface. We can specify the figure size by calling the set_size_inches() method on the Figure object.
import matplotlib.pyplot as plt

# Create a Figure object and set its size
fig = plt.figure()
fig.set_size_inches(14, 8)
Adjusting Figure Size Proportionally
If we want to adjust the figure size proportionally, we can use the aspect parameter in the subplots() function. The aspect parameter allows us to control the aspect ratio of the figure.
import matplotlib.pyplot as plt

# Create a plot with a proportional figure size
fig, ax = plt.subplots(aspect='equal')
Setting Figure Size in Jupyter Notebook
When working with Matplotlib in Jupyter Notebook, we can set the figure size using the %matplotlib inline magic command followed by setting the rcParams['figure.figsize'] parameter.
%matplotlib inline
import matplotlib.pyplot as plt
import matplotlib as mpl

# Set figure size in Jupyter Notebook
mpl.rcParams['figure.figsize'] = (10, 6)
Specifying Custom Figure Size
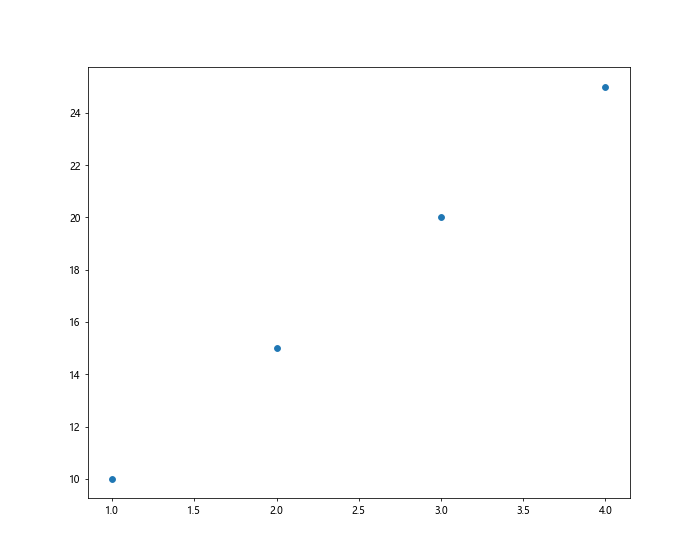
We can also specify a custom figure size by passing the figsize parameter to individual plot functions like plt.plot(), plt.scatter(), or plt.bar().
import matplotlib.pyplot as plt

# Create a scatter plot with custom figure size
plt.figure(figsize=(10, 8))
plt.scatter([1, 2, 3, 4], [10, 15, 20, 25])
plt.show()
Output:

Adjusting Figure Size in Seaborn Plots
When using Seaborn for creating plots, we can adjust the figure size by using the sns.set() function with the rc parameter to set the figure size.
import matplotlib.pyplot as plt
import seaborn as sns

# Set figure size in Seaborn plots
sns.set(rc={'figure.figsize':(12, 6)})
Saving Figures with Custom Size
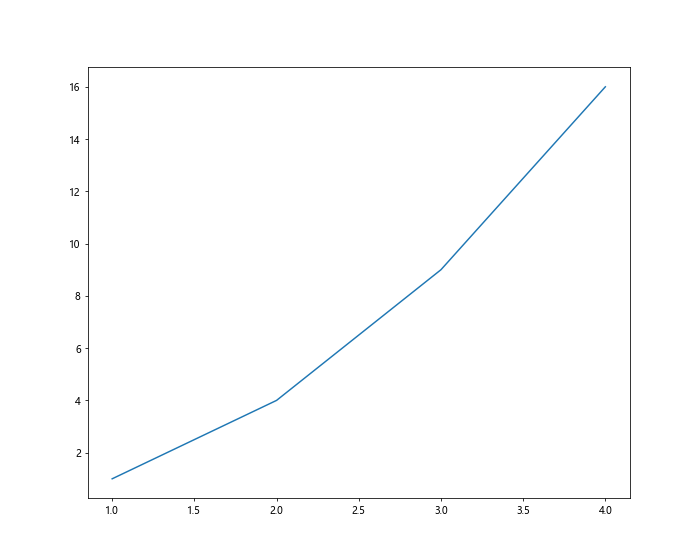
When saving figures in Matplotlib, we can specify the figure size using the figsize parameter in the plt.savefig() function. This allows us to save plots with custom figure sizes.
import matplotlib.pyplot as plt

# Save the figure with a custom size
plt.figure(figsize=(10, 8))
plt.plot([1, 2, 3, 4], [1, 4, 9, 16])
plt.savefig('custom_figure_size.png', dpi=300)
plt.show()
Output:

Conclusion
In this article, we have explored various methods to set the figure size in Matplotlib. We have seen how to set the figure size using the figsize parameter, rcParams, Object-Oriented interface, and in Jupyter Notebook. Additionally, we have learned how to adjust figure size proportionally, specify custom sizes, and save figures with custom sizes. By understanding these techniques, you can customize the appearance of your Matplotlib plots based on your requirements. Experiment with different figure sizes to create visually appealing plots for your data visualization tasks.
Remember, the ability to set the figure size in Matplotlib gives you the flexibility to create plots that suit your specific needs and preferences. Play around with different figure sizes and aspect ratios to find the optimal visualization for your data. Matplotlib’s versatility makes it easy to customize plots and create professional-looking visualizations for your projects.