How to Set Axis Limits in Matplotlib
Matplotlib is a popular data visualization library in Python that allows users to create a wide range of plots, such as line plots, bar plots, scatter plots, and more. One common customization in Matplotlib is setting the axis limits, which can help focus on specific data ranges or improve the overall appearance of the plot. In this article, we will explore various ways to set axis limits in Matplotlib with detailed examples.
Setting Axis Limits for Line Plots
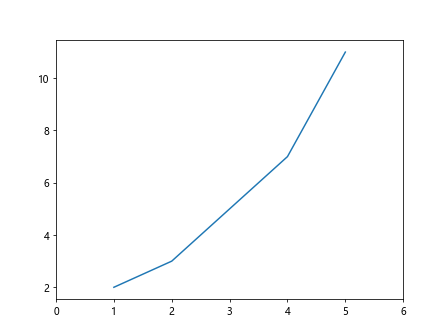
Example 1: Setting Axis Limits for x-axis
import matplotlib.pyplot as plt

x = [1, 2, 3, 4, 5]
y = [2, 3, 5, 7, 11]

plt.plot(x, y)
plt.xlim(0, 6)  # Set x-axis limits
plt.show()
Output:
Example 2: Setting Axis Limits for y-axis
import matplotlib.pyplot as plt

x = [1, 2, 3, 4, 5]
y = [2, 3, 5, 7, 11]

plt.plot(x, y)
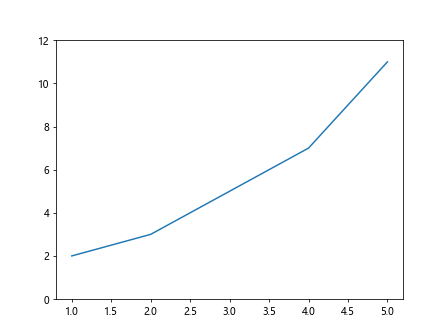
plt.ylim(0, 12)  # Set y-axis limits
plt.show()
Output:
Example 3: Setting Both x-axis and y-axis Limits
import matplotlib.pyplot as plt

x = [1, 2, 3, 4, 5]
y = [2, 3, 5, 7, 11]

plt.plot(x, y)
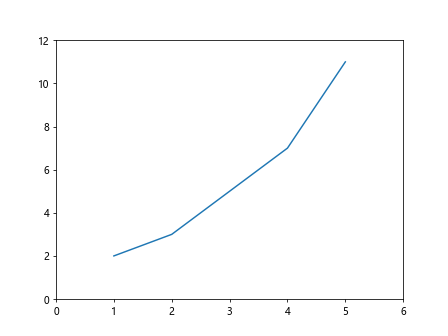
plt.axis([0, 6, 0, 12])  # Set both x and y-axis limits
plt.show()
Output:
Setting Axis Limits for Other Plot Types
Example 4: Setting Axis Limits for Bar Plots
import matplotlib.pyplot as plt

x = ['A', 'B', 'C', 'D', 'E']
y = [10, 20, 30, 40, 50]

plt.bar(x, y)
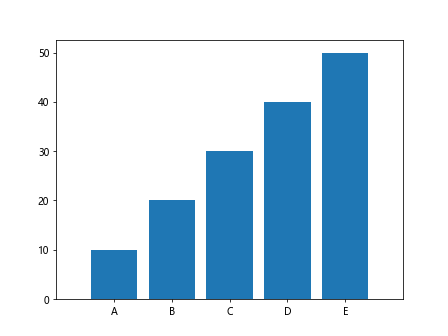
plt.xlim(-1, 5)  # Set x-axis limits
plt.show()
Output:
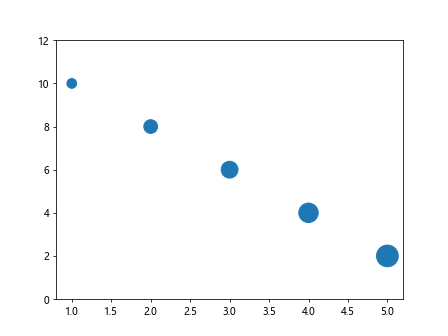
Example 5: Setting Axis Limits for Scatter Plots
import matplotlib.pyplot as plt

x = [1, 2, 3, 4, 5]
y = [10, 8, 6, 4, 2]
sizes = [100, 200, 300, 400, 500]

plt.scatter(x, y, s=sizes)
plt.ylim(0, 12)  # Set y-axis limits
plt.show()
Output:
Setting Axis Limits for Subplots
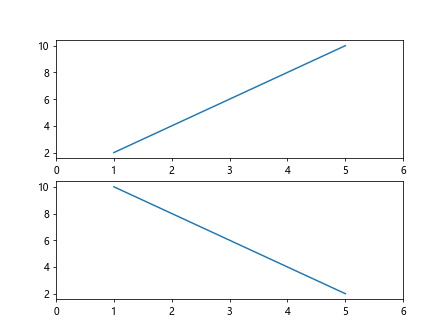
Example 6: Setting Axis Limits for Subplots
import matplotlib.pyplot as plt

fig, axs = plt.subplots(2)

x1 = [1, 2, 3, 4, 5]
y1 = [2, 4, 6, 8, 10]
x2 = [1, 2, 3, 4, 5]
y2 = [10, 8, 6, 4, 2]

axs[0].plot(x1, y1)
axs[0].set_xlim(0, 6)  # Set x-axis limits for first subplot
axs[1].plot(x2, y2)
axs[1].set_xlim(0, 6)  # Set x-axis limits for second subplot
plt.show()
Output:
Manually Setting Axis Limits
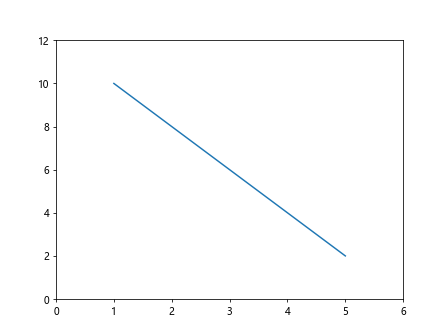
Example 7: Manually Setting Axis Limits
import matplotlib.pyplot as plt

x = [1, 2, 3, 4, 5]
y = [10, 8, 6, 4, 2]

plt.plot(x, y)
plt.axis([0, 6, 0, 12])  # Manually set both x and y-axis limits
plt.show()
Output:
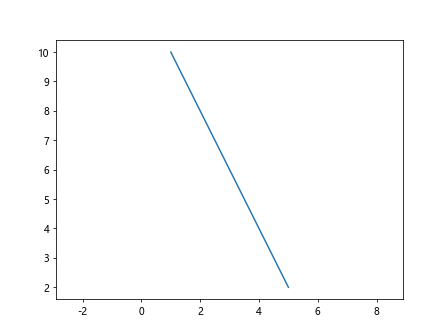
Example 8: Setting Equal Axis Limits
import matplotlib.pyplot as plt

x = [1, 2, 3, 4, 5]
y = [10, 8, 6, 4, 2]

plt.plot(x, y)
plt.axis('equal')  # Set equal x and y-axis limits
plt.show()
Output:
Setting Axis Limits Using Data Ranges
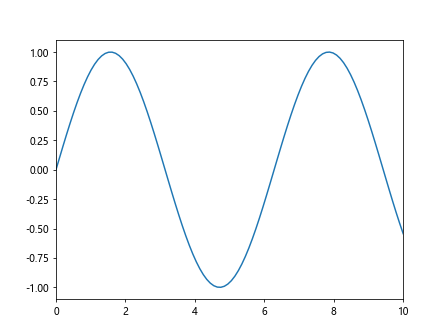
Example 9: Setting Axis Limits Using Data Ranges
import numpy as np
import matplotlib.pyplot as plt

x = np.linspace(0, 10, 100)
y = np.sin(x)

plt.plot(x, y)
plt.xlim(np.min(x), np.max(x))  # Set x-axis limits using data ranges
plt.show()
Output:
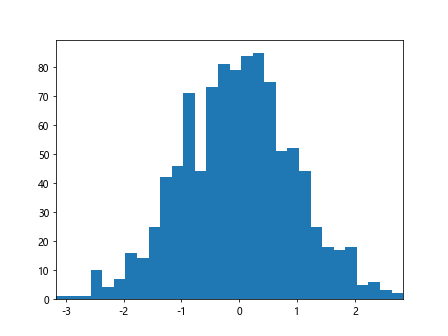
Example 10: Setting Axis Limits Based on Data Statistics
import numpy as np
import matplotlib.pyplot as plt

data = np.random.normal(0, 1, 1000)

plt.hist(data, bins=30)
plt.xlim(np.min(data), np.max(data))  # Set x-axis limits based on data statistics
plt.show()
Output:
Conclusion
In this article, we have explored various ways to set axis limits in Matplotlib for different types of plots. By customizing the axis limits, users can focus on specific data ranges, improve the appearance of their plots, and enhance the overall data visualization experience. Experiment with the provided examples to master the art of setting axis limits in Matplotlib for your own data visualization projects.