Mastering Matplotlib Basemap for Geospatial Data Visualization
Matplotlib Basemap is a toolkit extension for matplotlib, providing the capability to plot 2D data on maps in Python. It’s an excellent tool for data scientists and geographers looking to represent data geographically. This article will guide you through the essentials of using Matplotlib Basemap, covering installation, basic map creation, plotting points, lines, and polygons, and more advanced features like working with projections, adding markers, and customizing your maps for impactful visualizations.
Getting Started with Basemap
Before diving into the examples, ensure you have Matplotlib and Basemap installed in your Python environment. Basemap is not included with the default Matplotlib package and needs to be installed separately. You can install Basemap using conda or pip, but make sure you have the necessary dependencies.
# If using conda, you can install Basemap with:
conda install basemap

# If using pip, ensure you have the dependencies installed first, then:
pip install basemap
Basic Map Creation
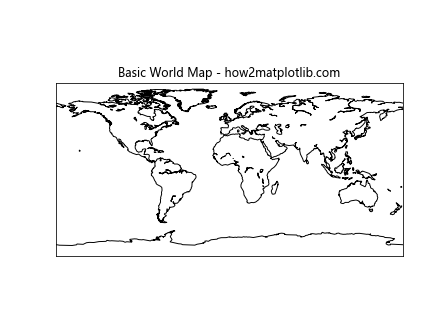
Creating a simple world map is straightforward with Basemap. Here’s how you can do it:
from mpl_toolkits.basemap import Basemap
import matplotlib.pyplot as plt

map = Basemap()
map.drawcoastlines()

plt.title("Basic World Map - how2matplotlib.com")
plt.show()
Output:
Plotting Points
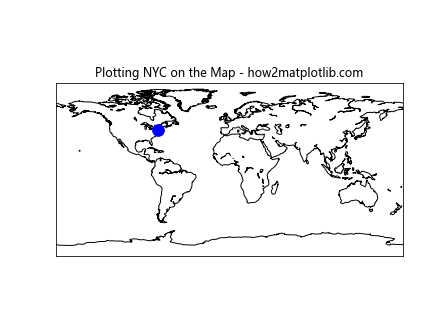
Adding points to a map, such as locations of cities or landmarks, is a common task. Here’s an example of how to plot a single point on the map:
from mpl_toolkits.basemap import Basemap
import matplotlib.pyplot as plt

map = Basemap()
map.drawcoastlines()

# New York City coordinates
lon, lat = -74.0060, 40.7128
x, y = map(lon, lat)

map.plot(x, y, 'bo', markersize=12)

plt.title("Plotting NYC on the Map - how2matplotlib.com")
plt.show()
Output:
Drawing Lines
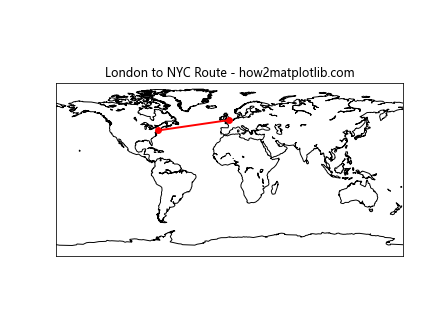
To draw lines on a map, for example, to represent routes or boundaries, you can use the plot method. Here’s an example:
from mpl_toolkits.basemap import Basemap
import matplotlib.pyplot as plt

map = Basemap()
map.drawcoastlines()

# Coordinates for London to NYC
london_lon, london_lat = -0.1278, 51.5074
nyc_lon, nyc_lat = -74.0060, 40.7128

x1, y1 = map(london_lon, london_lat)
x2, y2 = map(nyc_lon, nyc_lat)

map.plot([x1, x2], [y1, y2], marker='o', markersize=6, linewidth=2, color='r')

plt.title("London to NYC Route - how2matplotlib.com")
plt.show()
Output:
Plotting Polygons
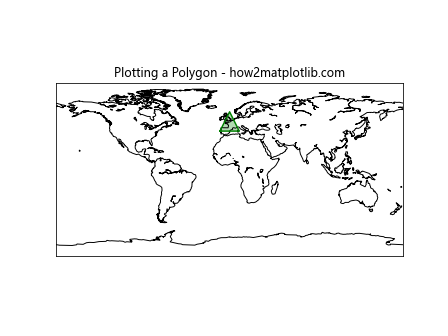
To represent areas, such as countries or regions, you can plot polygons. Here’s an example of plotting a simple triangle:
from mpl_toolkits.basemap import Basemap
import matplotlib.pyplot as plt

map = Basemap()
map.drawcoastlines()

poly_lon = [-10, 10, 0, -10]
poly_lat = [40, 40, 60, 40]

x, y = map(poly_lon, poly_lat)

map.plot(x, y, marker=None, color='g')

plt.fill(x, y, 'g', alpha=0.3)

plt.title("Plotting a Polygon - how2matplotlib.com")
plt.show()
Output:
Working with Projections
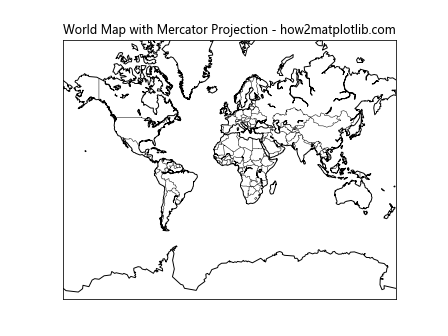
Basemap supports various map projections, allowing you to tailor your map’s look and feel. Here’s an example using the Mercator projection:
from mpl_toolkits.basemap import Basemap
import matplotlib.pyplot as plt

map = Basemap(projection='merc', llcrnrlat=-80, urcrnrlat=80, llcrnrlon=-180, urcrnrlon=180)

map.drawcoastlines()
map.drawcountries()

plt.title("World Map with Mercator Projection - how2matplotlib.com")
plt.show()
Output:
Adding Markers
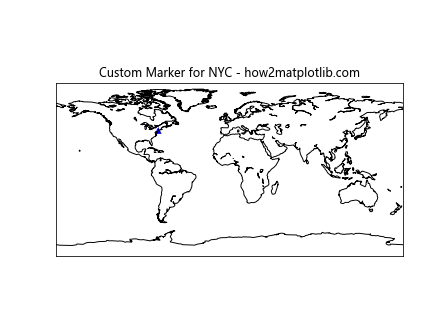
Markers can be used to highlight specific points on the map. Here’s how to add a custom marker:
from mpl_toolkits.basemap import Basemap
import matplotlib.pyplot as plt

map = Basemap()
map.drawcoastlines()

lon, lat = -74.0060, 40.7128  # New York City
x, y = map(lon, lat)

map.scatter(x, y, s=50, c='blue', marker='^', edgecolors='none')

plt.title("Custom Marker for NYC - how2matplotlib.com")
plt.show()
Output:
Customizing the Map Appearance
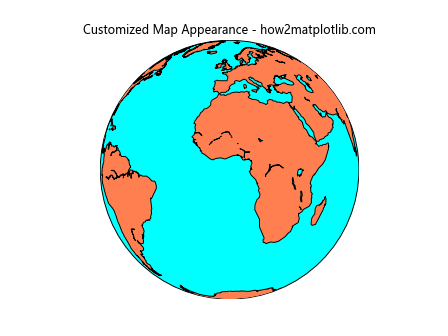
Basemap allows extensive customization, including changing the map background, adding a grid, and more. Here’s an example of a customized map:
from mpl_toolkits.basemap import Basemap
import matplotlib.pyplot as plt

map = Basemap(projection='ortho', lat_0=0, lon_0=0)
map.drawmapboundary(fill_color='aqua')
map.fillcontinents(color='coral',lake_color='aqua')
map.drawcoastlines()

plt.title("Customized Map Appearance - how2matplotlib.com")
plt.show()
Output:
Conclusion
Matplotlib Basemap is a powerful tool for geospatial data visualization, offering a wide range of features for creating detailed and customized maps. By following the examples provided in this article, you can start incorporating maps into your data visualization projects to provide clearer insights into geographical data. Whether you’re plotting simple points or creating complex, multi-layered visualizations, Basemap has the functionality you need to represent your data effectively.