Matplotlib Bar Graphs
Matplotlib is a comprehensive library for creating static, animated, and interactive visualizations in Python. Bar graphs, a common type of visualization, are used to compare different groups or to track changes over time. This article will guide you through creating various types of bar graphs using Matplotlib, providing detailed examples.
Introduction to Bar Graphs
Bar graphs represent data with rectangular bars with lengths proportional to the values they represent. They are a straightforward way to visualize data for comparison. In Matplotlib, bar graphs can be created using the bar() function for vertical bars or barh() for horizontal bars.
Basic Vertical Bar Graph
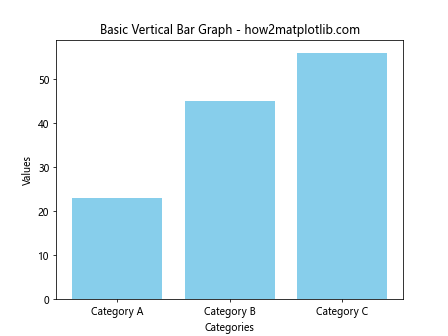
Let’s start with a simple vertical bar graph. The following example demonstrates how to create a basic vertical bar graph using Matplotlib.
import matplotlib.pyplot as plt

categories = ['Category A', 'Category B', 'Category C']
values = [23, 45, 56]

plt.bar(categories, values, color='skyblue')
plt.title('Basic Vertical Bar Graph - how2matplotlib.com')
plt.xlabel('Categories')
plt.ylabel('Values')
plt.show()
Output:
Basic Horizontal Bar Graph
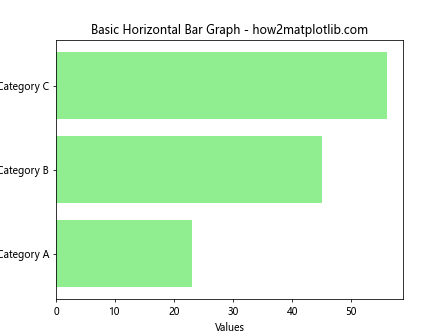
Similarly, creating a horizontal bar graph is straightforward with the barh() function.
import matplotlib.pyplot as plt

categories = ['Category A', 'Category B', 'Category C']
values = [23, 45, 56]

plt.barh(categories, values, color='lightgreen')
plt.title('Basic Horizontal Bar Graph - how2matplotlib.com')
plt.xlabel('Values')
plt.ylabel('Categories')
plt.show()
Output:
Customizing Bar Colors
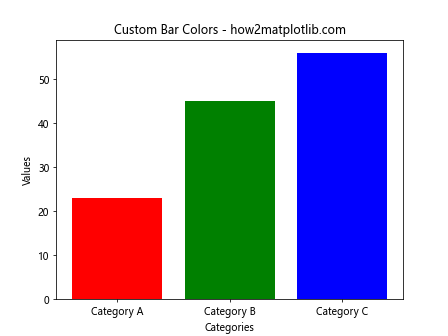
Customizing the colors of bars in a bar graph can make your chart more informative and visually appealing.
import matplotlib.pyplot as plt

categories = ['Category A', 'Category B', 'Category C']
values = [23, 45, 56]
colors = ['red', 'green', 'blue']

plt.bar(categories, values, color=colors)
plt.title('Custom Bar Colors - how2matplotlib.com')
plt.xlabel('Categories')
plt.ylabel('Values')
plt.show()
Output:
Adding Error Bars
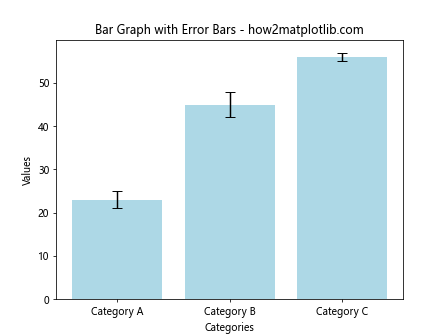
Error bars can be added to bar graphs to indicate the variability of the data.
import matplotlib.pyplot as plt
import numpy as np

categories = ['Category A', 'Category B', 'Category C']
values = [23, 45, 56]
errors = [2, 3, 1]

plt.bar(categories, values, yerr=errors, capsize=5, color='lightblue')
plt.title('Bar Graph with Error Bars - how2matplotlib.com')
plt.xlabel('Categories')
plt.ylabel('Values')
plt.show()
Output:
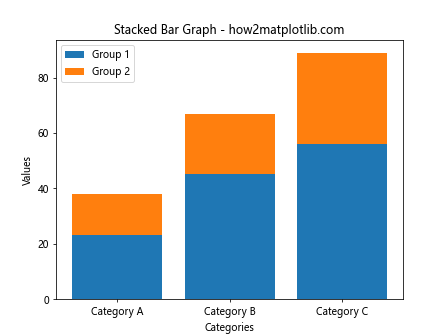
Stacked Bar Graph
Stacked bar graphs allow you to display the relationship between individual items and the whole in a different category.
import matplotlib.pyplot as plt

categories = ['Category A', 'Category B', 'Category C']
values1 = [23, 45, 56]
values2 = [15, 22, 33]

plt.bar(categories, values1, label='Group 1')
plt.bar(categories, values2, bottom=values1, label='Group 2')

plt.title('Stacked Bar Graph - how2matplotlib.com')
plt.xlabel('Categories')
plt.ylabel('Values')
plt.legend()
plt.show()
Output:
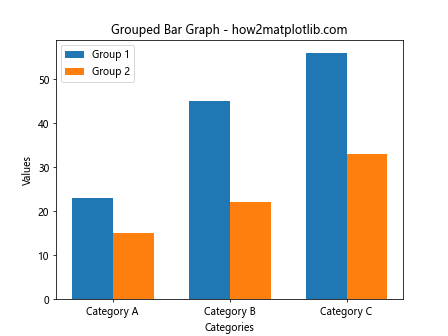
Grouped Bar Graph
Grouped bar graphs are useful for comparing multiple groups of data.
import matplotlib.pyplot as plt
import numpy as np

categories = ['Category A', 'Category B', 'Category C']
values1 = [23, 45, 56]
values2 = [15, 22, 33]

bar_width = 0.35
index = np.arange(len(categories))

plt.bar(index, values1, bar_width, label='Group 1')
plt.bar(index + bar_width, values2, bar_width, label='Group 2')

plt.title('Grouped Bar Graph - how2matplotlib.com')
plt.xlabel('Categories')
plt.ylabel('Values')
plt.xticks(index + bar_width / 2, categories)
plt.legend()
plt.show()
Output:
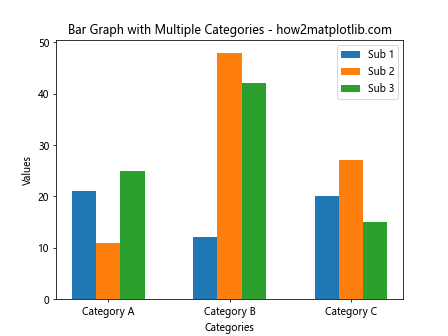
Bar Graph with Multiple Categories
Creating a bar graph with multiple categories involves plotting bars side by side for comparison.
import matplotlib.pyplot as plt
import numpy as np

categories = ['Category A', 'Category B', 'Category C']
sub_categories = ['Sub 1', 'Sub 2', 'Sub 3']
values = np.random.randint(10, 50, size=(3, 3))

bar_width = 0.2
index = np.arange(len(categories))

for i, sub in enumerate(sub_categories):
    plt.bar(index + i * bar_width, values[i], bar_width, label=sub)

plt.title('Bar Graph with Multiple Categories - how2matplotlib.com')
plt.xlabel('Categories')
plt.ylabel('Values')
plt.xticks(index + bar_width, categories)
plt.legend()
plt.show()
Output:
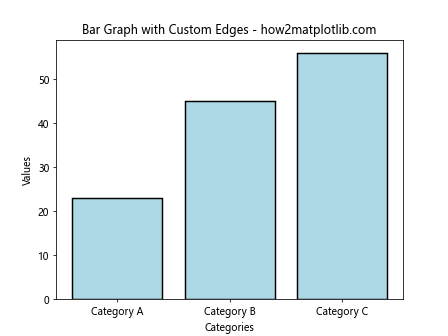
Customizing Bar Edges
Customizing the edges of bars can enhance the visual appeal of the graph.
import matplotlib.pyplot as plt

categories = ['Category A', 'Category B', 'Category C']
values = [23, 45, 56]

plt.bar(categories, values, color='lightblue', edgecolor='black', linewidth=1.5)
plt.title('Bar Graph with Custom Edges - how2matplotlib.com')
plt.xlabel('Categories')
plt.ylabel('Values')
plt.show()
Output:
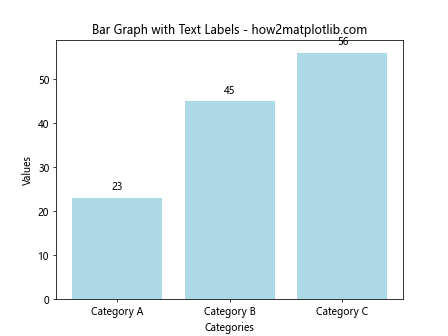
Adding Text Labels on Bars
Adding text labels on bars can make the data more readable and informative.
import matplotlib.pyplot as plt

categories = ['Category A', 'Category B', 'Category C']
values = [23, 45, 56]

bars = plt.bar(categories, values, color='lightblue')

for bar in bars:
    yval = bar.get_height()
    plt.text(bar.get_x() + bar.get_width()/2, yval + 1, yval, ha='center', va='bottom')

plt.title('Bar Graph with Text Labels - how2matplotlib.com')
plt.xlabel('Categories')
plt.ylabel('Values')
plt.show()
Output:
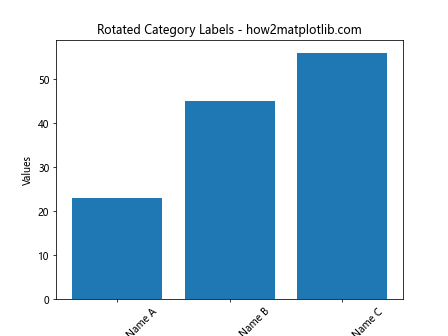
Rotating Category Labels
Long category labels can overlap, making them unreadable. Rotating the labels can solve this issue.
import matplotlib.pyplot as plt

categories = ['Long Category Name A', 'Long Category Name B', 'Long Category Name C']
values = [23, 45, 56]

plt.bar(categories, values)
plt.xticks(rotation=45)
plt.title('Rotated Category Labels - how2matplotlib.com')
plt.xlabel('Categories')
plt.ylabel('Values')
plt.show()
Output:
Conclusion
Matplotlib provides a versatile set of tools for creating bar graphs, from simple to complex. By customizing colors, adding labels, and adjusting the layout, you can convey a clear and compelling story with your data. The examples provided in this article demonstrate the flexibility of Matplotlib and serve as a foundation for creating your own bar graphs. Whether you’re comparing categories, showing changes over time, or highlighting the composition of different groups, bar graphs are an essential tool in your data visualization toolkit.