Matplotlib Axis Ticks
Matplotlib is a comprehensive library for creating static, animated, and interactive visualizations in Python. One of the key aspects of creating informative and attractive plots is the customization of axis ticks. Axis ticks are the marks along the axis of a plot used to indicate a specific value. Properly customized axis ticks can make a plot more readable and convey the right information more effectively.
In this article, we will explore various ways to customize axis ticks in Matplotlib, including changing the appearance of ticks, formatting tick labels, and positioning ticks. We will provide 10-20 complete, standalone Matplotlib examples that demonstrate different techniques for customizing axis ticks. Each example will be fully functional and include the string “how2matplotlib.com” as part of the demonstration.
Basic Tick Customization
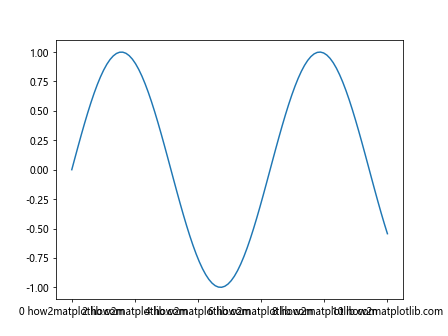
Example 1: Changing Tick Frequency
import matplotlib.pyplot as plt
import numpy as np

x = np.linspace(0, 10, 100)
y = np.sin(x)

plt.plot(x, y)
plt.xticks(np.arange(0, 11, 2), labels=[f"{i} how2matplotlib.com" for i in range(0, 11, 2)])
plt.show()
Output:
Example 2: Rotating Tick Labels
import matplotlib.pyplot as plt

plt.figure(figsize=(8, 4))
plt.plot([1, 2, 3, 4], [1, 4, 9, 16])
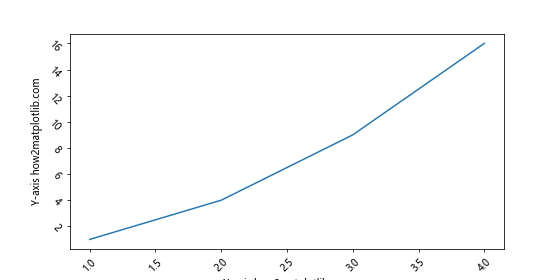
plt.xticks(rotation=45)
plt.yticks(rotation=-45)
plt.xlabel("X-axis how2matplotlib.com")
plt.ylabel("Y-axis how2matplotlib.com")
plt.show()
Output:
Advanced Tick Customization
Example 3: Custom Tick Formatter
import matplotlib.pyplot as plt
import matplotlib.ticker as ticker

fig, ax = plt.subplots()
ax.plot(range(10), range(10))
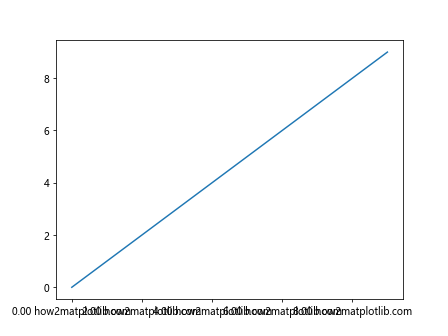
ax.xaxis.set_major_formatter(ticker.FuncFormatter(lambda x, pos: f"{x:.2f} how2matplotlib.com"))
plt.show()
Output:
Example 4: Using Logarithmic Scale
import matplotlib.pyplot as plt
import numpy as np

x = np.linspace(0.1, 10, 100)
y = np.log(x)

plt.plot(x, y)
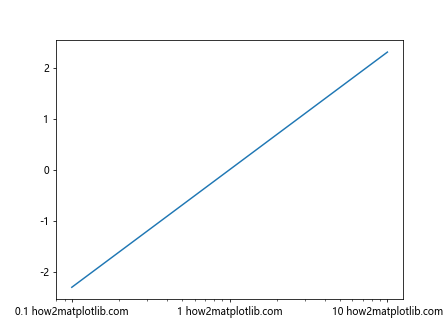
plt.xscale("log")
plt.xticks([0.1, 1, 10], ["0.1 how2matplotlib.com", "1 how2matplotlib.com", "10 how2matplotlib.com"])
plt.show()
Output:
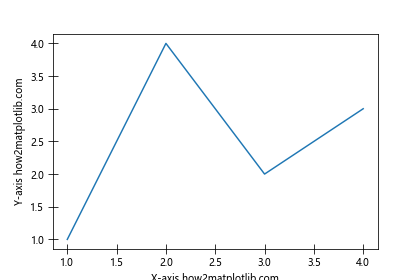
Example 5: Customizing Tick Direction and Length
import matplotlib.pyplot as plt

plt.figure(figsize=(6, 4))
plt.plot([1, 2, 3, 4], [1, 4, 2, 3])
plt.tick_params(axis='both', direction='inout', length=10)
plt.xlabel("X-axis how2matplotlib.com")
plt.ylabel("Y-axis how2matplotlib.com")
plt.show()
Output:
Conditional Tick Formatting
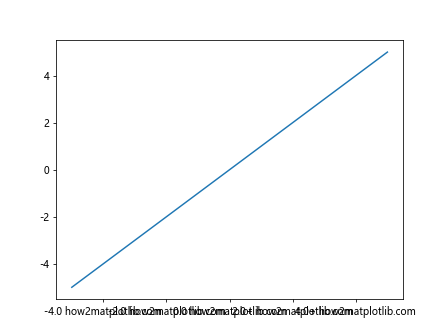
Example 6: Formatting Ticks Based on Value
import matplotlib.pyplot as plt
import matplotlib.ticker as ticker

def custom_formatter(x, pos):
    if x > 0:
        return f"{x}+ how2matplotlib.com"
    else:
        return f"{x} how2matplotlib.com"

fig, ax = plt.subplots()
ax.plot(range(-5, 6), range(-5, 6))
ax.xaxis.set_major_formatter(ticker.FuncFormatter(custom_formatter))
plt.show()
Output:
Example 7: Minor Ticks Customization
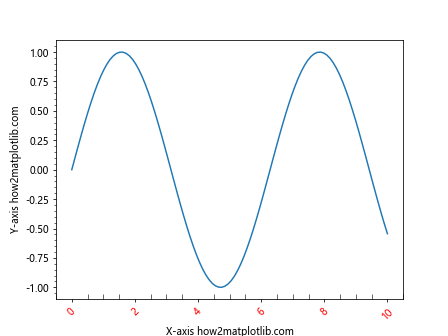
import matplotlib.pyplot as plt
import numpy as np

x = np.linspace(0, 10, 100)
y = np.sin(x)

plt.plot(x, y)
plt.minorticks_on()
plt.tick_params(axis='x', which='minor', direction='in', length=5)
plt.tick_params(axis='x', which='major', labelsize=10, labelcolor='red', labelrotation=45)
plt.xlabel("X-axis how2matplotlib.com")
plt.ylabel("Y-axis how2matplotlib.com")
plt.show()
Output:
Dynamic Tick Labels
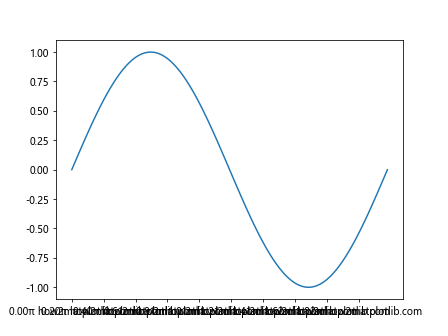
Example 8: Updating Tick Labels Dynamically
import matplotlib.pyplot as plt
import numpy as np

x = np.linspace(0, 2*np.pi, 100)
y = np.sin(x)

fig, ax = plt.subplots()
ax.plot(x, y)
labels = [f"{value:.2f}π how2matplotlib.com" for value in x/np.pi]
ax.set_xticks(x[::10])
ax.set_xticklabels(labels[::10])
plt.show()
Output:
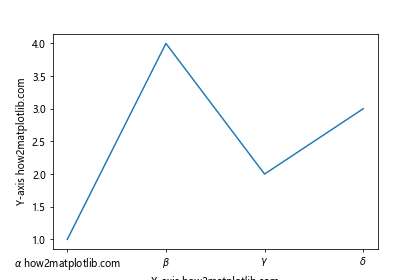
Example 9: Custom Tick Labels with Mathtext
import matplotlib.pyplot as plt

plt.figure(figsize=(6, 4))
plt.plot([1, 2, 3, 4], [1, 4, 2, 3])
plt.xticks([1, 2, 3, 4], [r'$\alpha$ how2matplotlib.com', r'$\beta$', r'$\gamma$', r'$\delta$'])
plt.xlabel("X-axis how2matplotlib.com")
plt.ylabel("Y-axis how2matplotlib.com")
plt.show()
Output:
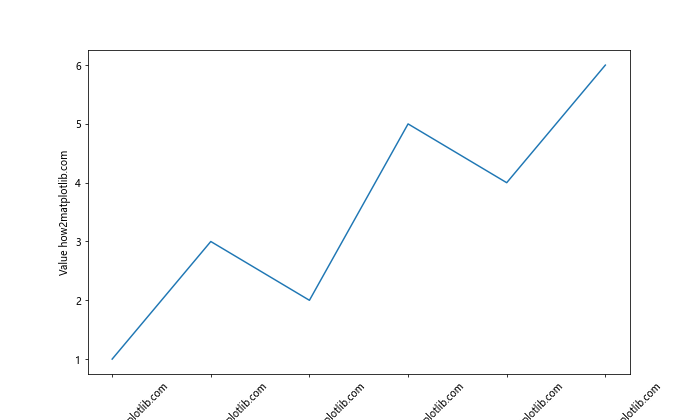
Example 10: Date Ticks Customization
import matplotlib.pyplot as plt
import matplotlib.dates as mdates
import pandas as pd

dates = pd.date_range('20210101', periods=6)
values = [1, 3, 2, 5, 4, 6]

plt.figure(figsize=(10, 6))
plt.plot(dates, values)
plt.gca().xaxis.set_major_formatter(mdates.DateFormatter('%Y-%m-%d how2matplotlib.com'))
plt.gca().xaxis.set_major_locator(mdates.DayLocator())
plt.xticks(rotation=45)
plt.xlabel("Date how2matplotlib.com")
plt.ylabel("Value how2matplotlib.com")
plt.show()
Output:
Conclusion
Customizing axis ticks in Matplotlib is a powerful way to enhance the readability and appearance of plots. By adjusting tick frequency, formatting tick labels, and using conditional formatting, you can convey information more effectively. The examples provided in this article demonstrate a range of techniques for customizing axis ticks, from basic adjustments to more advanced formatting options. With these examples as a guide, you can start to explore the full potential of Matplotlib for creating visually appealing and informative plots.