Matplotlib Axis Scales
Matplotlib is a comprehensive library for creating static, animated, and interactive visualizations in Python. One of the key features that Matplotlib offers is the ability to control and customize the scales of axes in a plot. This capability allows for the representation of data in a way that best suits its nature and the message it is intended to convey. In this article, we will explore the various axis scales available in Matplotlib, how to apply them, and when they are most appropriately used. We will provide detailed examples with complete, standalone Matplotlib code for each case.
Understanding Axis Scales
Axis scales in Matplotlib determine how data is mapped to the axes of a plot. The scale of an axis can be linear, logarithmic, or even more complex, depending on the type of data and the desired visualization. Changing the scale of an axis can significantly alter the appearance of a plot and make certain patterns or trends in the data more apparent.
Linear Scale
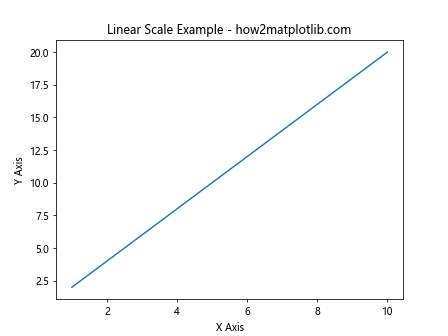
The linear scale is the default scale used in Matplotlib. It represents data by mapping it linearly to the plot’s axes. This means that equal differences in values are represented by equal differences in distance on the axis.
Example 1: Basic Linear Scale Plot
import matplotlib.pyplot as plt

x = range(1, 11)
y = [2 * xi for xi in x]
plt.plot(x, y)
plt.title('Linear Scale Example - how2matplotlib.com')
plt.xlabel('X Axis')
plt.ylabel('Y Axis')
plt.show()
Output:

Logarithmic Scale
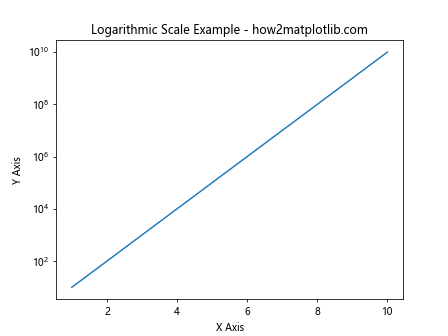
The logarithmic scale is useful for data that spans several orders of magnitude. It represents data by mapping its logarithm to the plot’s axes, which can make trends in data that vary widely in scale more visible.
Example 2: Basic Logarithmic Scale Plot
import matplotlib.pyplot as plt

x = range(1, 11)
y = [10 ** xi for xi in x]
plt.plot(x, y)
plt.yscale('log')
plt.title('Logarithmic Scale Example - how2matplotlib.com')
plt.xlabel('X Axis')
plt.ylabel('Y Axis')
plt.show()
Output:

Symmetrical Log Scale
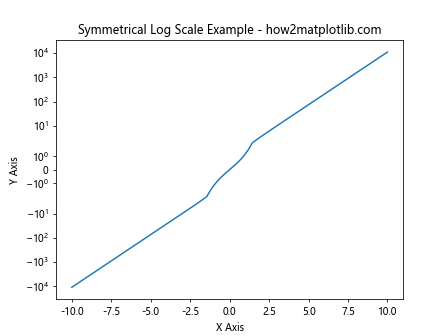
The symmetrical log scale is similar to the logarithmic scale but can handle negative values as well. It is particularly useful when the data spans several orders of magnitude both above and below zero.
Example 3: Symmetrical Log Scale Plot
import matplotlib.pyplot as plt
import numpy as np

x = np.linspace(-10, 10, 400)
y = np.sinh(x)
plt.plot(x, y)
plt.yscale('symlog')
plt.title('Symmetrical Log Scale Example - how2matplotlib.com')
plt.xlabel('X Axis')
plt.ylabel('Y Axis')
plt.show()
Output:

Logit Scale
The logit scale is useful for data that is bounded between 0 and 1, such as probabilities. It transforms the data using the logit function, making small differences near 0 and 1 more visible.
Example 4: Logit Scale Plot
import matplotlib.pyplot as plt
import numpy as np

x = np.linspace(0.01, 0.99, 400)
y = np.logit(x)
plt.plot(x, y)
plt.yscale('logit')
plt.title('Logit Scale Example - how2matplotlib.com')
plt.xlabel('X Axis')
plt.ylabel('Y Axis')
plt.show()
Custom Scales
Matplotlib also allows for the creation of custom scales. This feature can be used to create plots with non-standard scales tailored to specific datasets or visualization needs.
Example 5: Custom Scale Plot
This example requires creating a custom scale, which involves more advanced usage of Matplotlib’s internals. For simplicity, we will not include a custom scale example here, but interested readers are encouraged to explore Matplotlib’s documentation and examples for creating custom scales.
Applying Different Scales to Each Axis
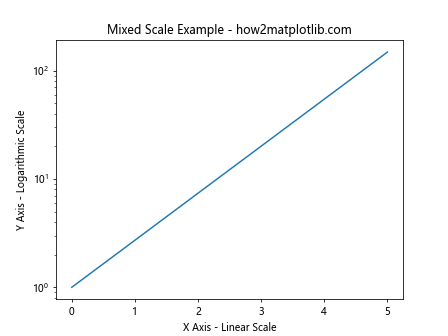
In some cases, it may be useful to apply different scales to the x and y axes of a plot. Matplotlib makes this easy to do.
Example 6: Different Scales for X and Y Axes
import matplotlib.pyplot as plt
import numpy as np

x = np.linspace(0, 5, 100)
y = np.exp(x)
plt.plot(x, y)
plt.xscale('linear')
plt.yscale('log')
plt.title('Mixed Scale Example - how2matplotlib.com')
plt.xlabel('X Axis - Linear Scale')
plt.ylabel('Y Axis - Logarithmic Scale')
plt.show()
Output:

Conclusion
Matplotlib’s flexibility with axis scales allows for effective representation of a wide range of data types and relationships. By selecting the appropriate scale—whether linear, logarithmic, symmetrical log, logit, or a custom scale—data visualization can be tailored to highlight the most important aspects of the data. The examples provided in this article demonstrate the basic usage of different scales in Matplotlib and serve as a starting point for exploring the library’s powerful visualization capabilities. Remember, the key to effective data visualization is not only in choosing the right type of plot but also in customizing the scales and other aspects of the plot to best represent the underlying data.