Matplotlib Axis Ranges
Matplotlib is a comprehensive library for creating static, animated, and interactive visualizations in Python. One of the fundamental aspects of creating charts is the ability to customize axis ranges. This article delves into various methods to set and manipulate axis ranges in Matplotlib, ensuring your data is presented accurately and effectively.
Setting Axis Ranges
Setting axis ranges in Matplotlib can be done in several ways, depending on the level of control and customization required. We’ll explore methods using plt.xlim(), plt.ylim(), ax.set_xlim(), and ax.set_ylim() functions, among others.
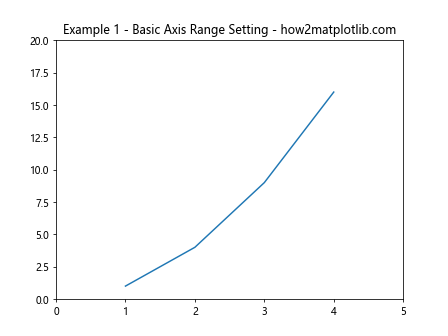
Example 1: Basic Axis Range Setting
import matplotlib.pyplot as plt

plt.plot([1, 2, 3, 4], [1, 4, 9, 16])
plt.xlim(0, 5)
plt.ylim(0, 20)
plt.title("Example 1 - Basic Axis Range Setting - how2matplotlib.com")
plt.show()
Output:
Example 2: Using set_xlim() and set_ylim()
import matplotlib.pyplot as plt

fig, ax = plt.subplots()
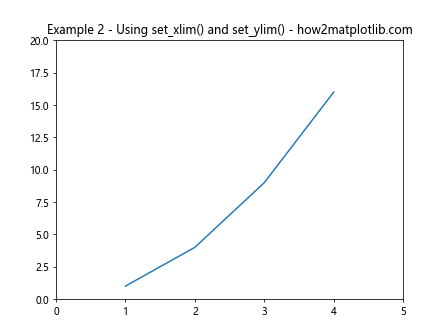
ax.plot([1, 2, 3, 4], [1, 4, 9, 16])
ax.set_xlim(0, 5)
ax.set_ylim(0, 20)
ax.set_title("Example 2 - Using set_xlim() and set_ylim() - how2matplotlib.com")
plt.show()
Output:
Example 3: Inverting Axes
import matplotlib.pyplot as plt

fig, ax = plt.subplots()
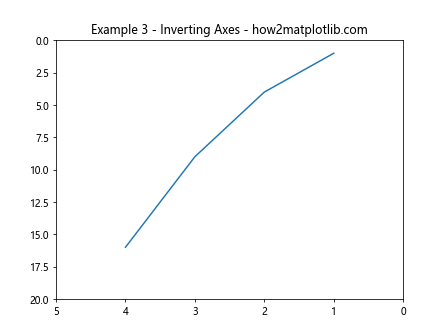
ax.plot([1, 2, 3, 4], [1, 4, 9, 16])
ax.set_xlim(5, 0)
ax.set_ylim(20, 0)
ax.set_title("Example 3 - Inverting Axes - how2matplotlib.com")
plt.show()
Output:
Example 4: Dynamic Range Setting
import matplotlib.pyplot as plt
import numpy as np

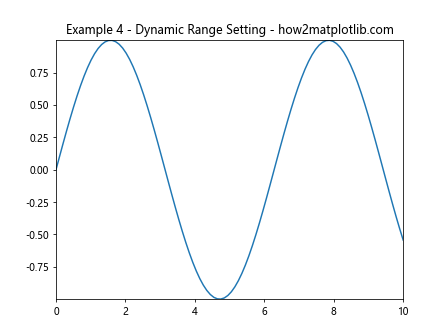
x = np.linspace(0, 10, 100)
y = np.sin(x)

plt.plot(x, y)
plt.xlim(min(x), max(x))
plt.ylim(min(y), max(y))
plt.title("Example 4 - Dynamic Range Setting - how2matplotlib.com")
plt.show()
Output:
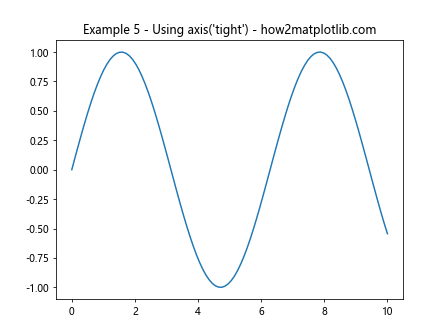
Example 5: Using axis('tight')
import matplotlib.pyplot as plt
import numpy as np

x = np.linspace(0, 10, 100)
y = np.sin(x)

plt.plot(x, y)
plt.axis('tight')
plt.title("Example 5 - Using axis('tight') - how2matplotlib.com")
plt.show()
Output:
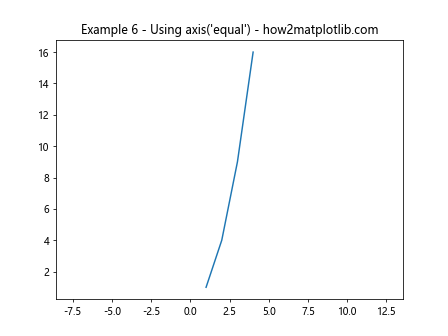
Example 6: Using axis('equal')
import matplotlib.pyplot as plt

plt.plot([1, 2, 3, 4], [1, 4, 9, 16])
plt.axis('equal')
plt.title("Example 6 - Using axis('equal') - how2matplotlib.com")
plt.show()
Output:
Example 7: Setting Axis Range with Dates
import matplotlib.pyplot as plt
import pandas as pd

dates = pd.date_range('20230101', periods=6)
values = [1, 4, 9, 16, 25, 36]

plt.plot(dates, values)
plt.xlim("2023-01-01", "2023-01-06")
plt.title("Example 7 - Setting Axis Range with Dates - how2matplotlib.com")
plt.show()
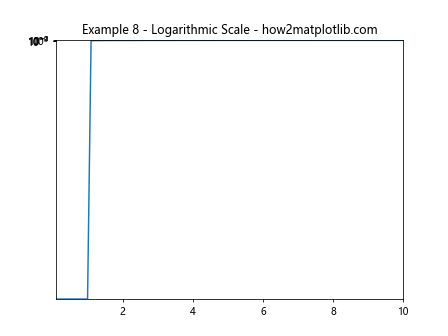
Example 8: Logarithmic Scale
import matplotlib.pyplot as plt
import numpy as np

x = np.linspace(0.1, 10, 100)
y = np.log(x)

plt.plot(x, y)
plt.xlim(0.1, 10)
plt.ylim(-2, 3)
plt.yscale('log')
plt.title("Example 8 - Logarithmic Scale - how2matplotlib.com")
plt.show()
Output:
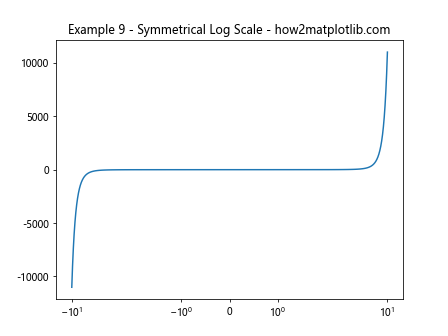
Example 9: Symmetrical Log Scale
import matplotlib.pyplot as plt
import numpy as np

x = np.linspace(-10, 10, 100)
y = np.sinh(x)

plt.plot(x, y)
plt.xscale('symlog')
plt.title("Example 9 - Symmetrical Log Scale - how2matplotlib.com")
plt.show()
Output:
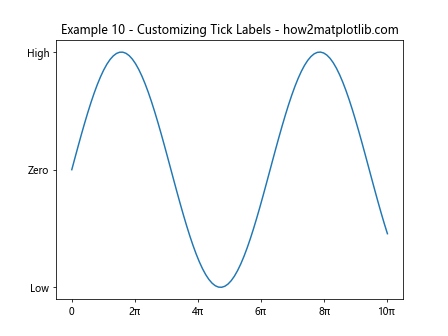
Example 10: Customizing Tick Labels
import matplotlib.pyplot as plt
import numpy as np

x = np.linspace(0, 10, 100)
y = np.sin(x)

plt.plot(x, y)
plt.xticks([0, 2, 4, 6, 8, 10], ['0', '2π', '4π', '6π', '8π', '10π'])
plt.yticks([-1, 0, 1], ['Low', 'Zero', 'High'])
plt.title("Example 10 - Customizing Tick Labels - how2matplotlib.com")
plt.show()
Output:
Conclusion
In this article, we explored various methods to set and adjust axis ranges in Matplotlib, providing a foundation for creating visually appealing and accurately scaled plots. By customizing axis ranges, you can ensure that your charts effectively communicate the intended data insights. Whether you’re working with static datasets or dynamic data sources, understanding how to manipulate axis ranges in Matplotlib is a crucial skill for any data visualization task.