Matplotlib Axes Class
Matplotlib is a comprehensive library for creating static, animated, and interactive visualizations in Python. The Axes class is one of the core components of Matplotlib, providing the space where data is plotted. It is the area on which we draw with functions like plot(), scatter(), and many others, and it can also contain various helper elements like labels, ticks, and legends. Understanding the Axes class is crucial for customizing your plots for better data visualization.
This article will delve deep into the Axes class, exploring its functionalities and how to manipulate it for creating effective and visually appealing plots. We will cover a range of examples to demonstrate the versatility of the Axes class in Matplotlib.
Basic Axes Usage
Before diving into the examples, it’s important to understand that an Axes object is part of a figure, and a figure can contain one or more axes. The Axes contains two (or three in the case of 3D) Axis objects which take care of the data limits. Let’s start with some basic examples.
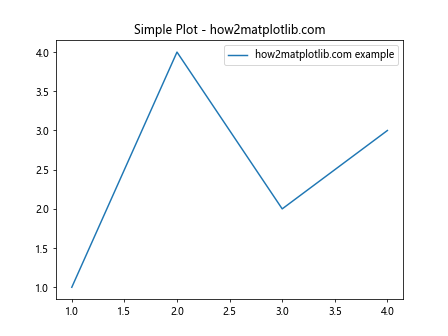
Example 1: Creating a Simple Plot
import matplotlib.pyplot as plt

fig, ax = plt.subplots()
ax.plot([1, 2, 3, 4], [1, 4, 2, 3], label='how2matplotlib.com example')
ax.set_title('Simple Plot - how2matplotlib.com')
ax.legend()
plt.show()
Output:
Example 2: Adding Labels
import matplotlib.pyplot as plt

fig, ax = plt.subplots()
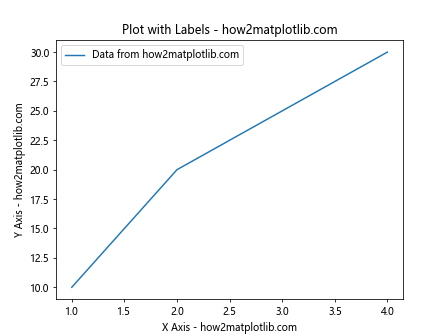
ax.plot([1, 2, 3, 4], [10, 20, 25, 30], label='Data from how2matplotlib.com')
ax.set_xlabel('X Axis - how2matplotlib.com')
ax.set_ylabel('Y Axis - how2matplotlib.com')
ax.set_title('Plot with Labels - how2matplotlib.com')
ax.legend()
plt.show()
Output:
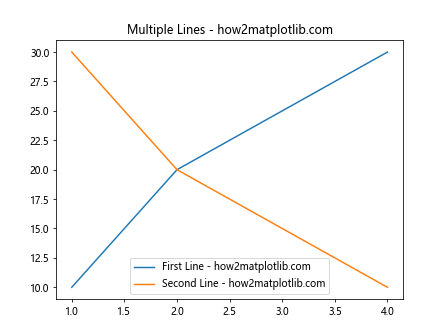
Example 3: Multiple Lines on the Same Axes
import matplotlib.pyplot as plt

fig, ax = plt.subplots()
ax.plot([1, 2, 3, 4], [10, 20, 25, 30], label='First Line - how2matplotlib.com')
ax.plot([1, 2, 3, 4], [30, 20, 15, 10], label='Second Line - how2matplotlib.com')
ax.set_title('Multiple Lines - how2matplotlib.com')
ax.legend()
plt.show()
Output:
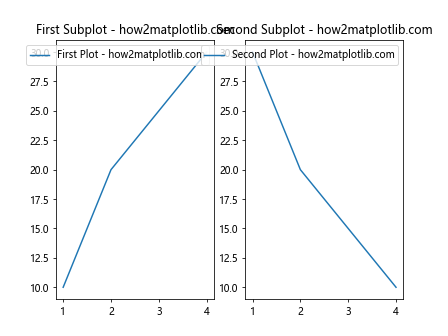
Example 4: Creating Subplots
import matplotlib.pyplot as plt

fig, (ax1, ax2) = plt.subplots(1, 2)
ax1.plot([1, 2, 3, 4], [10, 20, 25, 30], label='First Plot - how2matplotlib.com')
ax2.plot([1, 2, 3, 4], [30, 20, 15, 10], label='Second Plot - how2matplotlib.com')
ax1.set_title('First Subplot - how2matplotlib.com')
ax2.set_title('Second Subplot - how2matplotlib.com')
ax1.legend()
ax2.legend()
plt.show()
Output:
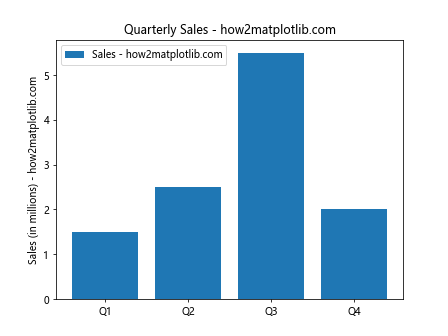
Example 5: Bar Charts
import matplotlib.pyplot as plt
import numpy as np

x = np.arange(4)
money = [1.5, 2.5, 5.5, 2.0]

fig, ax = plt.subplots()
ax.bar(x, money, label='Sales - how2matplotlib.com')
ax.set_xticks(x)
ax.set_xticklabels(['Q1', 'Q2', 'Q3', 'Q4'])
ax.set_ylabel('Sales (in millions) - how2matplotlib.com')
ax.set_title('Quarterly Sales - how2matplotlib.com')
ax.legend()
plt.show()
Output:
Example 6: Scatter Plots
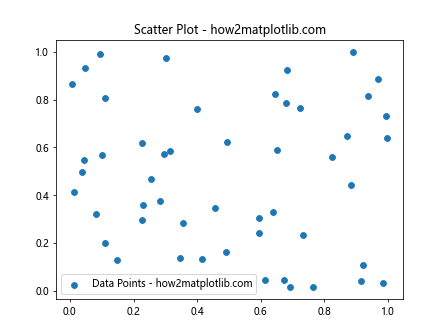
import matplotlib.pyplot as plt
import numpy as np

x = np.random.rand(50)
y = np.random.rand(50)

fig, ax = plt.subplots()
ax.scatter(x, y, label='Data Points - how2matplotlib.com')
ax.set_title('Scatter Plot - how2matplotlib.com')
ax.legend()
plt.show()
Output:
Example 7: Histograms
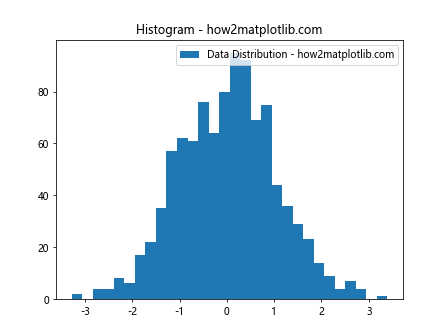
import matplotlib.pyplot as plt
import numpy as np

data = np.random.randn(1000)

fig, ax = plt.subplots()
ax.hist(data, bins=30, label='Data Distribution - how2matplotlib.com')
ax.set_title('Histogram - how2matplotlib.com')
ax.legend()
plt.show()
Output:
Example 8: Pie Charts
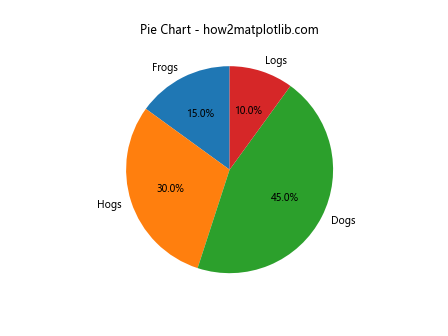
import matplotlib.pyplot as plt

sizes = [15, 30, 45, 10]
labels = ['Frogs', 'Hogs', 'Dogs', 'Logs']

fig, ax = plt.subplots()
ax.pie(sizes, labels=labels, autopct='%1.1f%%', startangle=90)
ax.set_title('Pie Chart - how2matplotlib.com')
plt.show()
Output:
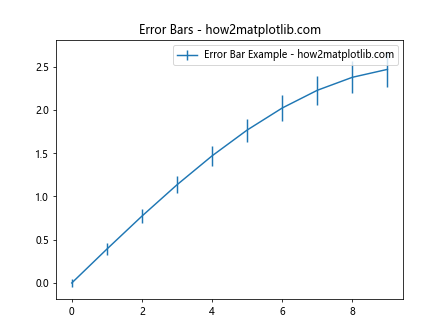
Example 9: Error Bars
import matplotlib.pyplot as plt
import numpy as np

x = np.arange(10)
y = 2.5 * np.sin(x / 20 * np.pi)
yerr = np.linspace(0.05, 0.2, 10)

fig, ax = plt.subplots()
ax.errorbar(x, y, yerr=yerr, label='Error Bar Example - how2matplotlib.com')
ax.set_title('Error Bars - how2matplotlib.com')
ax.legend()
plt.show()
Output:
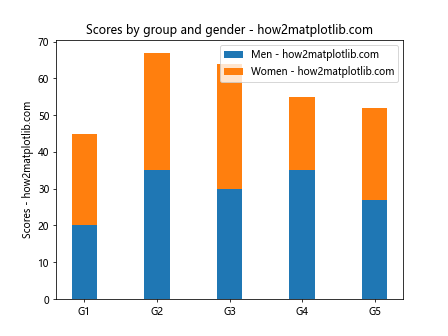
Example 10: Stacked Bar Charts
import matplotlib.pyplot as plt
import numpy as np

N = 5
menMeans = [20, 35, 30, 35, 27]
womenMeans = [25, 32, 34, 20, 25]

ind = np.arange(N)
width = 0.35

fig, ax = plt.subplots()
ax.bar(ind, menMeans, width, label='Men - how2matplotlib.com')
ax.bar(ind, womenMeans, width, bottom=menMeans, label='Women - how2matplotlib.com')

ax.set_ylabel('Scores - how2matplotlib.com')
ax.set_title('Scores by group and gender - how2matplotlib.com')
ax.set_xticks(ind)
ax.set_xticklabels(('G1', 'G2', 'G3', 'G4', 'G5'))
ax.legend()

plt.show()
Output:
These examples provide a glimpse into the versatility of the Axes class in Matplotlib. From simple line plots to complex visualizations like stacked bar charts and pie charts, the Axes class serves as the foundation for creating a wide range of plots. By understanding how to manipulate the Axes object, you can customize your plots to effectively communicate your data’s story.