Matplotlib Barplot
Matplotlib is a powerful visualization library in Python that allows you to create various types of plots. In this article, we will focus on creating barplots using Matplotlib. Barplots are useful for comparing categories or displaying aggregated data.
Basic Barplot
First, let’s create a basic barplot using some example data.
import matplotlib.pyplot as plt

# Data
categories = ['A', 'B', 'C', 'D']
values = [10, 20, 15, 25]

# Plot
plt.bar(categories, values)
plt.xlabel('Categories')
plt.ylabel('Values')
plt.title('Basic Barplot')
plt.show()
Output:
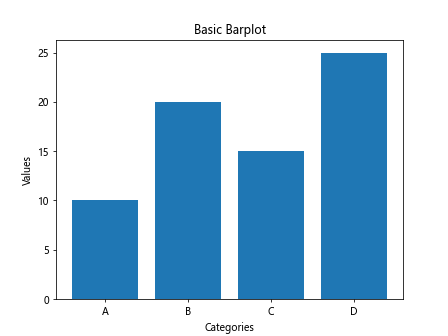
In this example, we have defined the categories and corresponding values, then created a simple barplot.
Customizing Barplots
You can customize barplots by changing colors, adding labels, and adjusting the bar width.
import matplotlib.pyplot as plt
import numpy as np

# Data
categories = ['A', 'B', 'C', 'D']
values = [10, 20, 15, 25]

# Customization
colors = ['blue', 'green', 'red', 'purple']
plt.bar(categories, values, color=colors, width=0.5)
plt.xlabel('Categories')
plt.ylabel('Values')
plt.title('Customized Barplot')
plt.show()
Output:
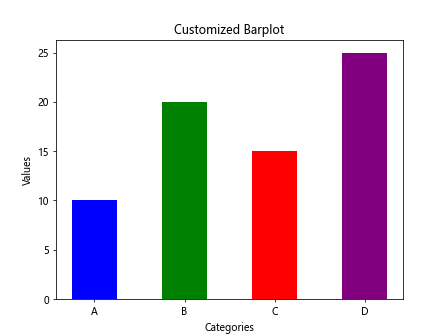
This code snippet customizes the barplot by changing colors and adjusting the bar width.
Stacked Barplot
You can create stacked barplots to show the contribution of different components to the total value.
import matplotlib.pyplot as plt
import numpy as np

# Data
categories = ['A', 'B', 'C', 'D']
values1 = [10, 20, 15, 25]
values2 = [5, 15, 10, 20]

# Stacked Barplot
plt.bar(categories, values1, label='Group 1')
plt.bar(categories, values2, bottom=values1, label='Group 2')
plt.xlabel('Categories')
plt.ylabel('Values')
plt.title('Stacked Barplot')
plt.legend()
plt.show()
Output:
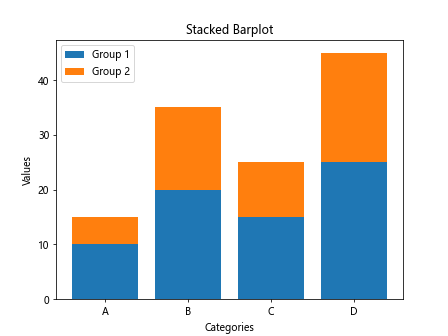
In this example, we have created a stacked barplot to display two groups of data.
Horizontal Barplot
You can also create horizontal barplots by using the barh function.
import matplotlib.pyplot as plt
import numpy as np

# Data
categories = ['A', 'B', 'C', 'D']
values = [10, 20, 15, 25]

# Horizontal Barplot
plt.barh(categories, values, color='skyblue')
plt.xlabel('Values')
plt.ylabel('Categories')
plt.title('Horizontal Barplot')
plt.show()
Output:
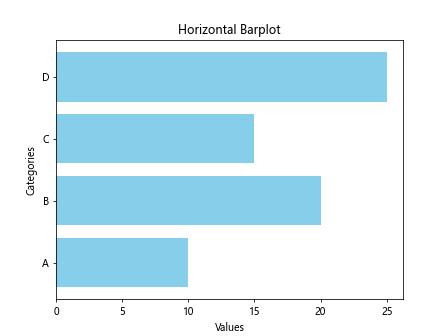
This code snippet creates a horizontal barplot instead of the default vertical barplot.
Grouped Barplot
Grouped barplots allow you to compare multiple groups within each category.
import matplotlib.pyplot as plt
import numpy as np

# Data
categories = ['A', 'B', 'C', 'D']
values1 = [10, 20, 15, 25]
values2 = [5, 15, 10, 20]

# Grouped Barplot
bar_width = 0.4
plt.bar(np.arange(len(categories)), values1, width=bar_width, label='Group 1')
plt.bar(np.arange(len(categories)) + bar_width, values2, width=bar_width, label='Group 2')
plt.xlabel('Categories')
plt.ylabel('Values')
plt.xticks(np.arange(len(categories)) + bar_width/2, categories)
plt.title('Grouped Barplot')
plt.legend()
plt.show()
Output:
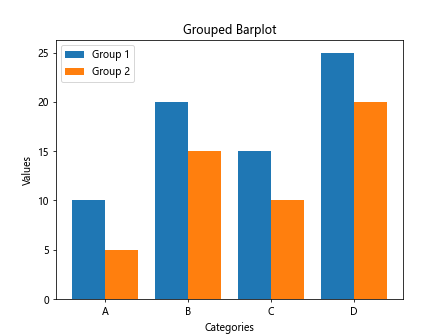
This example demonstrates how to create a grouped barplot with two groups of data.
Barplot with Error Bars
You can add error bars to barplots to show variability or uncertainty in data.
import matplotlib.pyplot as plt
import numpy as np

# Data
categories = ['A', 'B', 'C', 'D']
values = [10, 20, 15, 25]
errors = [1, 2, 1.5, 2.5]

# Barplot with Error Bars
plt.bar(categories, values, yerr=errors, capsize=5)
plt.xlabel('Categories')
plt.ylabel('Values')
plt.title('Barplot with Error Bars')
plt.show()
Output:
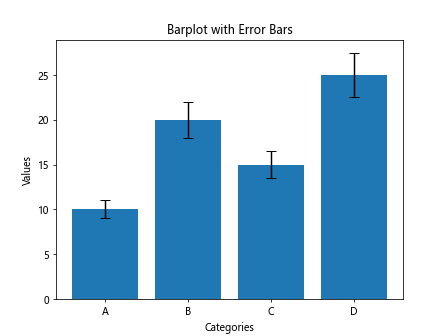
This code snippet adds error bars to the barplot, indicating the uncertainty in the data.
Horizontal Stacked Barplot
You can create horizontal stacked barplots as well by modifying the orientation.
import matplotlib.pyplot as plt
import numpy as np

# Data
categories = ['A', 'B', 'C', 'D']
values1 = [10, 20, 15, 25]
values2 = [5, 15, 10, 20]

# Horizontal Stacked Barplot
plt.barh(categories, values1, label='Group 1')
plt.barh(categories, values2, left=values1, label='Group 2')
plt.xlabel('Values')
plt.ylabel('Categories')
plt.title('Horizontal Stacked Barplot')
plt.legend()
plt.show()
Output:
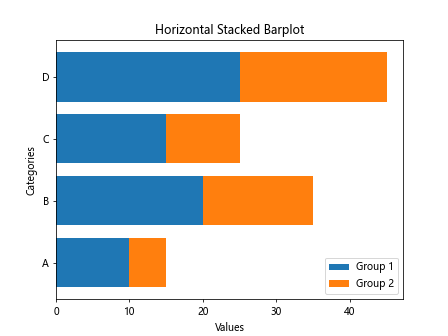
This example creates a horizontal stacked barplot to compare two groups of data.
Barplot with Colors
You can assign specific colors to each bar in the barplot for better visualization.
import matplotlib.pyplot as plt
import numpy as np

# Data
categories = ['A', 'B', 'C', 'D']
values = [10, 20, 15, 25]
colors = ['red', 'green', 'blue', 'purple']

# Barplot with Colors
plt.bar(categories, values, color=colors)
plt.xlabel('Categories')
plt.ylabel('Values')
plt.title('Barplot with Colors')
plt.show()
Output:
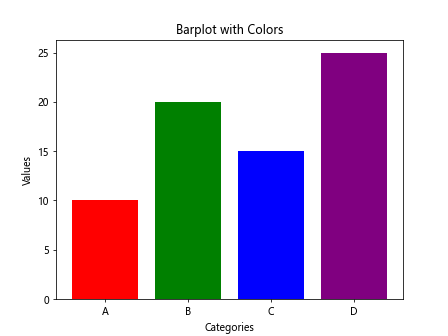
This code snippet sets custom colors for each bar in the barplot.
Barplot with Labels
You can add data labels to the bars to display the exact values.
import matplotlib.pyplot as plt
import numpy as np

# Data
categories = ['A', 'B', 'C', 'D']
values = [10, 20, 15, 25]

# Barplot with Labels
plt.bar(categories, values)
for i, v in enumerate(values):
    plt.text(i, v + 0.5, str(v), ha='center')
plt.xlabel('Categories')
plt.ylabel('Values')
plt.title('Barplot with Labels')
plt.show()
Output:
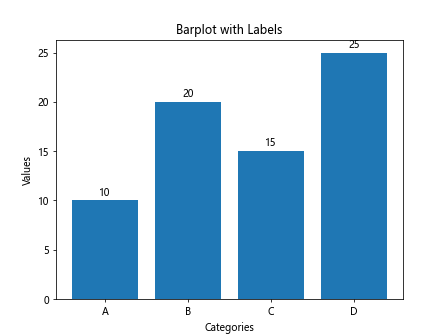
In this example, we have added data labels to each bar in the barplot.
Grouped Barplot with Error Bars
You can combine grouped barplots with error bars for a comprehensive visualization.
import matplotlib.pyplot as plt
import numpy as np

# Data
categories = ['A', 'B', 'C', 'D']
values1 = [10, 20, 15, 25]
errors1 = [1, 2, 1.5, 2.5]
values2 = [5, 15, 10, 20]
errors2 = [0.5, 1.5, 1, 2]

# Grouped Barplot with Error Bars
bar_width = 0.4
plt.bar(np.arange(len(categories)), values1, width=bar_width, yerr=errors1, label='Group 1')
plt.bar(np.arange(len(categories)) + bar_width, values2, width=bar_width, yerr=errors2, label='Group 2')
plt.xlabel('Categories')
plt.ylabel('Values')
plt.xticks(np.arange(len(categories)) + bar_width/2, categories)
plt.title('Grouped Barplot with Error Bars')
plt.legend()
plt.show()
Output:
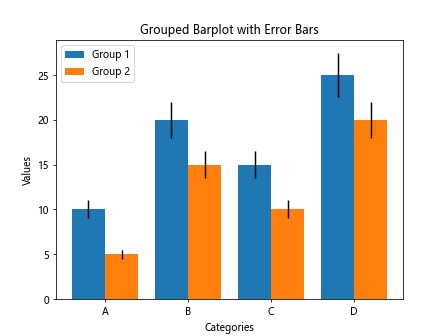
This example combines grouped barplots with error bars to show the variability in data for each group.
Grouped and Stacked Barplot
You can create a combination of grouped and stacked barplots for a more complex visualization.
import matplotlib.pyplot as plt
import numpy as np

# Data
categories = ['A', 'B', 'C', 'D']
values1 = [10, 20, 15, 25]
values2 = [5, 15, 10, 20]

# Grouped and Stacked Barplot
bar_width = 0.4
plt.bar(np.arange(len(categories)), values1, width=bar_width, label='Group 1')
plt.bar(np.arange(len(categories)), values2, width=bar_width, bottom=values1, label='Group 2')
plt.xlabel('Categories')
plt.ylabel('Values')
plt.xticks(np.arange(len(categories)), categories)
plt.title('Grouped and Stacked Barplot')
plt.legend()
plt.show()
Output:
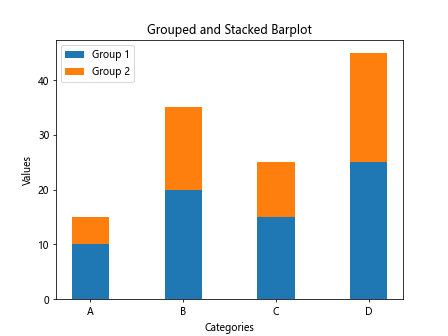
In this example, we have combined grouped and stacked barplots to visualize multiple groups within each category.
Barplot with Annotations
You can add annotations to the bars to provide additional information or insights.
import matplotlib.pyplot as plt
import numpy as np

# Data
categories = ['A', 'B', 'C', 'D']
values = [10, 20, 15, 25]

# Barplot with Annotations
plt.bar(categories, values)
for i, v in enumerate(values):
    plt.text(i, v + 0.5, f'{v}', ha='center')
    plt.annotate(f'{v}', xy=(i, v), xytext=(i, v+3),
                 arrowprops=dict(facecolor='black', shrink=0.05))
plt.xlabel('Categories')
plt.ylabel('Values')
plt.title('Barplot with Annotations')
plt.show()
Output:
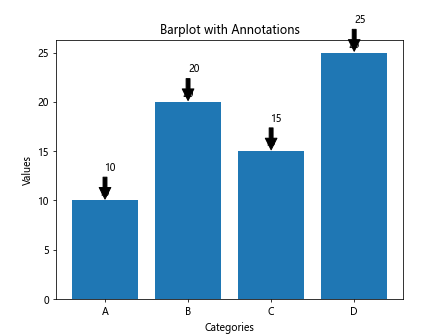
This example adds annotations to the bars in the barplot for better insights and understanding of the data.
Grouped and Overlay Barplot
You can create grouped and overlay barplots to compare multiple groups within each category.
import matplotlib.pyplot as plt
import numpy as np

# Data
categories = ['A', 'B', 'C', 'D']
values1 = [10, 20, 15, 25]
values2 = [5, 15, 10, 20]

# Grouped and Overlay Barplot
bar_width = 0.4
plt.bar(np.arange(len(categories)), values1, width=bar_width, label='Group 1')
plt.bar(np.arange(len(categories)), values2, width=bar_width, label='Group 2', alpha=0.5)
plt.xlabel('Categories')
plt.ylabel('Values')
plt.xticks(np.arange(len(categories)), categories)
plt.title('Grouped and Overlay Barplot')
plt.legend()
plt.show()
Output:
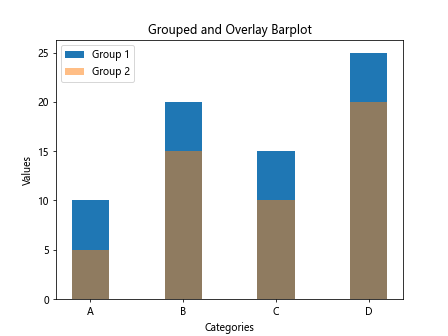
This code snippet combines grouped and overlay barplots to compare multiple groups within each category.
Barplot with Gridlines
You can add gridlines to the barplot to improve readability and alignment.
import matplotlib.pyplot as plt
import numpy as np

# Data
categories = ['A', 'B', 'C', 'D']
values = [10, 20, 15, 25]

# Barplot with Gridlines
plt.bar(categories, values)
plt.xlabel('Categories')
plt.ylabel('Values')
plt.title('Barplot with Gridlines')
plt.grid(axis='y', linestyle='--')
plt.show()
Output:
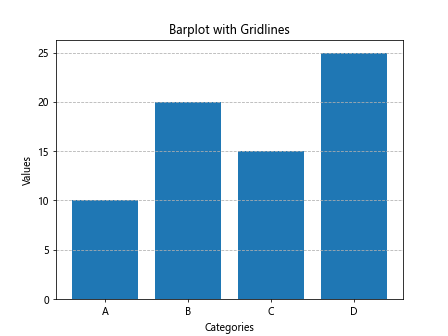
This example adds gridlines to the barplot to provide better alignment and structure to the visualization.
Grouped and Colored Barplot
You can combine grouped barplots with custom colors for a visually appealing visualization.
import matplotlib.pyplot as plt
import numpy as np

# Data
categories = ['A', 'B', 'C', 'D']
values1 = [10, 20, 15, 25]
values2 = [5, 15, 10, 20]

# Grouped and Colored Barplot
bar_width = 0.4
colors1 = ['lightblue', 'lightgreen', 'lightcoral', 'lightskyblue']
colors2 = ['blue', 'green', 'red', 'purple']
plt.bar(np.arange(len(categories)), values1, width=bar_width, color=colors1, label='Group 1')
plt.bar(np.arange(len(categories)) + bar_width, values2, width=bar_width, color=colors2, label='Group 2')
plt.xlabel('Categories')
plt.ylabel('Values')
plt.xticks(np.arange(len(categories)) + bar_width/2, categories)
plt.title('Grouped and Colored Barplot')
plt.legend()
plt.show()
Output:
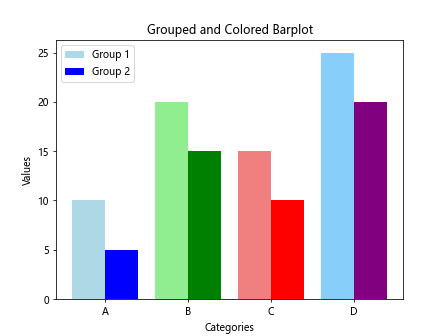
This code snippet combines grouped barplots with custom colors for a visually appealing visualization.
Stacked Barplot with Annotations
You can create stacked barplots with annotations to provide additional context to the data.
import matplotlib.pyplot as plt
import numpy as np

# Data
categories = ['A', 'B', 'C', 'D']
values1 = [10, 20, 15, 25]
values2 = [5, 15, 10, 20]

# Stacked Barplot with Annotations
plt.bar(categories, values1, label='Group 1')
plt.bar(categories, values2, bottom=values1, label='Group 2')
for i in range(len(categories)):
    plt.text(i, values1[i] + values2[i] + 1, str(values1[i] + values2[i]), ha='center')
plt.xlabel('Categories')
plt.ylabel('Values')
plt.title('Stacked Barplot with Annotations')
plt.legend()
plt.show()
Output:
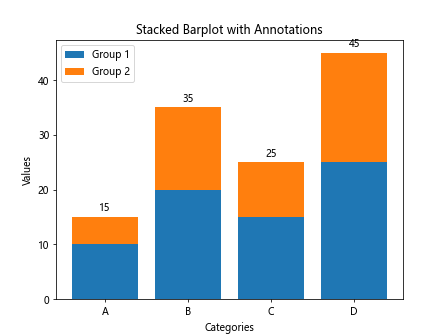
This example creates a stacked barplot with annotations to show the total value of each category.
Grouped Barplot with Patterns
You can add patterns to the bars in the grouped barplot for better differentiation.
import matplotlib.pyplot as plt
import numpy as np

# Data
categories = ['A', 'B', 'C', 'D']
values1 = [10, 20, 15, 25]
values2 = [5, 15, 10, 20]

# Grouped Barplot with Patterns
bar_width = 0.4
patterns = ['/', '//', '\\', '|']
plt.bar(np.arange(len(categories)), values1, width=bar_width, label='Group 1', hatch=patterns[0])
plt.bar(np.arange(len(categories)) + bar_width, values2, width=bar_width, label='Group 2', hatch=patterns[1])
plt.xlabel('Categories')
plt.ylabel('Values')
plt.xticks(np.arange(len(categories)) + bar_width/2, categories)
plt.title('Grouped Barplot with Patterns')
plt.legend()
plt.show()
Output:
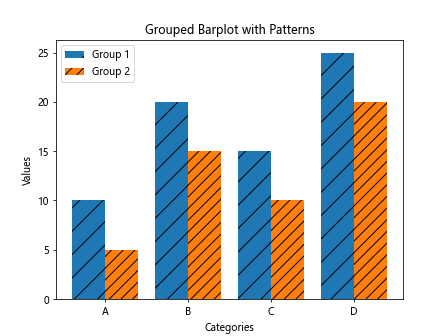
This code snippet adds patterns to the bars in the grouped barplot to enhance differentiation between groups.
Barplot with Legend
You can add a legend to the barplot to explain the different components or groups.
import matplotlib.pyplot as plt
import numpy as np

# Data
categories = ['A', 'B', 'C', 'D']
values = [10, 20, 15, 25]

# Barplot with Legend
plt.bar(categories, values, label='Values')
plt.xlabel('Categories')
plt.ylabel('Values')
plt.title('Barplot with Legend')
plt.legend()
plt.show()
Output:
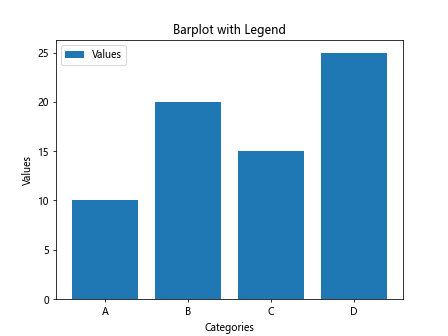
This example adds a legend to the barplot to explain the meaning of different components or groups.
These examples cover a range of barplot variations and customizations using Matplotlib in Python. Experiment with different parameters and settings to create unique and informative barplots for your data visualization needs.