Matplotlib.axis.Axis.get_agg_filter() Function in Python
Matplotlib.axis.Axis.get_agg_filter() function in Python is an essential method for working with axis objects in Matplotlib. This function is used to retrieve the aggregate filter applied to the axis. In this comprehensive guide, we’ll explore the Matplotlib.axis.Axis.get_agg_filter() function in detail, covering its usage, parameters, return values, and practical applications. We’ll also provide numerous examples to help you understand how to effectively use this function in your data visualization projects.
Understanding the Matplotlib.axis.Axis.get_agg_filter() Function
The Matplotlib.axis.Axis.get_agg_filter() function is a method of the Axis class in Matplotlib. It is used to retrieve the aggregate filter applied to the axis. An aggregate filter is a function that is used to transform the rendered image of the artist (in this case, the axis) before it is composited into the figure.
Let’s start with a simple example to demonstrate how to use the Matplotlib.axis.Axis.get_agg_filter() function:
import matplotlib.pyplot as plt

# Create a figure and axis
fig, ax = plt.subplots()

# Plot some data
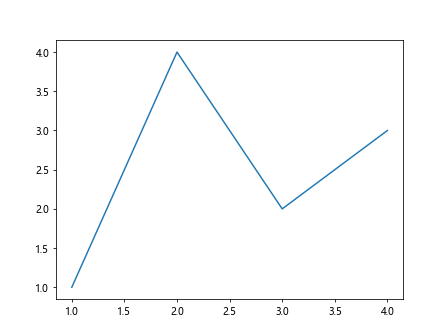
ax.plot([1, 2, 3, 4], [1, 4, 2, 3], label='Data from how2matplotlib.com')

# Get the aggregate filter of the x-axis
agg_filter = ax.xaxis.get_agg_filter()

# Print the result
print(f"Aggregate filter of x-axis: {agg_filter}")

plt.show()
Output:

In this example, we create a simple plot and then use the get_agg_filter() function to retrieve the aggregate filter of the x-axis. By default, no aggregate filter is applied, so the function will return None.
Parameters of Matplotlib.axis.Axis.get_agg_filter()
The Matplotlib.axis.Axis.get_agg_filter() function doesn’t take any parameters. It is a simple getter method that returns the current aggregate filter applied to the axis.
Return Value of Matplotlib.axis.Axis.get_agg_filter()
The Matplotlib.axis.Axis.get_agg_filter() function returns the following:
- If an aggregate filter is set: It returns a callable object (function) that takes a (nx, ny, 3) float array and a dpi value, and returns a similarly shaped array.
- If no aggregate filter is set: It returns None.
Practical Applications of Matplotlib.axis.Axis.get_agg_filter()
The Matplotlib.axis.Axis.get_agg_filter() function is particularly useful when you want to inspect or modify the current aggregate filter applied to an axis. This can be helpful in various scenarios, such as:
- Debugging: When you’re troubleshooting issues related to axis rendering, you can use get_agg_filter() to check if any unexpected filters are applied.
Dynamic filter adjustments: You can retrieve the current filter, modify it, and then reapply it based on certain conditions or user interactions.
Filter chaining: You can combine multiple filters by retrieving the current filter, composing it with a new filter, and then setting the combined filter.
Let’s look at some examples to illustrate these applications: