Comprehensive Guide to Matplotlib.axes.Axes.properties() in Python: Unlocking the Power of Axes Customization
Matplotlib.axes.Axes.properties() in Python is a powerful method that allows you to access and manipulate various properties of an Axes object in Matplotlib. This function is essential for customizing and fine-tuning your plots, providing a way to retrieve and modify a wide range of attributes that define the appearance and behavior of your visualizations. In this comprehensive guide, we’ll explore the ins and outs of Matplotlib.axes.Axes.properties(), diving deep into its functionality, use cases, and practical applications.
Understanding Matplotlib.axes.Axes.properties() in Python
Matplotlib.axes.Axes.properties() is a method that returns a dictionary containing all the properties of an Axes object. These properties include everything from axis limits and labels to grid settings and tick parameters. By using this method, you can easily access and modify these properties, giving you fine-grained control over your plots.
Let’s start with a simple example to demonstrate how to use Matplotlib.axes.Axes.properties():
import matplotlib.pyplot as plt

# Create a figure and axes
fig, ax = plt.subplots()

# Plot some data
ax.plot([1, 2, 3, 4], [1, 4, 2, 3], label='Data from how2matplotlib.com')

# Get the properties of the axes
props = ax.properties()

# Print some of the properties
print("X-axis label:", props['xlabel'])
print("Y-axis label:", props['ylabel'])
print("Title:", props['title'])

plt.show()
Output:
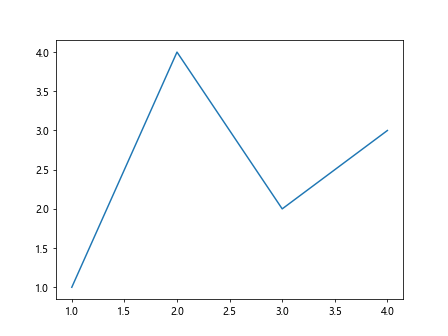
In this example, we create a simple plot and then use the properties() method to retrieve a dictionary of all the axes properties. We then print out a few of these properties to demonstrate how to access them.
Exploring Key Properties in Matplotlib.axes.Axes.properties()
Now that we have a basic understanding of how to use Matplotlib.axes.Axes.properties(), let’s dive deeper into some of the key properties you can access and modify:
1. Axis Limits
One of the most commonly adjusted properties is the axis limits. You can use Matplotlib.axes.Axes.properties() to retrieve and set these limits:
import matplotlib.pyplot as plt

fig, ax = plt.subplots()

# Plot some data
ax.plot([1, 2, 3, 4], [1, 4, 2, 3], label='Data from how2matplotlib.com')

# Get current axis limits
props = ax.properties()
print("Current x-limits:", props['xlim'])
print("Current y-limits:", props['ylim'])

# Set new axis limits
ax.set_xlim(0, 5)
ax.set_ylim(0, 5)

# Get updated properties
updated_props = ax.properties()
print("Updated x-limits:", updated_props['xlim'])
print("Updated y-limits:", updated_props['ylim'])

plt.show()
Output:
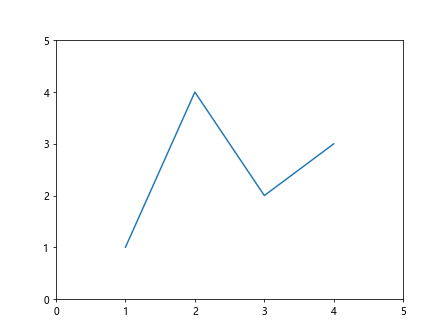
This example demonstrates how to retrieve the current axis limits using Matplotlib.axes.Axes.properties() and then update them using the set_xlim() and set_ylim() methods.
2. Axis Labels and Title
Customizing axis labels and titles is crucial for creating informative plots. Here’s how you can use Matplotlib.axes.Axes.properties() to work with these properties:
import matplotlib.pyplot as plt

fig, ax = plt.subplots()

# Plot some data
ax.plot([1, 2, 3, 4], [1, 4, 2, 3], label='Data from how2matplotlib.com')

# Set labels and title
ax.set_xlabel('X-axis')
ax.set_ylabel('Y-axis')
ax.set_title('My Plot')

# Get properties
props = ax.properties()
print("X-axis label:", props['xlabel'])
print("Y-axis label:", props['ylabel'])
print("Title:", props['title'])

# Update labels and title
ax.set_xlabel('New X-axis')
ax.set_ylabel('New Y-axis')
ax.set_title('Updated Plot')

# Get updated properties
updated_props = ax.properties()
print("Updated X-axis label:", updated_props['xlabel'])
print("Updated Y-axis label:", updated_props['ylabel'])
print("Updated Title:", updated_props['title'])

plt.show()
Output:
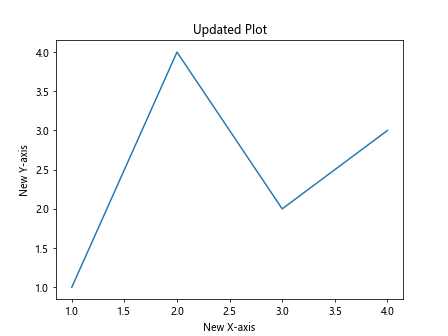
This example shows how to set and retrieve axis labels and titles using Matplotlib.axes.Axes.properties().
3. Grid Settings
Grids can help improve the readability of your plots. Let’s see how to work with grid properties:
import matplotlib.pyplot as plt

fig, ax = plt.subplots()

# Plot some data
ax.plot([1, 2, 3, 4], [1, 4, 2, 3], label='Data from how2matplotlib.com')

# Get initial grid properties
props = ax.properties()
print("Initial grid visible:", props['axes.grid'])

# Turn on the grid
ax.grid(True)

# Get updated grid properties
updated_props = ax.properties()
print("Updated grid visible:", updated_props['axes.grid'])

# Customize grid
ax.grid(color='r', linestyle='--', linewidth=0.5)

plt.show()
This example demonstrates how to check the visibility of the grid, turn it on, and customize its appearance using Matplotlib.axes.Axes.properties().
4. Tick Parameters
Customizing tick parameters can greatly enhance the appearance of your plots. Here’s how to work with tick properties:
import matplotlib.pyplot as plt

fig, ax = plt.subplots()

# Plot some data
ax.plot([1, 2, 3, 4], [1, 4, 2, 3], label='Data from how2matplotlib.com')

# Get initial tick properties
props = ax.properties()
print("Initial x-axis tick labels:", props['xticklabels'])
print("Initial y-axis tick labels:", props['yticklabels'])

# Customize tick parameters
ax.tick_params(axis='x', rotation=45, colors='red')
ax.tick_params(axis='y', rotation=0, colors='blue')

# Get updated tick properties
updated_props = ax.properties()
print("Updated x-axis tick labels:", updated_props['xticklabels'])
print("Updated y-axis tick labels:", updated_props['yticklabels'])

plt.show()
Output:
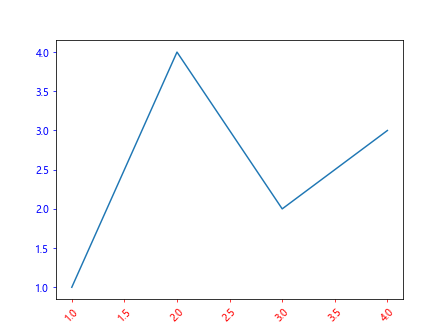
This example shows how to retrieve and customize tick parameters using Matplotlib.axes.Axes.properties().
Advanced Usage of Matplotlib.axes.Axes.properties() in Python
Now that we’ve covered the basics, let’s explore some more advanced applications of Matplotlib.axes.Axes.properties():
1. Working with Multiple Axes
When working with subplots or multiple axes, Matplotlib.axes.Axes.properties() can be particularly useful for maintaining consistency across different plots:
import matplotlib.pyplot as plt

fig, (ax1, ax2) = plt.subplots(1, 2, figsize=(10, 5))

# Plot data on both axes
ax1.plot([1, 2, 3, 4], [1, 4, 2, 3], label='Data 1 from how2matplotlib.com')
ax2.plot([1, 2, 3, 4], [3, 1, 4, 2], label='Data 2 from how2matplotlib.com')

# Get properties of the first axes
props1 = ax1.properties()

# Apply some of these properties to the second axes
ax2.set_xlim(props1['xlim'])
ax2.set_ylim(props1['ylim'])
ax2.set_xlabel(props1['xlabel'])
ax2.set_ylabel(props1['ylabel'])

# Verify that the properties are now the same
props2 = ax2.properties()
print("X-limits match:", props1['xlim'] == props2['xlim'])
print("Y-limits match:", props1['ylim'] == props2['ylim'])

plt.show()
Output:
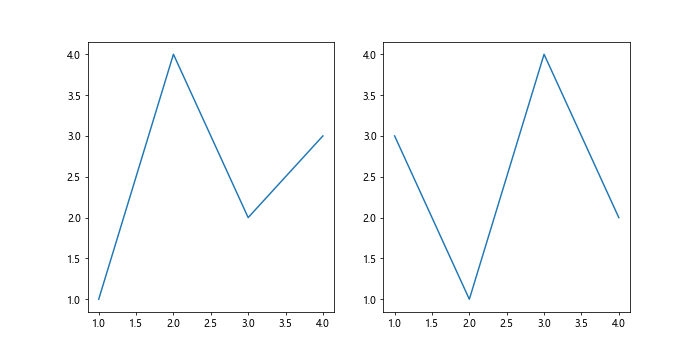
This example demonstrates how to use Matplotlib.axes.Axes.properties() to ensure consistency between multiple axes in a figure.
2. Dynamically Adjusting Plot Properties
Matplotlib.axes.Axes.properties() can be used to dynamically adjust plot properties based on data or user input:
import matplotlib.pyplot as plt
import numpy as np

fig, ax = plt.subplots()

# Generate some random data
data = np.random.randn(1000)

# Plot a histogram
ax.hist(data, bins=30, label='Data from how2matplotlib.com')

# Get current properties
props = ax.properties()

# Dynamically adjust x-limits based on data
data_range = data.max() - data.min()
ax.set_xlim(data.min() - 0.1 * data_range, data.max() + 0.1 * data_range)

# Update title with data statistics
ax.set_title(f"Histogram (Mean: {data.mean():.2f}, Std: {data.std():.2f})")

# Get updated properties
updated_props = ax.properties()
print("Original x-limits:", props['xlim'])
print("Updated x-limits:", updated_props['xlim'])
print("Updated title:", updated_props['title'])

plt.show()
Output:
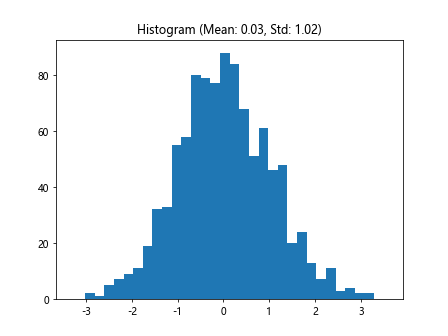
This example shows how to use Matplotlib.axes.Axes.properties() to dynamically adjust plot properties based on the data being visualized.
3. Saving and Restoring Plot States
Matplotlib.axes.Axes.properties() can be used to save and restore the state of a plot, which can be useful for creating complex visualizations or interactive applications:
import matplotlib.pyplot as plt

fig, ax = plt.subplots()

# Initial plot
ax.plot([1, 2, 3, 4], [1, 4, 2, 3], label='Initial data from how2matplotlib.com')

# Save initial state
initial_state = ax.properties()

# Modify the plot
ax.set_xlim(0, 5)
ax.set_ylim(0, 5)
ax.set_title("Modified Plot")
ax.grid(True)

# Plot additional data
ax.plot([1, 2, 3, 4], [2, 1, 4, 3], label='Additional data from how2matplotlib.com')

# Save modified state
modified_state = ax.properties()

# Restore initial state
ax.set_xlim(initial_state['xlim'])
ax.set_ylim(initial_state['ylim'])
ax.set_title(initial_state['title'])
ax.grid(initial_state['axes.grid'])

# Verify restoration
restored_state = ax.properties()
print("Restored x-limits:", restored_state['xlim'])
print("Restored y-limits:", restored_state['ylim'])
print("Restored title:", restored_state['title'])
print("Restored grid:", restored_state['axes.grid'])

plt.show()
This example demonstrates how to use Matplotlib.axes.Axes.properties() to save and restore different states of a plot.
Common Pitfalls and Best Practices with Matplotlib.axes.Axes.properties()
While Matplotlib.axes.Axes.properties() is a powerful tool, there are some common pitfalls to avoid and best practices to follow:
1. Read-Only Properties
Some properties returned by Matplotlib.axes.Axes.properties() are read-only and cannot be directly modified. Always check the Matplotlib documentation or use the appropriate setter methods to modify these properties.
import matplotlib.pyplot as plt

fig, ax = plt.subplots()

# Plot some data
ax.plot([1, 2, 3, 4], [1, 4, 2, 3], label='Data from how2matplotlib.com')

# Get properties
props = ax.properties()

# Attempt to modify a read-only property (this will raise an error)
try:
    props['xlim'] = (0, 5)
except AttributeError as e:
    print("Error:", e)

# Correct way to modify xlim
ax.set_xlim(0, 5)

# Verify the change
updated_props = ax.properties()
print("Updated x-limits:", updated_props['xlim'])

plt.show()
Output:
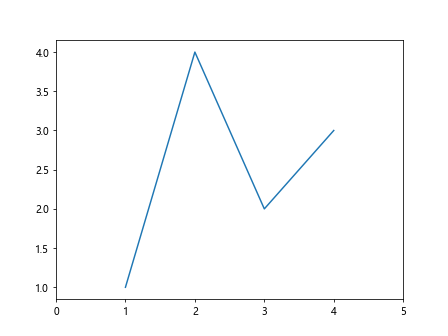
This example illustrates the correct way to modify properties that are read-only in the dictionary returned by Matplotlib.axes.Axes.properties().
2. Performance Considerations
While Matplotlib.axes.Axes.properties() is useful for accessing multiple properties at once, it can be slower than accessing individual properties directly. For performance-critical applications, consider using direct property access methods.
import matplotlib.pyplot as plt
import time

fig, ax = plt.subplots()

# Using properties() method
start_time = time.time()
for _ in range(1000):
    props = ax.properties()
    xlim = props['xlim']
end_time = time.time()
print("Time taken using properties():", end_time - start_time)

# Using direct property access
start_time = time.time()
for _ in range(1000):
    xlim = ax.get_xlim()
end_time = time.time()
print("Time taken using direct access:", end_time - start_time)

plt.show()
Output:
This example compares the performance of using Matplotlib.axes.Axes.properties() versus direct property access.
3. Handling Complex Objects
Some properties returned by Matplotlib.axes.Axes.properties() may be complex objects that require special handling. Always check the type and structure of the properties you’re working with.
import matplotlib.pyplot as plt

fig, ax = plt.subplots()

# Plot some data
ax.plot([1, 2, 3, 4], [1, 4, 2, 3], label='Data from how2matplotlib.com')

# Get properties
props = ax.properties()

# Examine a complex property
print("Type of 'axes' property:", type(props['axes']))
print("Attributes of 'axes' property:", dir(props['axes']))

# Accessing nested properties
print("X-axis label:", props['axes'].xaxis.label.get_text())
print("Y-axis label:", props['axes'].yaxis.label.get_text())

plt.show()
This example shows how to handle complex properties returned by Matplotlib.axes.Axes.properties().
Advanced Customization with Matplotlib.axes.Axes.properties()
Let’s explore some advanced customization techniques using Matplotlib.axes.Axes.properties():
1. Customizing Spines
Spines are the lines that connect the axis tick marks. You can use Matplotlib.axes.Axes.properties() to customize their appearance:
import matplotlib.pyplot as plt

fig, ax = plt.subplots()

# Plot some data
ax.plot([1, 2, 3, 4], [1, 4, 2, 3], label='Data from how2matplotlib.com')

# Get initial spine properties
props = ax.properties()
print("Initial top spine visibility:", props['spines']['top'].get_visible())

# Customize spines
ax.spines['top'].set_visible(False)
ax.spines['right'].set_visible(False)
ax.spines['bottom'].set_color('red')
ax.spines['left'].set_linewidth(2)

# Get updated spine properties
updated_props = ax.properties()
print("Updated top spine visibility:", updated_props['spines']['top'].get_visible())
print("Updated bottom spine color:", updated_props['spines']['bottom'].get_color())

plt.show()
This example demonstrates how to use Matplotlib.axes.Axes.properties() to customize the appearance of axis spines.
2. Adjusting Legend Properties
Legends are crucial for identifying different data series in a plot. Here’s how to customize legend properties:
import matplotlib.pyplot as plt

fig, ax = plt.subplots()

# Plot multiple data series
ax.plot([1, 2, 3, 4], [1, 4, 2, 3], label='Series 1 from how2matplotlib.com')
ax.plot([1, 2, 3, 4], [3, 1, 4, 2], label='Series 2 from how2matplotlib.com')

# Add a legend
ax.legend()

# Get initial legend properties
props = ax.properties()
print("Initial legend location:", props['legend']._loc)

# Customize legend
ax.legend(loc='upper left', frameon=False, fontsize='small')

# Get updated legend properties
updated_props = ax.properties()
print("Updated legend location:", updated_props['legend']._loc)
print("Updated legend frame visibility:", updated_props['legend'].get_frame_on())

plt.show()
Output:
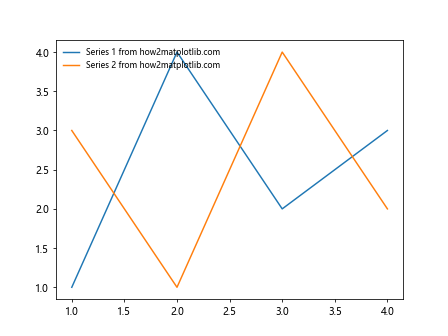
This example shows how to use Matplotlib.axes.Axes.properties() to customize the legend appearance and location.
3. Fine-tuning Tick Marks
Tick marks play a crucial role in the readability of your plots. Here’s how to customize them using Matplotlib.axes.Axes.properties():
import matplotlib.pyplot as plt

fig, ax = plt.subplots()

# Plot some data
ax.plot([1, 2, 3, 4], [1, 4, 2, 3], label='Data from how2matplotlib.com')

# Get initial tick properties
props = ax.properties()
print("Initial x-axis major tick locator:", props['xaxis'].get_major_locator())

# Customize tick marks
ax.xaxis.set_major_locator(plt.MultipleLocator(0.5))
ax.yaxis.set_minor_locator(plt.MultipleLocator(0.1))
ax.tick_params(which='major', length=10, width=2, color='red')
ax.tick_params(which='minor', length=5, width=1, color='blue')

# Get updated tick properties
updated_props = ax.properties()
print("Updated x-axis major tick locator:", updated_props['xaxis'].get_major_locator())

plt.show()
Output:
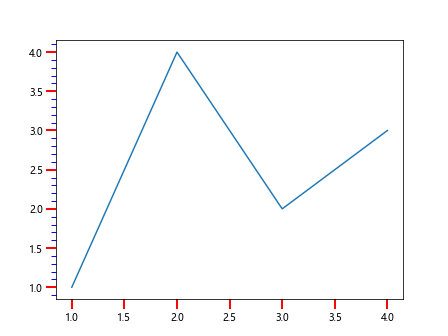
This example demonstrates how to use Matplotlib.axes.Axes.properties() to fine-tune tick marks on both axes.
Integrating Matplotlib.axes.Axes.properties() with Other Matplotlib Features
Matplotlib.axes.Axes.properties() can be effectively integrated with other Matplotlib features to create more complex and informative visualizations:
1. Combining with Text Annotations
You can use Matplotlib.axes.Axes.properties() in conjunction with text annotations to create more informative plots:
import matplotlib.pyplot as plt
import numpy as np

fig, ax = plt.subplots()

# Generate some data
x = np.linspace(0, 10, 100)
y = np.sin(x)

# Plot the data
ax.plot(x, y, label='sin(x) from how2matplotlib.com')

# Add text annotation
ax.annotate('Maximum', xy=(np.pi/2, 1), xytext=(np.pi/2, 1.2),
            arrowprops=dict(facecolor='black', shrink=0.05))

# Get axis properties
props = ax.properties()

# Add a text box with some axis information
textstr = f"X-limits: {props['xlim']}\nY-limits: {props['ylim']}"
ax.text(0.05, 0.95, textstr, transform=ax.transAxes, fontsize=10,
        verticalalignment='top', bbox=dict(boxstyle='round', facecolor='wheat', alpha=0.5))

plt.show()
Output:
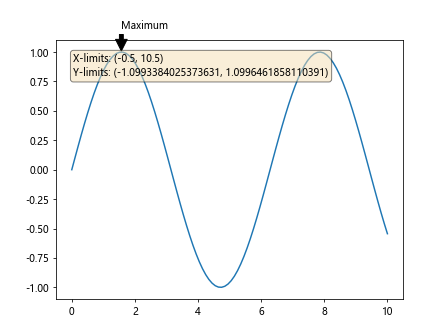
This example shows how to combine Matplotlib.axes.Axes.properties() with text annotations to provide additional information about the plot.
2. Working with Colorbars
When working with color-mapped plots, Matplotlib.axes.Axes.properties() can be useful for customizing colorbars:
import matplotlib.pyplot as plt
import numpy as np

fig, ax = plt.subplots()

# Generate some data
x, y = np.meshgrid(np.linspace(-2, 2, 100), np.linspace(-2, 2, 100))
z = np.sin(x) * np.cos(y)

# Create a color-mapped plot
im = ax.imshow(z, cmap='viridis', extent=[-2, 2, -2, 2])

# Add a colorbar
cbar = fig.colorbar(im)

# Get colorbar properties
cbar_props = cbar.ax.properties()

# Customize colorbar
cbar.set_label('Value from how2matplotlib.com')
cbar.ax.tick_params(labelsize=8)

# Get updated colorbar properties
updated_cbar_props = cbar.ax.properties()

print("Initial colorbar label:", cbar_props['ylabel'])
print("Updated colorbar label:", updated_cbar_props['ylabel'])

plt.show()
Output:
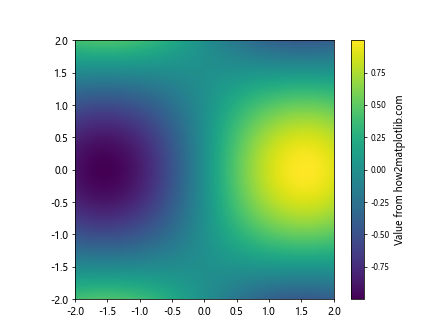
This example demonstrates how to use Matplotlib.axes.Axes.properties() to work with and customize colorbars in color-mapped plots.
3. Enhancing 3D Plots
Matplotlib.axes.Axes.properties() can also be used with 3D plots to access and modify their unique properties:
import matplotlib.pyplot as plt
from mpl_toolkits.mplot3d import Axes3D
import numpy as np

fig = plt.figure()
ax = fig.add_subplot(111, projection='3d')

# Generate some 3D data
x = np.linspace(-5, 5, 100)
y = np.linspace(-5, 5, 100)
X, Y = np.meshgrid(x, y)
Z = np.sin(np.sqrt(X**2 + Y**2))

# Create a surface plot
surf = ax.plot_surface(X, Y, Z, cmap='viridis')

# Get 3D axes properties
props = ax.properties()

# Customize 3D plot
ax.set_xlabel('X-axis from how2matplotlib.com')
ax.set_ylabel('Y-axis from how2matplotlib.com')
ax.set_zlabel('Z-axis from how2matplotlib.com')

# Get updated properties
updated_props = ax.properties()

print("Initial z-axis label:", props['zlabel'])
print("Updated z-axis label:", updated_props['zlabel'])

plt.show()
Output:
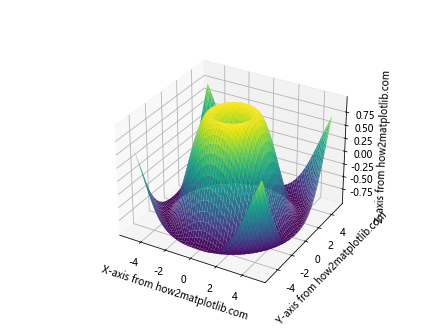
This example shows how to use Matplotlib.axes.Axes.properties() with 3D plots to access and modify their specific properties.
Best Practices for Using Matplotlib.axes.Axes.properties() in Python
To make the most of Matplotlib.axes.Axes.properties(), consider the following best practices:
- Documentation: Always refer to the official Matplotlib documentation for the most up-to-date information on available properties and their usage.
Consistency: When working with multiple plots or subplots, use Matplotlib.axes.Axes.properties() to ensure consistency across different axes.
Performance: For performance-critical applications, consider using direct property access methods instead of Matplotlib.axes.Axes.properties() when accessing only a few specific properties.
Error Handling: Implement proper error handling when working with properties, especially when dealing with read-only properties or complex objects.
Version Compatibility: Be aware that the properties available through Matplotlib.axes.Axes.properties() may vary between different versions of Matplotlib. Always test your code with the specific version you’re using.
Conclusion
Matplotlib.axes.Axes.properties() in Python is a powerful tool for accessing and manipulating the properties of Matplotlib Axes objects. By providing a comprehensive dictionary of all available properties, it enables fine-grained control over plot customization and allows for dynamic adjustments based on data or user input. Throughout this guide, we’ve explored various aspects of Matplotlib.axes.Axes.properties(), from basic usage to advanced applications. We’ve seen how it can be used to work with axis limits, labels, titles, grid settings, tick parameters, and more. We’ve also discussed its integration with other Matplotlib features and best practices for its effective use.