Comprehensive Guide to Using Matplotlib.axes.Axes.get_lines() in Python for Data Visualization
Matplotlib.axes.Axes.get_lines() in Python is a powerful method that allows you to retrieve the lines contained within an Axes object. This function is an essential tool for manipulating and analyzing plots created with Matplotlib. In this comprehensive guide, we’ll explore the various aspects of Matplotlib.axes.Axes.get_lines(), including its syntax, usage, and practical applications in data visualization.
Understanding Matplotlib.axes.Axes.get_lines()
Matplotlib.axes.Axes.get_lines() is a method that returns a list of Line2D objects representing the lines in the Axes. This function is particularly useful when you need to access or modify the properties of existing lines in a plot. Let’s dive deeper into how this method works and how you can leverage it in your Python data visualization projects.
Basic Syntax of Matplotlib.axes.Axes.get_lines()
The basic syntax for using Matplotlib.axes.Axes.get_lines() is straightforward:
import matplotlib.pyplot as plt

fig, ax = plt.subplots()
# Create some lines on the plot
ax.plot([1, 2, 3], [1, 2, 3], label='Line 1')
ax.plot([1, 2, 3], [3, 2, 1], label='Line 2')

# Get the lines
lines = ax.get_lines()

plt.title('How to use Matplotlib.axes.Axes.get_lines() - how2matplotlib.com')
plt.show()
Output:
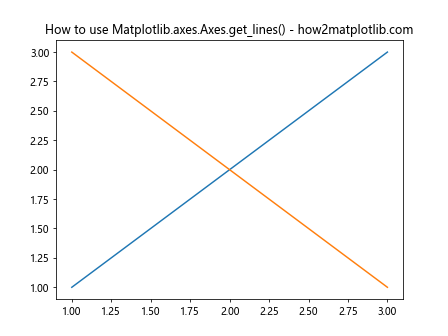
In this example, we create two lines on the plot and then use get_lines() to retrieve them. The lines variable will contain a list of Line2D objects representing these lines.
Accessing Line Properties with Matplotlib.axes.Axes.get_lines()
One of the primary uses of Matplotlib.axes.Axes.get_lines() is to access and modify the properties of existing lines in a plot. Let’s explore how we can do this:
import matplotlib.pyplot as plt

fig, ax = plt.subplots()
ax.plot([1, 2, 3], [1, 2, 3], label='Line 1')
ax.plot([1, 2, 3], [3, 2, 1], label='Line 2')

lines = ax.get_lines()

# Modify the color of the first line
lines[0].set_color('red')

# Modify the line style of the second line
lines[1].set_linestyle('--')

plt.title('Modifying Line Properties - how2matplotlib.com')
plt.legend()
plt.show()
Output:
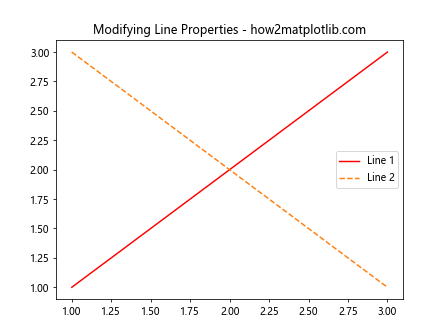
In this example, we use get_lines() to access the lines and then modify their properties. We change the color of the first line to red and the line style of the second line to dashed.
Iterating Through Lines with Matplotlib.axes.Axes.get_lines()
Matplotlib.axes.Axes.get_lines() is particularly useful when you need to perform operations on all lines in a plot. Here’s an example of how to iterate through the lines:
import matplotlib.pyplot as plt

fig, ax = plt.subplots()
ax.plot([1, 2, 3], [1, 2, 3], label='Line 1')
ax.plot([1, 2, 3], [3, 2, 1], label='Line 2')
ax.plot([1, 2, 3], [2, 3, 1], label='Line 3')

lines = ax.get_lines()

for i, line in enumerate(lines):
    line.set_linewidth(i + 1)  # Set increasing line widths

plt.title('Iterating Through Lines - how2matplotlib.com')
plt.legend()
plt.show()
Output:
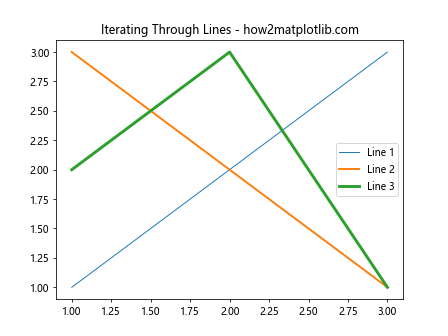
In this example, we iterate through all lines returned by get_lines() and set their line widths to increasing values.
Using Matplotlib.axes.Axes.get_lines() with Multiple Subplots
Matplotlib.axes.Axes.get_lines() can be used effectively with multiple subplots. Here’s an example:
import matplotlib.pyplot as plt

fig, (ax1, ax2) = plt.subplots(1, 2, figsize=(10, 5))

ax1.plot([1, 2, 3], [1, 2, 3], label='Line 1')
ax1.plot([1, 2, 3], [3, 2, 1], label='Line 2')

ax2.plot([1, 2, 3], [2, 3, 1], label='Line 3')
ax2.plot([1, 2, 3], [1, 3, 2], label='Line 4')

lines1 = ax1.get_lines()
lines2 = ax2.get_lines()

for line in lines1:
    line.set_marker('o')

for line in lines2:
    line.set_linestyle(':')

plt.suptitle('Using get_lines() with Multiple Subplots - how2matplotlib.com')
ax1.legend()
ax2.legend()
plt.show()
Output:
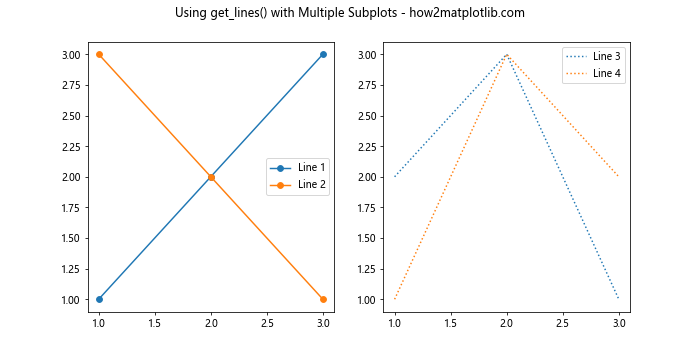
In this example, we create two subplots and use get_lines() to access the lines in each subplot separately. We then modify the lines in each subplot differently.
Combining Matplotlib.axes.Axes.get_lines() with Other Matplotlib Functions
Matplotlib.axes.Axes.get_lines() can be combined with other Matplotlib functions to create more complex visualizations. Here’s an example that combines get_lines() with the legend() function:
import matplotlib.pyplot as plt

fig, ax = plt.subplots()
ax.plot([1, 2, 3], [1, 2, 3], label='Line 1')
ax.plot([1, 2, 3], [3, 2, 1], label='Line 2')
ax.plot([1, 2, 3], [2, 3, 1], label='Line 3')

lines = ax.get_lines()

# Create a custom legend
legend_elements = [plt.Line2D([0], [0], color=line.get_color(), label=line.get_label()) for line in lines]
ax.legend(handles=legend_elements)

plt.title('Custom Legend with get_lines() - how2matplotlib.com')
plt.show()
Output:
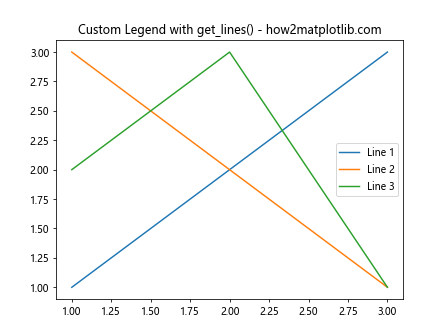
In this example, we use get_lines() to create a custom legend based on the properties of the existing lines.
Advanced Usage of Matplotlib.axes.Axes.get_lines()
Matplotlib.axes.Axes.get_lines() can be used in more advanced scenarios, such as dynamically updating plots or creating interactive visualizations. Let’s explore some of these advanced uses:
Dynamically Updating Plots with Matplotlib.axes.Axes.get_lines()
import matplotlib.pyplot as plt
import numpy as np

fig, ax = plt.subplots()
line, = ax.plot([], [])

def update_line(num):
    x = np.linspace(0, 10, 100)
    y = np.sin(x + num/10)
    line.set_data(x, y)
    return line,

for i in range(50):
    update_line(i)
    plt.pause(0.1)

plt.title('Dynamically Updating Plot - how2matplotlib.com')
plt.show()
Output:
In this example, we use get_lines() implicitly (through the line, = ax.plot([], []) syntax) to create an empty line that we update dynamically.
Creating Interactive Visualizations with Matplotlib.axes.Axes.get_lines()
import matplotlib.pyplot as plt
import numpy as np

fig, ax = plt.subplots()
x = np.linspace(0, 10, 100)
line, = ax.plot(x, np.sin(x))

def on_click(event):
    if event.inaxes == ax:
        lines = ax.get_lines()
        for line in lines:
            if line.get_color() == 'b':
                line.set_color('r')
            else:
                line.set_color('b')
        fig.canvas.draw()

fig.canvas.mpl_connect('button_press_event', on_click)
plt.title('Interactive Plot - Click to Change Color - how2matplotlib.com')
plt.show()
Output:
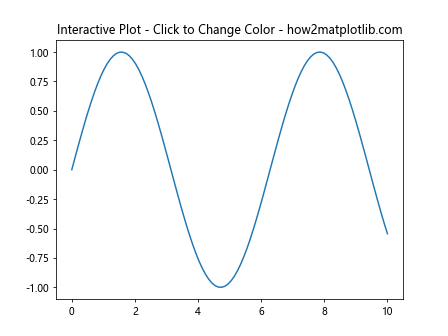
In this interactive example, we use get_lines() to access the line in the plot and change its color when the user clicks on the plot.
Common Pitfalls and Best Practices with Matplotlib.axes.Axes.get_lines()
When working with Matplotlib.axes.Axes.get_lines(), there are some common pitfalls to avoid and best practices to follow:
- Empty List: Remember that get_lines() will return an empty list if there are no lines in the Axes. Always check if the list is empty before accessing its elements.
Modifying Line Objects: Changes made to Line2D objects returned by get_lines() will affect the plot immediately. Be cautious when modifying these objects.
Performance: For plots with a large number of lines, iterating through all lines with get_lines() might impact performance. Consider using more efficient methods for bulk operations.
Here’s an example demonstrating these points: