How to Use Matplotlib.axes.Axes.get_figure() in Python
Matplotlib.axes.Axes.get_figure() in Python is an essential method for working with Matplotlib, one of the most popular data visualization libraries in Python. This method allows you to retrieve the Figure object associated with a given Axes object, providing a crucial link between different components of a Matplotlib plot. In this comprehensive guide, we’ll explore the various aspects of Matplotlib.axes.Axes.get_figure() and demonstrate how to use it effectively in your data visualization projects.
Understanding Matplotlib.axes.Axes.get_figure()
Matplotlib.axes.Axes.get_figure() is a method that belongs to the Axes class in Matplotlib. Its primary purpose is to return the Figure instance to which the Axes object belongs. This method is particularly useful when you need to access or modify properties of the entire figure from within an Axes context.
Let’s start with a simple example to illustrate how Matplotlib.axes.Axes.get_figure() works:
import matplotlib.pyplot as plt

# Create a new figure and axes
fig, ax = plt.subplots()

# Plot some data
ax.plot([1, 2, 3, 4], [1, 4, 2, 3], label='Data from how2matplotlib.com')

# Get the figure object using get_figure()
figure = ax.get_figure()

# Set the figure title
figure.suptitle('Example Plot from how2matplotlib.com')

plt.show()
Output:
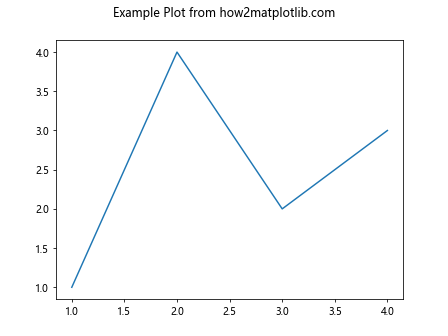
In this example, we create a figure and an axes object using plt.subplots(). We then plot some data on the axes. Using Matplotlib.axes.Axes.get_figure(), we retrieve the Figure object associated with the axes and set a title for the entire figure.
Why Use Matplotlib.axes.Axes.get_figure()?
You might wonder why Matplotlib.axes.Axes.get_figure() is necessary when you can often access the Figure object directly. There are several scenarios where this method becomes invaluable:
- When working with complex layouts or nested functions where the Figure object is not directly accessible.
- When you want to modify figure-level properties from within an Axes-specific context.
- When creating custom Matplotlib extensions or classes that need to interact with both Axes and Figure objects.
Let’s explore these scenarios in more detail with examples.
Scenario 1: Complex Layouts
When working with complex layouts, such as subplots or gridspec, Matplotlib.axes.Axes.get_figure() can be particularly useful. Here’s an example:
import matplotlib.pyplot as plt
import numpy as np

def plot_data(ax, data):
    ax.plot(data)

    # Use get_figure() to access the figure and add a colorbar
    fig = ax.get_figure()
    cbar = fig.colorbar(ax.imshow(np.random.rand(10, 10)), ax=ax)
    cbar.set_label('Random Data from how2matplotlib.com')

# Create a 2x2 grid of subplots
fig, axs = plt.subplots(2, 2, figsize=(10, 10))

# Plot data in each subplot
for ax in axs.flat:
    plot_data(ax, np.random.rand(100))

plt.tight_layout()
plt.show()
Output:
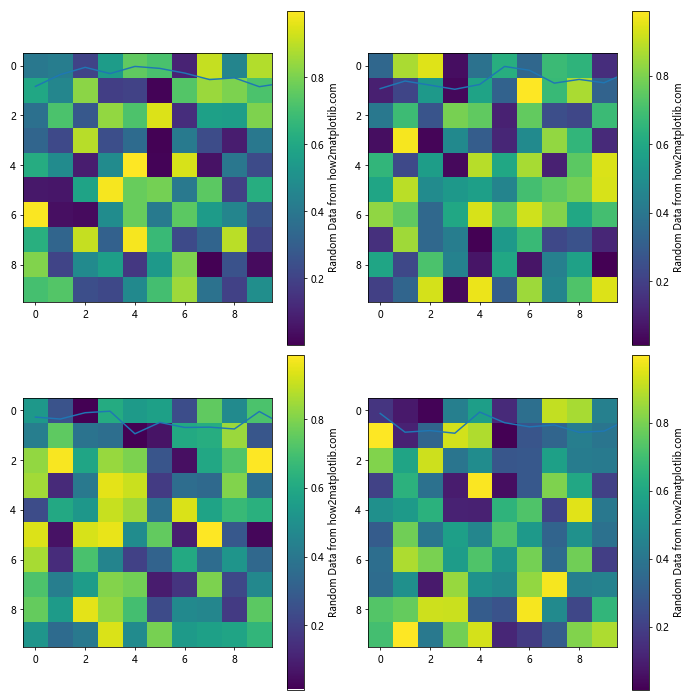
In this example, we define a function plot_data that takes an Axes object as an argument. Within this function, we use Matplotlib.axes.Axes.get_figure() to access the Figure object and add a colorbar to each subplot. This approach allows us to modularize our code and add figure-level elements from within an Axes-specific context.
Scenario 2: Modifying Figure Properties
Matplotlib.axes.Axes.get_figure() is also useful when you want to modify figure-level properties from within an Axes-specific context. Here’s an example:
import matplotlib.pyplot as plt
import numpy as np

# Create a figure and axes
fig, ax = plt.subplots()

# Plot some data
x = np.linspace(0, 10, 100)
ax.plot(x, np.sin(x), label='Sine wave from how2matplotlib.com')
ax.set_title('Sine Wave Plot')

# Use get_figure() to access and modify figure properties
fig = ax.get_figure()
fig.set_facecolor('lightgray')
fig.set_size_inches(10, 6)
fig.suptitle('Figure created with how2matplotlib.com', fontsize=16)

plt.legend()
plt.show()
Output:
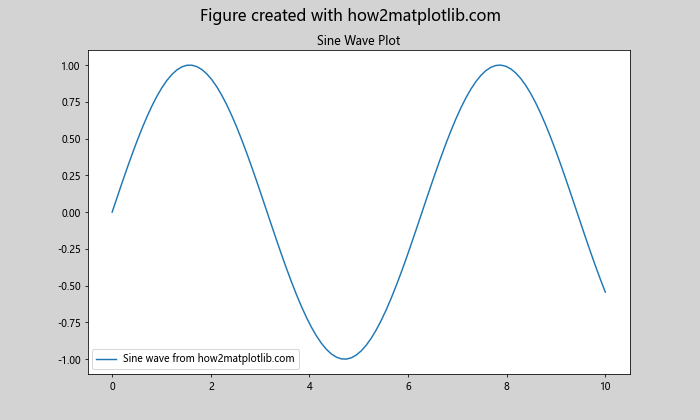
In this example, we first create a plot on the axes. Then, using Matplotlib.axes.Axes.get_figure(), we access the Figure object to modify its properties such as background color, size, and add a super title.
Scenario 3: Custom Matplotlib Extensions
When creating custom Matplotlib extensions or classes, Matplotlib.axes.Axes.get_figure() can be crucial for interacting with both Axes and Figure objects. Here’s a simple example of a custom plotting class:
import matplotlib.pyplot as plt
import numpy as np

class CustomPlotter:
    def __init__(self, ax):
        self.ax = ax
        self.fig = ax.get_figure()

    def plot_data(self, x, y):
        self.ax.plot(x, y, label='Data from how2matplotlib.com')
        self.ax.set_title('Custom Plot')
        self.fig.suptitle('Created with CustomPlotter')

    def add_colorbar(self, im):
        self.fig.colorbar(im, ax=self.ax)

# Create a figure and axes
fig, ax = plt.subplots()

# Create an instance of CustomPlotter
plotter = CustomPlotter(ax)

# Use the custom plotter
x = np.linspace(0, 10, 100)
plotter.plot_data(x, np.sin(x))

# Add a colorbar to a random image
im = ax.imshow(np.random.rand(10, 10))
plotter.add_colorbar(im)

plt.show()
Output:
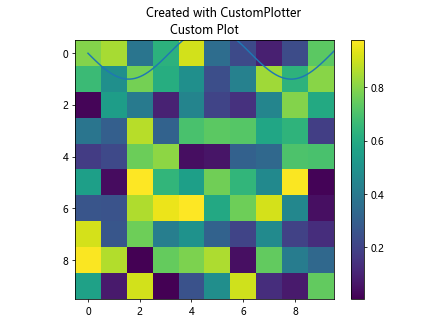
In this example, we create a CustomPlotter class that takes an Axes object as input. The class uses Matplotlib.axes.Axes.get_figure() to store both the Axes and Figure objects, allowing it to interact with both levels of the plot hierarchy.
Advanced Usage of Matplotlib.axes.Axes.get_figure()
Now that we’ve covered the basics, let’s explore some more advanced uses of Matplotlib.axes.Axes.get_figure() in Python.
Handling Multiple Figures
Matplotlib.axes.Axes.get_figure() can be particularly useful when working with multiple figures. Here’s an example:
import matplotlib.pyplot as plt
import numpy as np

def create_plot(data, title):
    fig, ax = plt.subplots()
    ax.plot(data)
    ax.set_title(title)
    return ax

# Create two separate plots
ax1 = create_plot(np.random.rand(100), 'Random Data 1 from how2matplotlib.com')
ax2 = create_plot(np.random.rand(100), 'Random Data 2 from how2matplotlib.com')

# Use get_figure() to access and modify each figure
fig1 = ax1.get_figure()
fig2 = ax2.get_figure()

fig1.suptitle('Figure 1')
fig2.suptitle('Figure 2')

# Adjust the size of both figures
for fig in [fig1, fig2]:
    fig.set_size_inches(8, 6)
    fig.tight_layout()

plt.show()
Output:
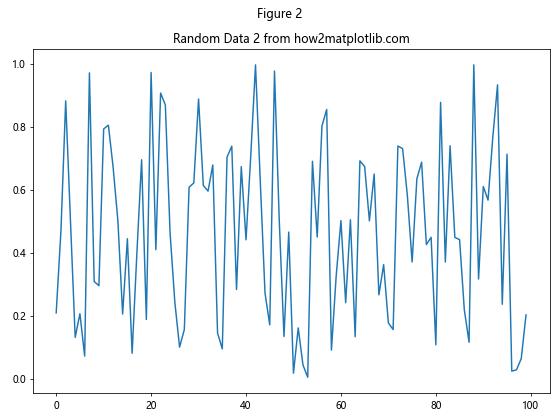
In this example, we create two separate plots using a custom function. We then use Matplotlib.axes.Axes.get_figure() to access each Figure object independently, allowing us to modify their properties separately.
Dynamic Figure Creation
Matplotlib.axes.Axes.get_figure() can be particularly useful in scenarios where figures are created dynamically. Here’s an example:
import matplotlib.pyplot as plt
import numpy as np

def create_dynamic_plot(data):
    fig, ax = plt.subplots()
    ax.plot(data)
    ax.set_title(f'Dynamic Plot from how2matplotlib.com')
    return ax

# Create a list of axes objects
axes_list = [create_dynamic_plot(np.random.rand(100)) for _ in range(5)]

# Use get_figure() to access and modify each figure
for i, ax in enumerate(axes_list):
    fig = ax.get_figure()
    fig.suptitle(f'Figure {i+1}')
    fig.set_size_inches(8, 6)
    fig.tight_layout()

plt.show()
Output:
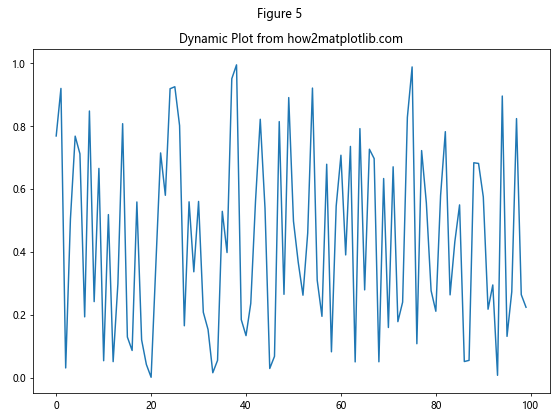
In this example, we create multiple plots dynamically using a function. We then use Matplotlib.axes.Axes.get_figure() to access each Figure object and modify its properties.
Matplotlib.axes.Axes.get_figure() and Object-Oriented Interface
Matplotlib.axes.Axes.get_figure() is particularly useful when working with Matplotlib’s object-oriented interface. This interface provides more fine-grained control over plot elements and is often preferred for complex visualizations. Let’s explore how Matplotlib.axes.Axes.get_figure() fits into this approach.
Creating Custom Plotting Functions
When creating custom plotting functions using the object-oriented interface, Matplotlib.axes.Axes.get_figure() can be very helpful. Here’s an example:
import matplotlib.pyplot as plt
import numpy as np

def custom_histogram(ax, data, bins=30):
    n, bins, patches = ax.hist(data, bins=bins, edgecolor='black')

    # Use get_figure() to access the figure and add a colorbar
    fig = ax.get_figure()
    norm = plt.Normalize(n.min(), n.max())
    sm = plt.cm.ScalarMappable(cmap='viridis', norm=norm)
    sm.set_array([])
    cbar = fig.colorbar(sm, ax=ax)
    cbar.set_label('Frequency')

    for patch, color in zip(patches, plt.cm.viridis(norm(n))):
        patch.set_facecolor(color)

    ax.set_title('Custom Histogram from how2matplotlib.com')
    ax.set_xlabel('Value')
    ax.set_ylabel('Frequency')

# Create a figure and axes
fig, ax = plt.subplots(figsize=(10, 6))

# Generate some random data
data = np.random.normal(0, 1, 1000)

# Use the custom histogram function
custom_histogram(ax, data)

plt.tight_layout()
plt.show()
Output:
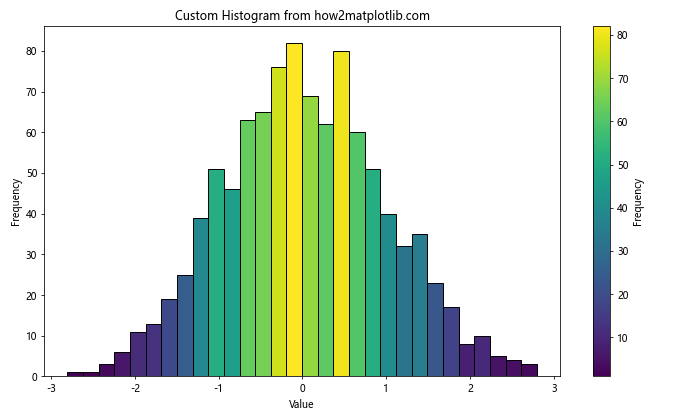
In this example, we create a custom histogram function that takes an Axes object as an argument. Within this function, we use Matplotlib.axes.Axes.get_figure() to access the Figure object and add a colorbar. This approach allows us to create reusable plotting functions that can modify both Axes and Figure properties.
Managing Multiple Subplots
When working with multiple subplots, Matplotlib.axes.Axes.get_figure() can help manage figure-level properties. Here’s an example:
import matplotlib.pyplot as plt
import numpy as np

def plot_with_colorbar(ax, data):
    im = ax.imshow(data, cmap='viridis')
    fig = ax.get_figure()
    fig.colorbar(im, ax=ax)
    ax.set_title(f'Plot from how2matplotlib.com')

# Create a 2x2 grid of subplots
fig, axs = plt.subplots(2, 2, figsize=(12, 10))

# Plot data in each subplot
for ax in axs.flat:
    data = np.random.rand(10, 10)
    plot_with_colorbar(ax, data)

# Use get_figure() to access the main figure and add a title
main_fig = axs[0, 0].get_figure()
main_fig.suptitle('Multiple Subplots with Colorbars', fontsize=16)

plt.tight_layout()
plt.show()
Output:
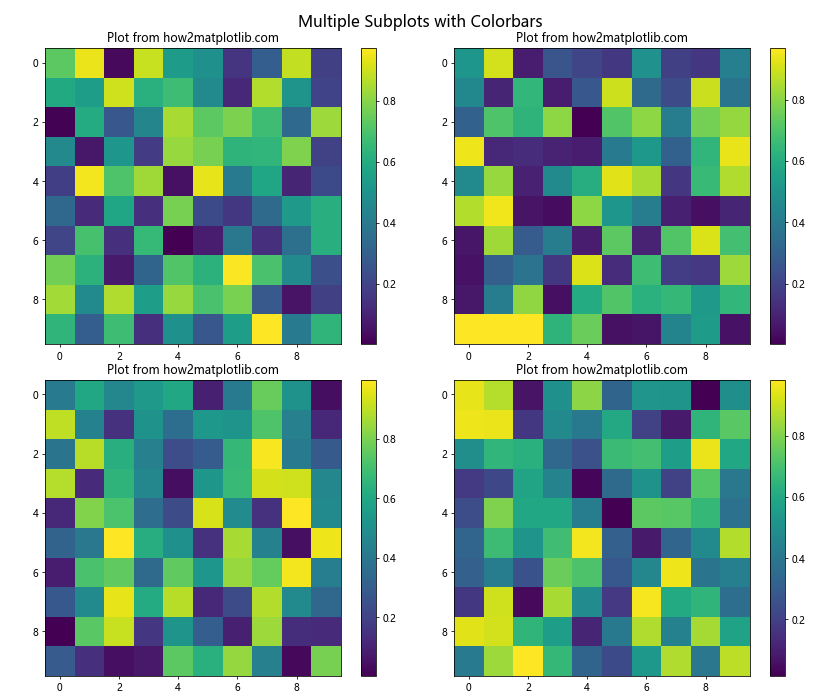
In this example, we create a function that plots data with a colorbar on a given Axes object. We then use this function to create multiple subplots. Finally, we use Matplotlib.axes.Axes.get_figure() to access the main Figure object and add an overall title.
Matplotlib.axes.Axes.get_figure() and Animation
Matplotlib.axes.Axes.get_figure() can also be useful when creating animations. Let’s look at an example:
import matplotlib.pyplot as plt
import matplotlib.animation as animation
import numpy as np

def animate(frame):
    ax.clear()
    ax.plot(np.sin(np.linspace(0, 2*np.pi, 100) + frame/10))
    ax.set_title(f'Frame {frame} from how2matplotlib.com')

    # Use get_figure() to update the figure title
    fig = ax.get_figure()
    fig.suptitle(f'Animation Time: {frame/10:.2f}s')

# Create a figure and axes
fig, ax = plt.subplots()

# Create the animation
anim = animation.FuncAnimation(fig, animate, frames=100, interval=50)

plt.show()
Output:
In this example, we create an animation of a sine wave. Within the animation function, we use Matplotlib.axes.Axes.get_figure() to access the Figure object and update its title in each frame.
Matplotlib.axes.Axes.get_figure() and Custom Matplotlib Classes
When creating custom Matplotlib classes, Matplotlib.axes.Axes.get_figure() can be very useful for managing the relationship between Axes and Figure objects. Here’s an example:
import matplotlib.pyplot as plt
import numpy as np

class CustomPlot:
    def __init__(self, ax):
        self.ax = ax
        self.fig = ax.get_figure()

    def plot_data(self, x, y):
        self.ax.plot(x, y)
        self.ax.set_title('Data from how2matplotlib.com')

    def add_text(self, text):
        self.fig.text(0.5, 0.02, text, ha='center')

    def set_figure_size(self, width, height):
        self.fig.set_size_inches(width, height)

# Create a figure and axes
fig, ax = plt.subplots()

# Create an instance of CustomPlot
custom_plot = CustomPlot(ax)

# Use the custom plot methods
x = np.linspace(0, 10, 100)
y = np.sin(x)
custom_plot.plot_data(x,y)
custom_plot.add_text('Created with CustomPlot class')
custom_plot.set_figure_size(10, 6)

plt.show()
Output:
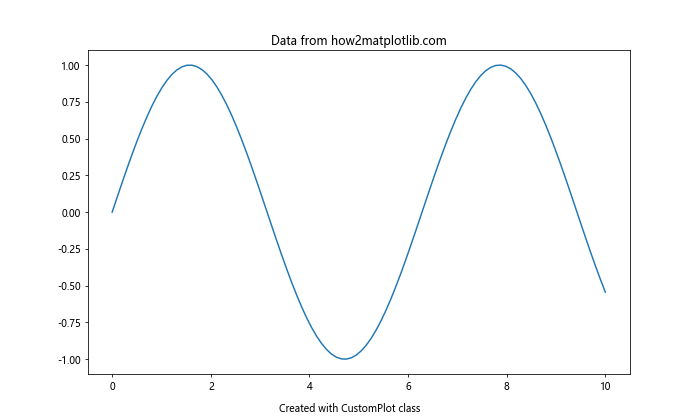
In this example, we create a CustomPlot class that encapsulates both Axes and Figure manipulation. By using Matplotlib.axes.Axes.get_figure() in the constructor, we can easily access and modify both Axes and Figure properties through the same object.
Matplotlib.axes.Axes.get_figure() and Interactive Plots
Matplotlib.axes.Axes.get_figure() can be particularly useful when creating interactive plots. Here’s an example using Matplotlib’s event handling capabilities:
import matplotlib.pyplot as plt
import numpy as np

def on_click(event):
    if event.inaxes is not None:
        ax = event.inaxes
        fig = ax.get_figure()
        fig.suptitle(f'Clicked at x={event.xdata:.2f}, y={event.ydata:.2f}')
        fig.canvas.draw()

# Create a figure and axes
fig, ax = plt.subplots()

# Plot some data
x = np.linspace(0, 10, 100)
ax.plot(x, np.sin(x), label='Sine wave from how2matplotlib.com')
ax.set_title('Interactive Plot')

# Connect the click event to the on_click function
fig.canvas.mpl_connect('button_press_event', on_click)

plt.legend()
plt.show()
Output:
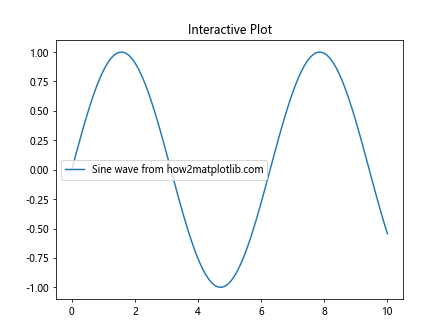
In this example, we create an interactive plot where clicking on the plot updates the figure title with the clicked coordinates. We use Matplotlib.axes.Axes.get_figure() within the event handler to access and update the Figure object.
Matplotlib.axes.Axes.get_figure() and Saving Plots
Matplotlib.axes.Axes.get_figure() can also be useful when saving plots, especially when working with multiple figures or subplots. Here’s an example:
import matplotlib.pyplot as plt
import numpy as np

def create_subplot(ax, data, title):
    ax.plot(data)
    ax.set_title(title)

# Create a figure with multiple subplots
fig, (ax1, ax2) = plt.subplots(1, 2, figsize=(12, 6))

# Create plots in each subplot
create_subplot(ax1, np.random.rand(100), 'Random Data 1 from how2matplotlib.com')
create_subplot(ax2, np.random.rand(100), 'Random Data 2 from how2matplotlib.com')

# Use get_figure() to access the figure and save it
figure = ax1.get_figure()
figure.suptitle('Multiple Subplots Example')
figure.savefig('multiple_subplots.png')

plt.show()
Output:
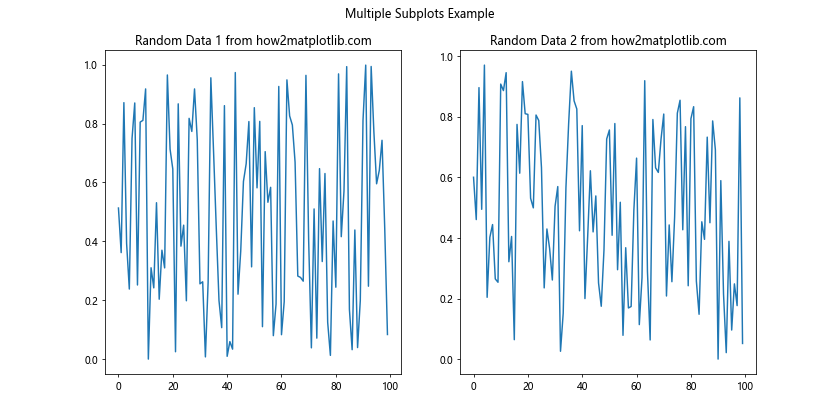
In this example, we create a figure with multiple subplots. We then use Matplotlib.axes.Axes.get_figure() to access the Figure object and save it as an image file.
Matplotlib.axes.Axes.get_figure() and Custom Colormaps
Matplotlib.axes.Axes.get_figure() can be helpful when working with custom colormaps, especially when you need to add a colorbar to your plot. Here’s an example:
import matplotlib.pyplot as plt
import numpy as np
from matplotlib.colors import LinearSegmentedColormap

# Create a custom colormap
colors = ['#ff0000', '#00ff00', '#0000ff']
n_bins = 100
cmap = LinearSegmentedColormap.from_list('custom_cmap', colors, N=n_bins)

# Create a figure and axes
fig, ax = plt.subplots(figsize=(10, 8))

# Create some data and plot it
data = np.random.rand(10, 10)
im = ax.imshow(data, cmap=cmap)

# Use get_figure() to add a colorbar
figure = ax.get_figure()
cbar = figure.colorbar(im, ax=ax)
cbar.set_label('Custom Colormap Values')

ax.set_title('Custom Colormap Example from how2matplotlib.com')
plt.show()
Output:

In this example, we create a custom colormap and use it to plot some data. We then use Matplotlib.axes.Axes.get_figure() to access the Figure object and add a colorbar to the plot.
Matplotlib.axes.Axes.get_figure() and 3D Plots
Matplotlib.axes.Axes.get_figure() can also be useful when working with 3D plots. Here’s an example:
import matplotlib.pyplot as plt
import numpy as np
from mpl_toolkits.mplot3d import Axes3D

def plot_3d_surface(ax):
    x = np.linspace(-5, 5, 100)
    y = np.linspace(-5, 5, 100)
    X, Y = np.meshgrid(x, y)
    Z = np.sin(np.sqrt(X**2 + Y**2))

    surf = ax.plot_surface(X, Y, Z, cmap='viridis')

    # Use get_figure() to add a colorbar
    fig = ax.get_figure()
    fig.colorbar(surf, ax=ax, shrink=0.5, aspect=5)

# Create a figure and 3D axes
fig = plt.figure(figsize=(10, 8))
ax = fig.add_subplot(111, projection='3d')

# Plot the 3D surface
plot_3d_surface(ax)

ax.set_title('3D Surface Plot from how2matplotlib.com')
plt.show()
Output:
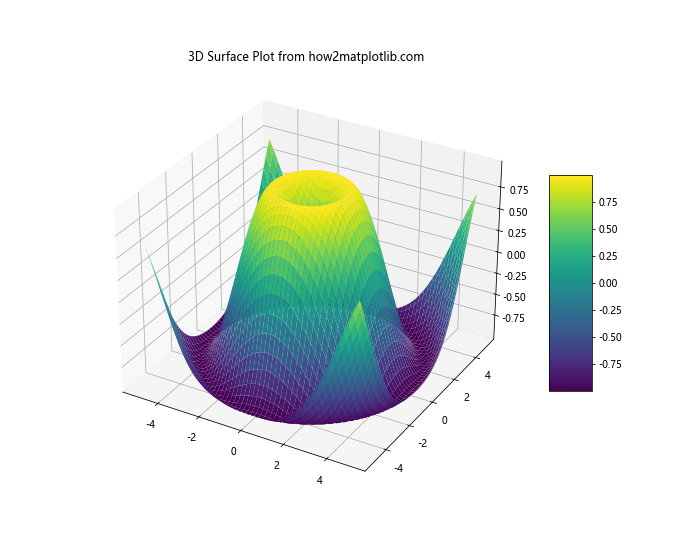
In this example, we create a 3D surface plot. We use Matplotlib.axes.Axes.get_figure() within our plotting function to access the Figure object and add a colorbar to the 3D plot.
Conclusion
Matplotlib.axes.Axes.get_figure() in Python is a versatile method that provides a crucial link between Axes and Figure objects in Matplotlib. Throughout this comprehensive guide, we’ve explored various use cases and examples that demonstrate the power and flexibility of this method.
We’ve seen how Matplotlib.axes.Axes.get_figure() can be used in scenarios ranging from simple plots to complex layouts, animations, interactive plots, and even custom Matplotlib classes. This method is particularly useful when you need to access or modify figure-level properties from within an Axes context, or when working with multiple figures or subplots.