How to Use Matplotlib.axes.Axes.get_default_bbox_extra_artists() in Python
Matplotlib.axes.Axes.get_default_bbox_extra_artists() in Python is a powerful method that plays a crucial role in handling and managing artists in Matplotlib plots. This comprehensive guide will delve deep into the intricacies of this function, exploring its various applications, use cases, and best practices. By the end of this article, you’ll have a thorough understanding of how to leverage Matplotlib.axes.Axes.get_default_bbox_extra_artists() to enhance your data visualization projects.
Understanding Matplotlib.axes.Axes.get_default_bbox_extra_artists()
Matplotlib.axes.Axes.get_default_bbox_extra_artists() is a method that returns a list of artists that should be included in the tight bounding box calculation when saving a figure. This function is particularly useful when dealing with complex plots that contain elements outside the main axes, such as legends, annotations, or text objects.
Let’s start with a simple example to illustrate the basic usage of Matplotlib.axes.Axes.get_default_bbox_extra_artists():
import matplotlib.pyplot as plt

fig, ax = plt.subplots()
ax.plot([1, 2, 3, 4], [1, 4, 2, 3], label='Data from how2matplotlib.com')
ax.set_title('Simple Plot')
ax.legend()

extra_artists = ax.get_default_bbox_extra_artists()
print(f"Number of extra artists: {len(extra_artists)}")

plt.show()
Output:
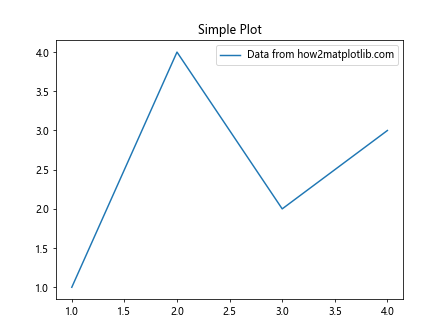
In this example, we create a simple plot and then use Matplotlib.axes.Axes.get_default_bbox_extra_artists() to retrieve the list of extra artists. The function returns a list containing the legend, which is considered an extra artist in this case.
The Importance of Matplotlib.axes.Axes.get_default_bbox_extra_artists()
Matplotlib.axes.Axes.get_default_bbox_extra_artists() plays a crucial role in ensuring that all relevant elements of a plot are included when saving or exporting figures. Without this function, certain elements might be cut off or excluded from the final output. Let’s explore a more complex example to highlight its importance:
import matplotlib.pyplot as plt
import numpy as np

fig, ax = plt.subplots(figsize=(10, 6))

x = np.linspace(0, 10, 100)
y1 = np.sin(x)
y2 = np.cos(x)

ax.plot(x, y1, label='Sin(x) - how2matplotlib.com')
ax.plot(x, y2, label='Cos(x) - how2matplotlib.com')

ax.set_title('Trigonometric Functions')
ax.set_xlabel('X-axis')
ax.set_ylabel('Y-axis')

legend = ax.legend(loc='upper right', bbox_to_anchor=(1.25, 1))
ax.annotate('Important Point', xy=(5, 0), xytext=(6, 0.5),
            arrowprops=dict(facecolor='black', shrink=0.05))

extra_artists = ax.get_default_bbox_extra_artists()
print(f"Extra artists: {extra_artists}")

plt.tight_layout()
plt.show()
Output:
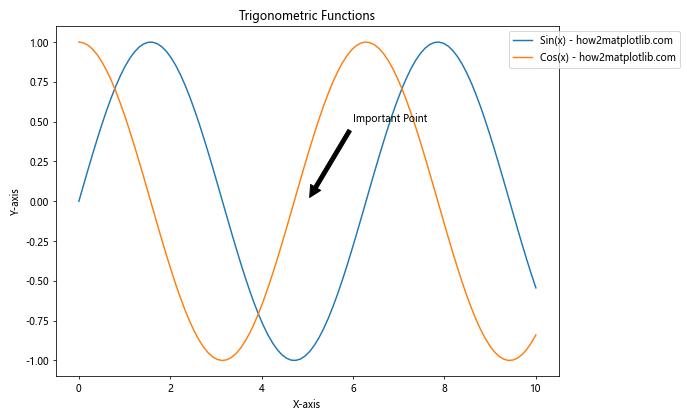
In this example, we create a more complex plot with multiple lines, a legend placed outside the main axes, and an annotation. By using Matplotlib.axes.Axes.get_default_bbox_extra_artists(), we ensure that all these elements are included when saving or displaying the figure.
Advanced Usage of Matplotlib.axes.Axes.get_default_bbox_extra_artists()
Now that we understand the basics, let’s explore some advanced applications of Matplotlib.axes.Axes.get_default_bbox_extra_artists():
1. Custom Artist Management
You can use Matplotlib.axes.Axes.get_default_bbox_extra_artists() to manage custom artists that you’ve added to your plot:
import matplotlib.pyplot as plt
import matplotlib.patches as patches

fig, ax = plt.subplots()

# Add a custom rectangle
rect = patches.Rectangle((0.2, 0.2), 0.6, 0.6, fill=False, ec='r')
ax.add_patch(rect)

ax.set_title('Plot with Custom Artist - how2matplotlib.com')

extra_artists = ax.get_default_bbox_extra_artists()
print(f"Extra artists before: {extra_artists}")

# Add the rectangle to the list of extra artists
extra_artists.append(rect)

print(f"Extra artists after: {extra_artists}")

plt.show()
Output:
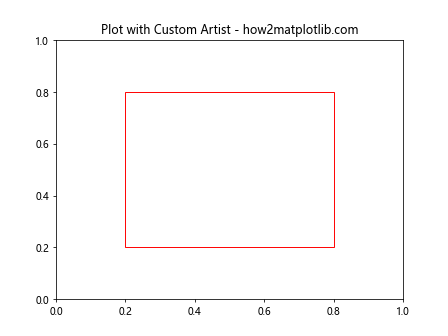
In this example, we add a custom rectangle to the plot and manually append it to the list of extra artists. This ensures that the rectangle is included in any tight bounding box calculations.
2. Handling Multiple Subplots
Matplotlib.axes.Axes.get_default_bbox_extra_artists() is particularly useful when working with multiple subplots:
import matplotlib.pyplot as plt
import numpy as np

fig, (ax1, ax2) = plt.subplots(1, 2, figsize=(12, 5))

x = np.linspace(0, 10, 100)
y1 = np.sin(x)
y2 = np.cos(x)

ax1.plot(x, y1, label='Sin(x) - how2matplotlib.com')
ax1.set_title('Sine Function')
ax1.legend()

ax2.plot(x, y2, label='Cos(x) - how2matplotlib.com')
ax2.set_title('Cosine Function')
ax2.legend()

extra_artists1 = ax1.get_default_bbox_extra_artists()
extra_artists2 = ax2.get_default_bbox_extra_artists()

print(f"Extra artists in subplot 1: {extra_artists1}")
print(f"Extra artists in subplot 2: {extra_artists2}")

plt.tight_layout()
plt.show()
Output:
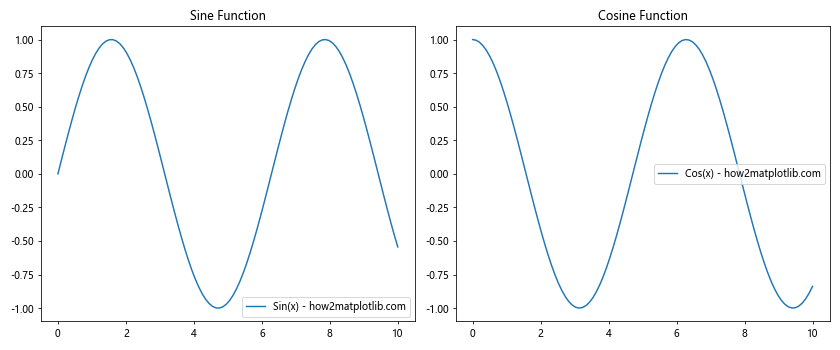
This example demonstrates how to use Matplotlib.axes.Axes.get_default_bbox_extra_artists() with multiple subplots, ensuring that each subplot’s extra artists are properly managed.
3. Combining with savefig()
Matplotlib.axes.Axes.get_default_bbox_extra_artists() is often used in conjunction with the savefig() function to ensure all elements are included when saving a figure:
import matplotlib.pyplot as plt
import numpy as np

fig, ax = plt.subplots(figsize=(8, 6))

x = np.linspace(0, 10, 100)
y = np.sin(x) * np.exp(-0.1 * x)

ax.plot(x, y, label='Damped Sine Wave - how2matplotlib.com')
ax.set_title('Damped Sine Wave')
ax.set_xlabel('Time')
ax.set_ylabel('Amplitude')

legend = ax.legend(loc='upper right', bbox_to_anchor=(1.25, 1))
ax.annotate('Peak', xy=(1.5, 0.9), xytext=(3, 0.8),
            arrowprops=dict(facecolor='black', shrink=0.05))

extra_artists = ax.get_default_bbox_extra_artists()
extra_artists.append(legend)

plt.tight_layout()
plt.savefig('damped_sine_wave.png', bbox_inches='tight', bbox_extra_artists=extra_artists)
plt.show()
Output:
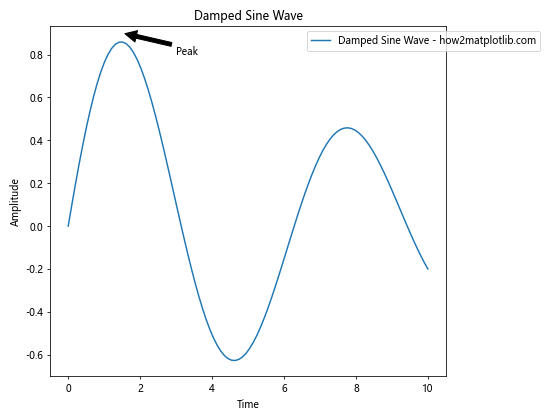
In this example, we use Matplotlib.axes.Axes.get_default_bbox_extra_artists() to ensure that the legend and annotation are included when saving the figure.
Best Practices for Using Matplotlib.axes.Axes.get_default_bbox_extra_artists()
To make the most of Matplotlib.axes.Axes.get_default_bbox_extra_artists(), consider the following best practices:
- Always use it when saving figures with tight bounding boxes.
- Manually append custom artists to the list if necessary.
- Be aware of the artists that are automatically included and those that need manual addition.
- Use it in combination with plt.tight_layout() for optimal results.
Let’s see an example that incorporates these best practices:
import matplotlib.pyplot as plt
import numpy as np

fig, ax = plt.subplots(figsize=(10, 6))

x = np.linspace(0, 10, 100)
y1 = np.sin(x)
y2 = np.cos(x)

ax.plot(x, y1, label='Sin(x) - how2matplotlib.com')
ax.plot(x, y2, label='Cos(x) - how2matplotlib.com')

ax.set_title('Trigonometric Functions with Best Practices')
ax.set_xlabel('X-axis')
ax.set_ylabel('Y-axis')

legend = ax.legend(loc='upper right', bbox_to_anchor=(1.25, 1))
annotation = ax.annotate('Intersection', xy=(1.57, 0), xytext=(3, 0.5),
                         arrowprops=dict(facecolor='black', shrink=0.05))

extra_artists = ax.get_default_bbox_extra_artists()
extra_artists.extend([legend, annotation])

plt.tight_layout()
plt.savefig('trig_functions_best_practices.png', bbox_inches='tight', bbox_extra_artists=extra_artists)
plt.show()
Output:
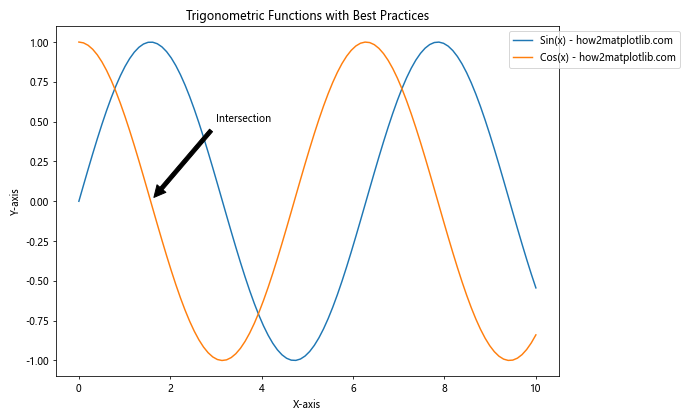
This example demonstrates the best practices for using Matplotlib.axes.Axes.get_default_bbox_extra_artists(), ensuring that all elements are properly included when saving the figure.
Common Pitfalls and How to Avoid Them
When working with Matplotlib.axes.Axes.get_default_bbox_extra_artists(), there are some common pitfalls to be aware of:
- Forgetting to include manually added artists
- Not using bbox_inches=’tight’ when saving figures
- Overlooking artists in nested structures
Let’s address these pitfalls with an example:
import matplotlib.pyplot as plt
import numpy as np

fig, ax = plt.subplots(figsize=(10, 6))

x = np.linspace(0, 10, 100)
y = np.sin(x) * np.exp(-0.1 * x)

ax.plot(x, y, label='Damped Sine Wave - how2matplotlib.com')
ax.set_title('Avoiding Common Pitfalls')
ax.set_xlabel('Time')
ax.set_ylabel('Amplitude')

# Create a nested structure
nested_text = ax.text(5, 0.5, 'Nested Text', bbox=dict(facecolor='white', edgecolor='black'))

legend = ax.legend(loc='upper right', bbox_to_anchor=(1.25, 1))
annotation = ax.annotate('Peak', xy=(1.5, 0.9), xytext=(3, 0.8),
                         arrowprops=dict(facecolor='black', shrink=0.05))

extra_artists = ax.get_default_bbox_extra_artists()
extra_artists.extend([legend, annotation, nested_text])

plt.tight_layout()
plt.savefig('avoiding_pitfalls.png', bbox_inches='tight', bbox_extra_artists=extra_artists)
plt.show()
Output:
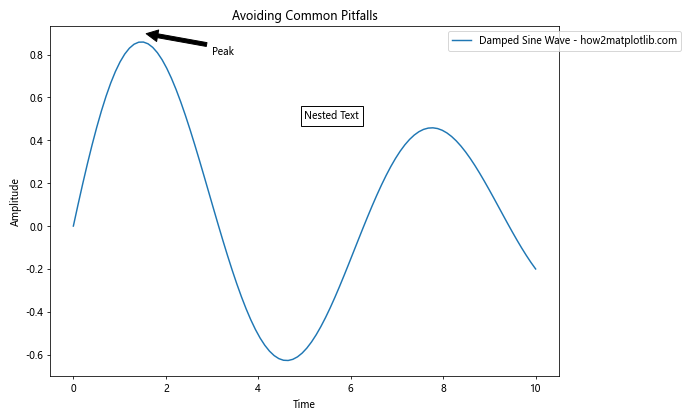
This example demonstrates how to avoid common pitfalls by explicitly including all relevant artists, using bbox_inches=’tight’, and considering nested structures.
Matplotlib.axes.Axes.get_default_bbox_extra_artists() in Different Plot Types
Matplotlib.axes.Axes.get_default_bbox_extra_artists() can be used with various plot types. Let’s explore its application in different scenarios:
1. Bar Plots
import matplotlib.pyplot as plt
import numpy as np

fig, ax = plt.subplots(figsize=(10, 6))

categories = ['A', 'B', 'C', 'D', 'E']
values = [23, 45, 56, 78, 32]

bars = ax.bar(categories, values)
ax.set_title('Bar Plot with Extra Artists - how2matplotlib.com')
ax.set_xlabel('Categories')
ax.set_ylabel('Values')

# Add value labels on top of each bar
for bar in bars:
    height = bar.get_height()
    ax.text(bar.get_x() + bar.get_width()/2., height,
            f'{height}',
            ha='center', va='bottom')

extra_artists = ax.get_default_bbox_extra_artists()
print(f"Extra artists in bar plot: {extra_artists}")

plt.tight_layout()
plt.show()
Output:
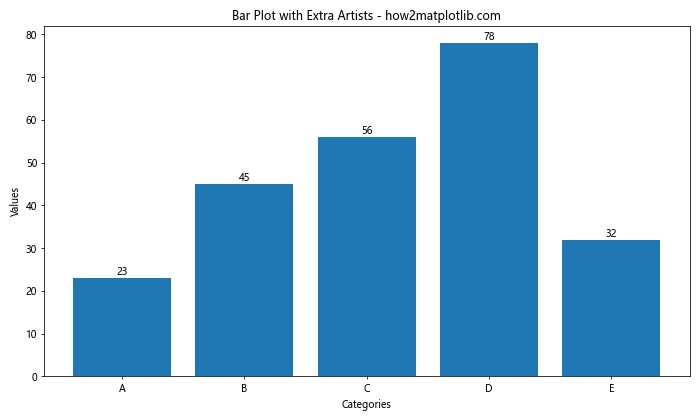
This example shows how to use Matplotlib.axes.Axes.get_default_bbox_extra_artists() with a bar plot, ensuring that the value labels are included as extra artists.
2. Scatter Plots
import matplotlib.pyplot as plt
import numpy as np

fig, ax = plt.subplots(figsize=(10, 6))

x = np.random.rand(50)
y = np.random.rand(50)
colors = np.random.rand(50)
sizes = 1000 * np.random.rand(50)

scatter = ax.scatter(x, y, c=colors, s=sizes, alpha=0.5)
ax.set_title('Scatter Plot with Colorbar - how2matplotlib.com')
ax.set_xlabel('X-axis')
ax.set_ylabel('Y-axis')

colorbar = plt.colorbar(scatter)
colorbar.set_label('Color Value')

extra_artists = ax.get_default_bbox_extra_artists()
extra_artists.append(colorbar.ax)

print(f"Extra artists in scatter plot: {extra_artists}")

plt.tight_layout()
plt.show()
Output:
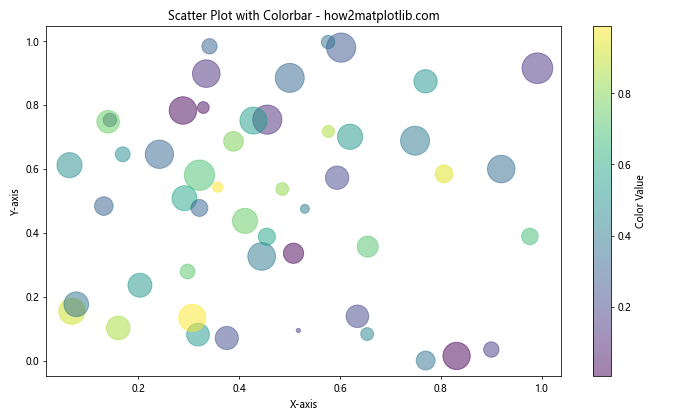
This example demonstrates the use of Matplotlib.axes.Axes.get_default_bbox_extra_artists() with a scatter plot, ensuring that the colorbar is included as an extra artist.
3. Pie Charts
import matplotlib.pyplot as plt

fig, ax = plt.subplots(figsize=(10, 6))

sizes = [15, 30, 45, 10]
labels = ['A', 'B', 'C', 'D']
explode = (0, 0.1, 0, 0)

wedges, texts, autotexts = ax.pie(sizes, explode=explode, labels=labels, autopct='%1.1f%%',
                                  shadow=True, startangle=90)
ax.set_title('Pie Chart with Legend - how2matplotlib.com')

legend = ax.legend(wedges, labels, title="Categories", loc="center left", bbox_to_anchor=(1, 0, 0.5, 1))

extra_artists = ax.get_default_bbox_extra_artists()
extra_artists.append(legend)

print(f"Extra artists in pie chart: {extra_artists}")

plt.tight_layout()
plt.show()
Output:
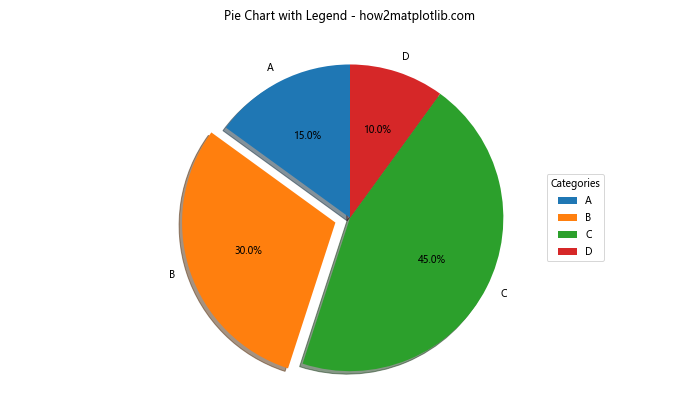
This example shows how to use Matplotlib.axes.Axes.get_default_bbox_extra_artists() with a pie chart, ensuring that the legend is included as an extra artist.
Advanced Techniques with Matplotlib.axes.Axes.get_default_bbox_extra_artists()
Let’s explore some advanced techniques using Matplotlib.axes.Axes.get_default_bbox_extra_artists():
Handling Multiple Axes
import matplotlib.pyplot as plt
import numpy as np

fig = plt.figure(figsize=(12, 8))

# Create multiple axes
ax1 = fig.add_subplot(221)
ax2 = fig.add_subplot(222)
ax3 = fig.add_subplot(223)
ax4 = fig.add_subplot(224)

# Plot data on each axis
x = np.linspace(0, 10, 100)
ax1.plot(x, np.sin(x), label='Sin(x) - how2matplotlib.com')
ax2.plot(x, np.cos(x), label='Cos(x) - how2matplotlib.com')
ax3.plot(x, np.tan(x), label='Tan(x) - how2matplotlib.com')
ax4.plot(x, np.exp(x), label='Exp(x) - how2matplotlib.com')

# Set titles and legends for each subplot
ax1.set_title('Sine Function')
ax2.set_title('Cosine Function')
ax3.set_title('Tangent Function')
ax4.set_title('Exponential Function')

for ax in [ax1, ax2, ax3, ax4]:
    ax.legend()

# Collect extra artists from all subplots
all_extra_artists = []
for ax in [ax1, ax2, ax3, ax4]:
    all_extra_artists.extend(ax.get_default_bbox_extra_artists())

print(f"Total extra artists: {len(all_extra_artists)}")

plt.tight_layout()
plt.show()
Output:
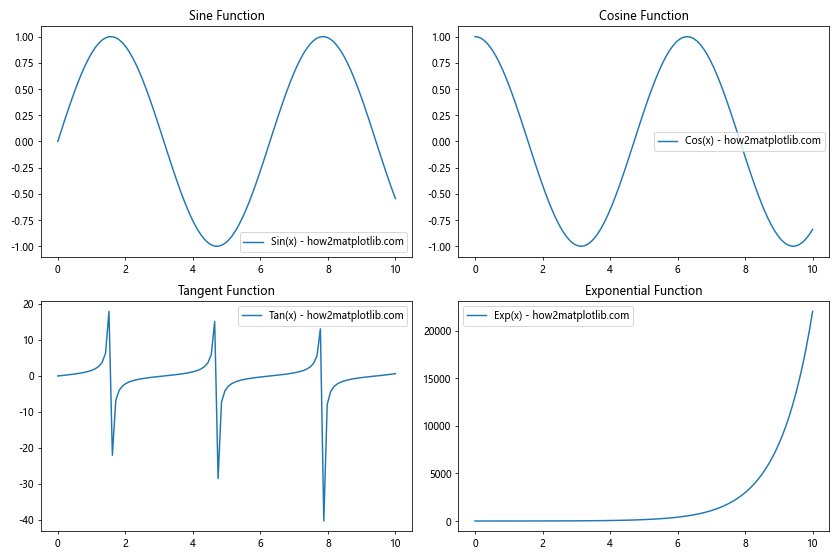
This example demonstrates how to handle multiple axes and collect extra artists from all subplots using Matplotlib.axes.Axes.get_default_bbox_extra_artists().
Dynamic Artist Management
import matplotlib.pyplot as plt
import numpy as np

fig, ax = plt.subplots(figsize=(10, 6))

x = np.linspace(0, 10, 100)
y = np.sin(x)

line, = ax.plot(x, y, label='Sin(x) - how2matplotlib.com')
ax.set_title('Dynamic Artist Management')

# Create a list to store dynamic text objects
dynamic_texts = []

def update_text(event):
    if event.inaxes == ax:
        # Remove previous text objects
        for text in dynamic_texts:
            text.remove()
        dynamic_texts.clear()

        # Add new text object
        text = ax.text(event.xdata, event.ydata, f'({event.xdata:.2f}, {event.ydata:.2f})')
        dynamic_texts.append(text)

        # Update extra artists
        extra_artists = ax.get_default_bbox_extra_artists()
        extra_artists.extend(dynamic_texts)

        fig.canvas.draw()

fig.canvas.mpl_connect('motion_notify_event', update_text)

plt.show()
Output:
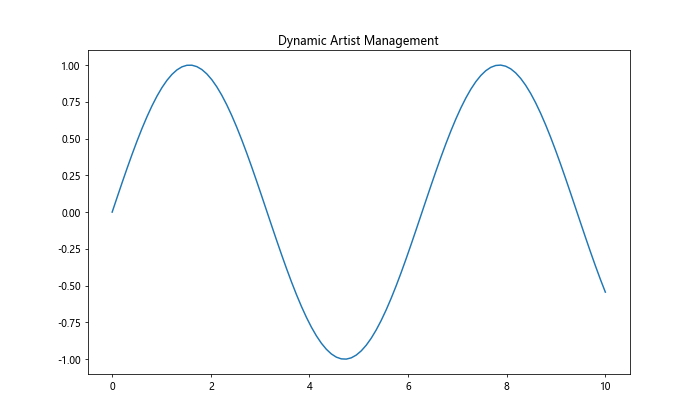
This example demonstrates dynamic artist management using Matplotlib.axes.Axes.get_default_bbox_extra_artists() in response to user interactions.
Troubleshooting Common Issues with Matplotlib.axes.Axes.get_default_bbox_extra_artists()
When working with Matplotlib.axes.Axes.get_default_bbox_extra_artists(), you may encounter some common issues. Here’s how to troubleshoot them:
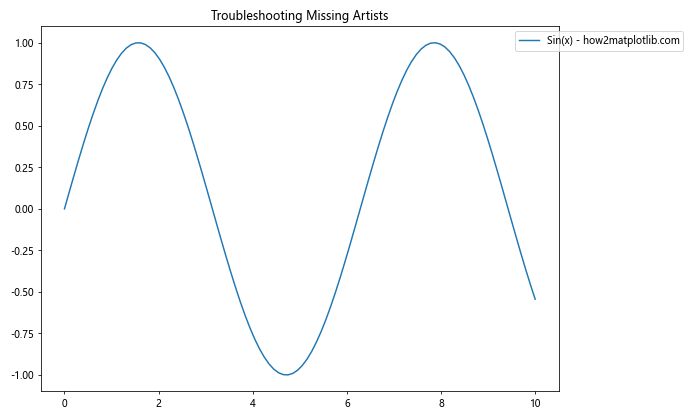
1. Missing Artists in Saved Figures
If you notice that some artists are missing in your saved figures, make sure you’re passing the extra artists to the savefig() function:
import matplotlib.pyplot as plt
import numpy as np

fig, ax = plt.subplots(figsize=(10, 6))

x = np.linspace(0, 10, 100)
y = np.sin(x)

ax.plot(x, y, label='Sin(x) - how2matplotlib.com')
ax.set_title('Troubleshooting Missing Artists')

legend = ax.legend(loc='upper right', bbox_to_anchor=(1.25, 1))

extra_artists = ax.get_default_bbox_extra_artists()
extra_artists.append(legend)

plt.tight_layout()
plt.savefig('troubleshooting_missing_artists.png', bbox_inches='tight', bbox_extra_artists=extra_artists)
plt.show()
Output:
2. Overlapping Artists
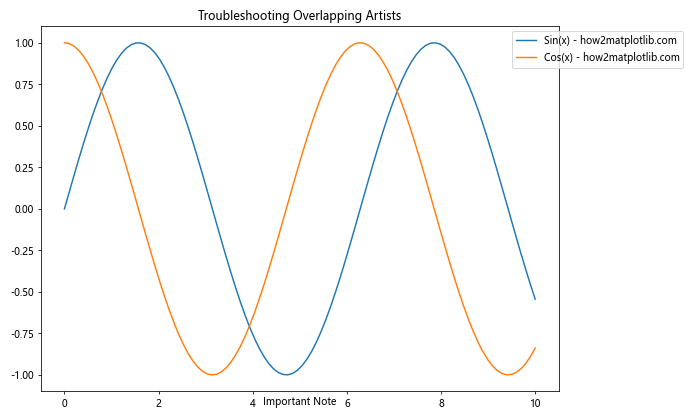
If you have overlapping artists, you may need to adjust their positions manually:
import matplotlib.pyplot as plt
import numpy as np

fig, ax = plt.subplots(figsize=(10, 6))

x = np.linspace(0, 10, 100)
y1 = np.sin(x)
y2 = np.cos(x)

ax.plot(x, y1, label='Sin(x) - how2matplotlib.com')
ax.plot(x, y2, label='Cos(x) - how2matplotlib.com')
ax.set_title('Troubleshooting Overlapping Artists')

legend = ax.legend(loc='upper right', bbox_to_anchor=(1.25, 1))
text = ax.text(5, 0, 'Important Note', ha='center', va='bottom')

# Adjust text position to avoid overlap
text.set_position((5, -1.2))

extra_artists = ax.get_default_bbox_extra_artists()
extra_artists.extend([legend, text])

plt.tight_layout()
plt.savefig('troubleshooting_overlapping_artists.png', bbox_inches='tight', bbox_extra_artists=extra_artists)
plt.show()
Output:
3. Inconsistent Behavior Across Matplotlib Versions
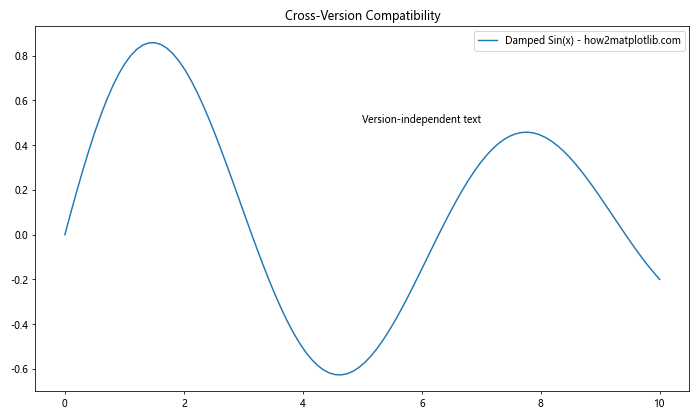
If you experience inconsistent behavior across different Matplotlib versions, it’s important to check the documentation for any changes in the API. Here’s an example that works across multiple versions:
import matplotlib.pyplot as plt
import numpy as np

fig, ax = plt.subplots(figsize=(10, 6))

x = np.linspace(0, 10, 100)
y = np.sin(x) * np.exp(-0.1 * x)

ax.plot(x, y, label='Damped Sin(x) - how2matplotlib.com')
ax.set_title('Cross-Version Compatibility')

legend = ax.legend(loc='upper right')
text = ax.text(5, 0.5, 'Version-independent text')

try:
    # For newer Matplotlib versions
    extra_artists = ax.get_default_bbox_extra_artists()
except AttributeError:
    # For older Matplotlib versions
    extra_artists = ax.get_children()

extra_artists.extend([legend, text])

plt.tight_layout()
plt.savefig('cross_version_compatibility.png', bbox_inches='tight', bbox_extra_artists=extra_artists)
plt.show()
Output:
Conclusion
Matplotlib.axes.Axes.get_default_bbox_extra_artists() is a powerful tool for managing artists in Matplotlib plots. Throughout this comprehensive guide, we’ve explored its various applications, best practices, and advanced techniques. By mastering this function, you can ensure that all elements of your plots are properly included when saving or displaying figures.
Remember to always consider the extra artists when working with complex plots, especially those with elements outside the main axes. Use Matplotlib.axes.Axes.get_default_bbox_extra_artists() in combination with tight_layout() and bbox_inches=’tight’ for optimal results.