Mastering Matplotlib.artist.Artist.set_zorder() in Python
Matplotlib.artist.Artist.set_zorder() in Python is a powerful method that allows you to control the drawing order of artists in Matplotlib plots. This function is essential for managing the layering of plot elements, ensuring that certain objects appear above or below others. In this comprehensive guide, we’ll explore the ins and outs of Matplotlib.artist.Artist.set_zorder(), providing detailed explanations and practical examples to help you master this crucial aspect of data visualization in Python.
Understanding Matplotlib.artist.Artist.set_zorder()
Matplotlib.artist.Artist.set_zorder() is a method that belongs to the Artist class in Matplotlib. It allows you to set the z-order of an artist, which determines its drawing order relative to other artists in the same axes. The z-order is a floating-point number, where higher values are drawn on top of lower values.
Here’s a simple example to demonstrate the basic usage of Matplotlib.artist.Artist.set_zorder():
import matplotlib.pyplot as plt

fig, ax = plt.subplots()

# Create two overlapping circles
circle1 = plt.Circle((0.5, 0.5), 0.4, color='red')
circle2 = plt.Circle((0.7, 0.7), 0.4, color='blue', alpha=0.5)

# Add circles to the axes
ax.add_artist(circle1)
ax.add_artist(circle2)

# Set z-order for the circles
circle1.set_zorder(1)
circle2.set_zorder(2)

ax.set_xlim(0, 1)
ax.set_ylim(0, 1)
ax.set_title('Matplotlib.artist.Artist.set_zorder() Example - how2matplotlib.com')
plt.show()
Output:

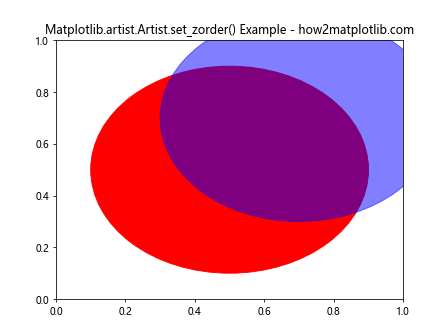
In this example, we create two overlapping circles and use Matplotlib.artist.Artist.set_zorder() to control their drawing order. The blue circle (circle2) is drawn on top of the red circle (circle1) because it has a higher z-order value.
The Importance of Z-Order in Matplotlib
Understanding and utilizing z-order is crucial for creating clear and visually appealing plots in Matplotlib. By controlling the drawing order of artists, you can:
- Ensure important elements are visible
- Create layered effects
- Manage overlapping plot elements
- Improve the overall aesthetics of your visualizations
Let’s explore these aspects in more detail with examples using Matplotlib.artist.Artist.set_zorder().
Ensuring Visibility of Important Elements
When working with complex plots, it’s essential to make sure that critical data points or annotations are not obscured by other elements. Matplotlib.artist.Artist.set_zorder() can help you achieve this.
import matplotlib.pyplot as plt
import numpy as np

fig, ax = plt.subplots()

# Generate sample data
x = np.linspace(0, 10, 100)
y1 = np.sin(x)
y2 = np.cos(x)

# Plot the data
ax.plot(x, y1, label='sin(x)')
ax.plot(x, y2, label='cos(x)')

# Add a horizontal line
hline = ax.axhline(y=0, color='r', linestyle='--')

# Add a text annotation
text = ax.text(5, 0.5, 'Important Note', fontsize=12, ha='center', va='center', bbox=dict(facecolor='white', edgecolor='black'))

# Set z-order to ensure visibility
hline.set_zorder(1)
text.set_zorder(2)

ax.legend()
ax.set_title('Matplotlib.artist.Artist.set_zorder() for Visibility - how2matplotlib.com')
plt.show()
Output:

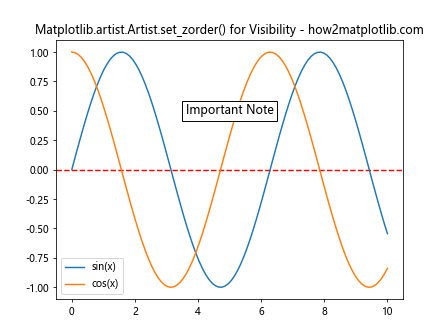
In this example, we use Matplotlib.artist.Artist.set_zorder() to ensure that the horizontal line and text annotation are drawn on top of the plotted data, making them clearly visible.
Creating Layered Effects
Matplotlib.artist.Artist.set_zorder() can be used to create interesting layered effects in your plots, adding depth and visual interest to your visualizations.
import matplotlib.pyplot as plt
import numpy as np

fig, ax = plt.subplots()

# Generate sample data
x = np.linspace(0, 10, 100)
y1 = np.sin(x)
y2 = np.cos(x)

# Create a gradient background
gradient = np.linspace(0, 1, 100).reshape(1, -1)
ax.imshow(gradient, extent=[0, 10, -1.5, 1.5], aspect='auto', cmap='coolwarm', alpha=0.3)

# Plot the data
line1 = ax.plot(x, y1, label='sin(x)', color='blue')
line2 = ax.plot(x, y2, label='cos(x)', color='red')

# Set z-order for layered effect
ax.collections[0].set_zorder(0)  # Background gradient
line1[0].set_zorder(1)
line2[0].set_zorder(2)

ax.legend()
ax.set_title('Matplotlib.artist.Artist.set_zorder() for Layered Effects - how2matplotlib.com')
plt.show()
In this example, we create a layered effect by setting different z-order values for the background gradient and the plotted lines using Matplotlib.artist.Artist.set_zorder().
Managing Overlapping Plot Elements
When dealing with scatter plots or other visualizations where data points may overlap, Matplotlib.artist.Artist.set_zorder() can help you control which points are drawn on top.
import matplotlib.pyplot as plt
import numpy as np

fig, ax = plt.subplots()

# Generate sample data
np.random.seed(42)
x1 = np.random.rand(50)
y1 = np.random.rand(50)
x2 = np.random.rand(50)
y2 = np.random.rand(50)

# Create scatter plots
scatter1 = ax.scatter(x1, y1, c='blue', label='Group 1', alpha=0.5)
scatter2 = ax.scatter(x2, y2, c='red', label='Group 2', alpha=0.5)

# Set z-order to control overlap
scatter1.set_zorder(1)
scatter2.set_zorder(2)

ax.legend()
ax.set_title('Matplotlib.artist.Artist.set_zorder() for Overlapping Elements - how2matplotlib.com')
plt.show()
Output:

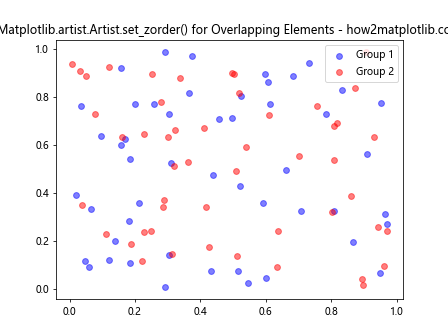
In this example, we use Matplotlib.artist.Artist.set_zorder() to ensure that the red points (Group 2) are drawn on top of the blue points (Group 1) where they overlap.
Advanced Techniques with Matplotlib.artist.Artist.set_zorder()
Now that we’ve covered the basics, let’s explore some advanced techniques and use cases for Matplotlib.artist.Artist.set_zorder().
Z-Order in 3D Plots
Matplotlib.artist.Artist.set_zorder() can also be used in 3D plots to control the drawing order of elements.
import matplotlib.pyplot as plt
from mpl_toolkits.mplot3d import Axes3D
import numpy as np

fig = plt.figure()
ax = fig.add_subplot(111, projection='3d')

# Generate sample data
x = np.linspace(-5, 5, 100)
y = np.linspace(-5, 5, 100)
X, Y = np.meshgrid(x, y)
Z1 = np.sin(np.sqrt(X**2 + Y**2))
Z2 = np.cos(np.sqrt(X**2 + Y**2))

# Create two surface plots
surf1 = ax.plot_surface(X, Y, Z1, cmap='coolwarm', alpha=0.7)
surf2 = ax.plot_surface(X, Y, Z2, cmap='viridis', alpha=0.7)

# Set z-order for the surfaces
surf1.set_zorder(1)
surf2.set_zorder(2)

ax.set_title('Matplotlib.artist.Artist.set_zorder() in 3D Plots - how2matplotlib.com')
plt.show()
Output:

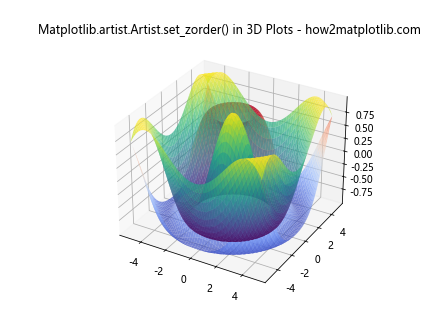
In this example, we use Matplotlib.artist.Artist.set_zorder() to control which surface is drawn on top in a 3D plot.
Best Practices for Using Matplotlib.artist.Artist.set_zorder()
To make the most of Matplotlib.artist.Artist.set_zorder(), consider the following best practices:
- Plan your z-order strategy: Before creating your plot, think about which elements should be on top and assign z-order values accordingly.
Use consistent z-order values: Establish a convention for z-order values (e.g., background elements at 0, data at 1, annotations at 2) and stick to it across your visualizations.
Avoid unnecessary z-order assignments: Only set z-order when needed to resolve overlapping issues or create specific visual effects.
Use relative z-order values: Instead of using absolute values, consider using relative values (e.g.,
artist.set_zorder(artist.get_zorder() + 1)) to maintain flexibility.Combine with other properties: Use Matplotlib.artist.Artist.set_zorder() in conjunction with other properties like alpha, linewidth, and color to create more effective visualizations.
Let’s see an example that demonstrates these best practices: