Comprehensive Guide to Matplotlib.axes.Axes.findobj() in Python
Matplotlib.axes.Axes.findobj() in Python is a powerful method that allows you to search for and retrieve specific artist objects within a Matplotlib plot. This function is an essential tool for manipulating and customizing plots, especially when dealing with complex visualizations. In this comprehensive guide, we’ll explore the ins and outs of Matplotlib.axes.Axes.findobj(), providing detailed explanations, numerous examples, and practical use cases to help you master this versatile function.
Understanding Matplotlib.axes.Axes.findobj() Basics
Matplotlib.axes.Axes.findobj() is a method that belongs to the Axes class in Matplotlib. Its primary purpose is to search for and return artist objects that match specific criteria within a given Axes object. This function is particularly useful when you need to locate and modify specific elements of a plot after it has been created.
The basic syntax of Matplotlib.axes.Axes.findobj() is as follows:
ax.findobj(match=None, include_self=True)
Let’s break down the parameters:
match: This is an optional parameter that specifies the criteria for matching objects. It can be a callable function, a class, or None.include_self: A boolean value that determines whether to include the Axes object itself in the search results.
Now, let’s dive into a simple example to demonstrate how Matplotlib.axes.Axes.findobj() works:
import matplotlib.pyplot as plt

fig, ax = plt.subplots()
ax.plot([1, 2, 3, 4], [1, 4, 2, 3], label='how2matplotlib.com')
ax.set_title('Matplotlib.axes.Axes.findobj() Example')

# Find all Line2D objects in the Axes
lines = ax.findobj(plt.Line2D)

print(f"Number of Line2D objects found: {len(lines)}")
plt.show()
Output:
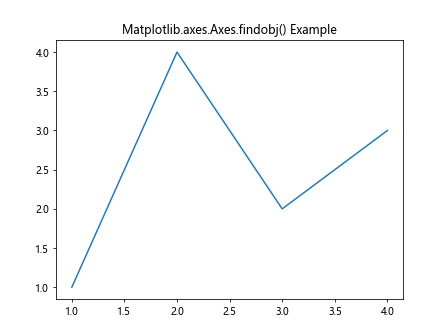
In this example, we create a simple line plot and then use Matplotlib.axes.Axes.findobj() to find all Line2D objects within the Axes. The function returns a list of matching objects, which we can then manipulate or analyze as needed.
Advanced Usage of Matplotlib.axes.Axes.findobj()
Matplotlib.axes.Axes.findobj() offers more advanced features that allow for precise object searching and filtering. Let’s explore some of these capabilities:
Searching by Object Type
One common use case for Matplotlib.axes.Axes.findobj() is to search for objects of a specific type. This is particularly useful when you want to modify all instances of a certain plot element, such as lines, text, or patches.
import matplotlib.pyplot as plt

fig, ax = plt.subplots()
ax.plot([1, 2, 3, 4], [1, 4, 2, 3], label='how2matplotlib.com Line 1')
ax.plot([1, 2, 3, 4], [2, 3, 1, 4], label='how2matplotlib.com Line 2')
ax.set_title('Searching by Object Type')

# Find all Line2D objects
lines = ax.findobj(plt.Line2D)

# Change the color of all lines to red
for line in lines:
    line.set_color('red')

plt.show()
Output:
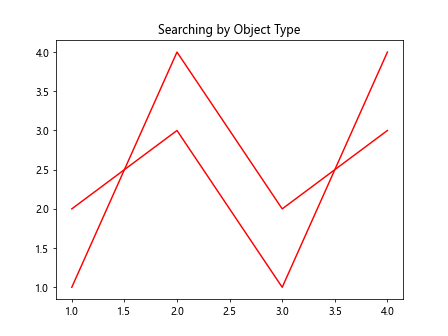
In this example, we use Matplotlib.axes.Axes.findobj() to find all Line2D objects in the plot and change their color to red. This demonstrates how you can easily modify multiple objects of the same type in a single operation.
Using Custom Match Functions
Matplotlib.axes.Axes.findobj() allows you to use custom match functions for more complex searching criteria. This is particularly useful when you need to find objects based on specific attributes or conditions.
import matplotlib.pyplot as plt

fig, ax = plt.subplots()
ax.plot([1, 2, 3, 4], [1, 4, 2, 3], label='how2matplotlib.com Line 1', linewidth=2)
ax.plot([1, 2, 3, 4], [2, 3, 1, 4], label='how2matplotlib.com Line 2', linewidth=1)
ax.set_title('Custom Match Function Example')

# Custom match function to find lines with linewidth > 1
def match_thick_lines(obj):
    return isinstance(obj, plt.Line2D) and obj.get_linewidth() > 1

# Find thick lines
thick_lines = ax.findobj(match_thick_lines)

# Change the color of thick lines to green
for line in thick_lines:
    line.set_color('green')

plt.show()
Output:
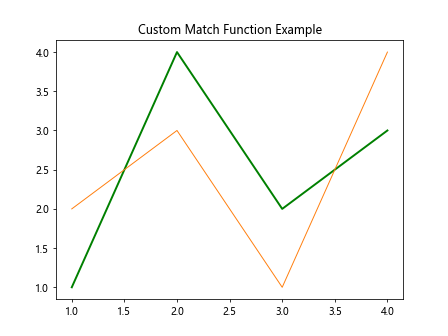
In this example, we define a custom match function that finds Line2D objects with a linewidth greater than 1. We then use this function with Matplotlib.axes.Axes.findobj() to locate and modify only the thick lines in the plot.
Practical Applications of Matplotlib.axes.Axes.findobj()
Now that we’ve covered the basics and some advanced usage, let’s explore practical applications of Matplotlib.axes.Axes.findobj() in various plotting scenarios.
Modifying Text Elements
Matplotlib.axes.Axes.findobj() can be used to locate and modify text elements in a plot, such as labels, titles, or annotations.
import matplotlib.pyplot as plt

fig, ax = plt.subplots()
ax.plot([1, 2, 3, 4], [1, 4, 2, 3], label='how2matplotlib.com Data')
ax.set_title('Original Title')
ax.set_xlabel('X-axis')
ax.set_ylabel('Y-axis')
ax.legend()

# Find all text objects
text_objects = ax.findobj(plt.Text)

# Modify text properties
for text in text_objects:
    text.set_fontsize(14)
    text.set_color('navy')

# Change the title specifically
title = ax.findobj(lambda obj: isinstance(obj, plt.Text) and obj.get_text() == 'Original Title')
if title:
    title[0].set_text('Modified Title using findobj()')

plt.show()
Output:
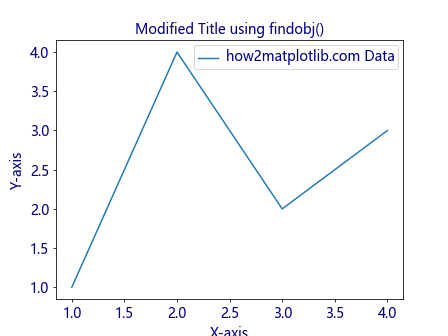
This example demonstrates how to use Matplotlib.axes.Axes.findobj() to locate and modify various text elements in a plot, including changing font sizes, colors, and the title text.
Modifying Specific Plot Elements
Matplotlib.axes.Axes.findobj() can be used to target and modify specific plot elements based on their properties:
import matplotlib.pyplot as plt
import numpy as np

fig, ax = plt.subplots()
x = np.linspace(0, 10, 100)
ax.plot(x, np.sin(x), label='how2matplotlib.com Sin')
ax.plot(x, np.cos(x), label='how2matplotlib.com Cos')
ax.set_title('Trigonometric Functions')
ax.legend()

# Find the sine curve (assuming it's the first line plotted)
sine_curve = ax.findobj(plt.Line2D)[0]

# Modify the sine curve
sine_curve.set_linewidth(3)
sine_curve.set_linestyle('--')
sine_curve.set_color('red')

plt.show()
Output:
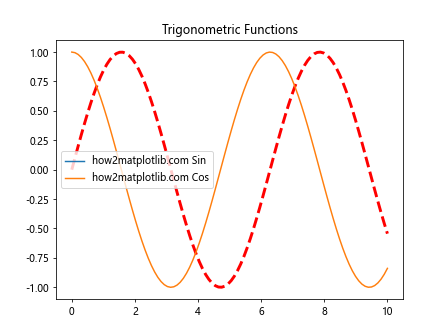
This example shows how to use Matplotlib.axes.Axes.findobj() to locate a specific line in the plot (the sine curve) and modify its appearance.
Advanced Techniques with Matplotlib.axes.Axes.findobj()
Let’s explore some more advanced techniques and use cases for Matplotlib.axes.Axes.findobj() to further enhance your plotting capabilities.
Combining Multiple Search Criteria
You can create complex search criteria by combining multiple conditions in your match function:
import matplotlib.pyplot as plt
import numpy as np

fig, ax = plt.subplots()
x = np.linspace(0, 10, 100)
ax.plot(x, np.sin(x), label='how2matplotlib.com Sin', linewidth=2)
ax.plot(x, np.cos(x), label='how2matplotlib.com Cos', linewidth=1)
ax.set_title('Combined Search Criteria Example')
ax.legend()

def match_thick_sin_line(obj):
    return (isinstance(obj, plt.Line2D) and
            obj.get_linewidth() > 1 and
            'Sin' in obj.get_label())

# Find thick sine line
thick_sin_line = ax.findobj(match_thick_sin_line)

if thick_sin_line:
    thick_sin_line[0].set_color('red')
    thick_sin_line[0].set_linestyle(':')

plt.show()
Output:
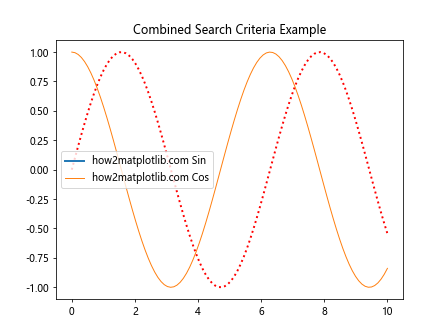
In this example, we create a match function that combines multiple criteria to find a specific line (thick sine line) and modify its appearance.
Recursive Searching with include_self
The include_self parameter in Matplotlib.axes.Axes.findobj() allows for recursive searching through the artist tree:
import matplotlib.pyplot as plt

fig, (ax1, ax2) = plt.subplots(1, 2, figsize=(10, 4))
ax1.plot([1, 2, 3], [1, 2, 3], label='how2matplotlib.com Plot 1')
ax2.plot([3, 2, 1], [1, 2, 3], label='how2matplotlib.com Plot 2')

# Search recursively through all axes
all_lines = fig.findobj(plt.Line2D, include_self=True)

print(f"Total number of Line2D objects found: {len(all_lines)}")

# Modify all lines
for line in all_lines:
    line.set_linewidth(3)
    line.set_alpha(0.7)

plt.show()
Output:
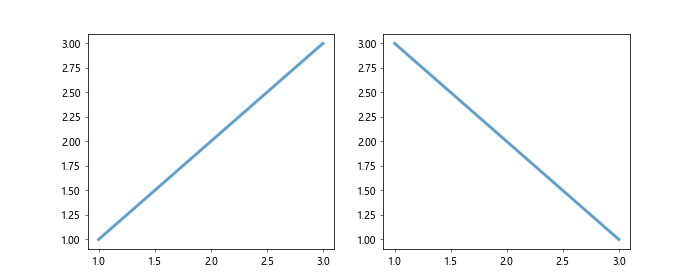
This example demonstrates how to use the include_self parameter to search for objects across multiple Axes in a figure.
Best Practices and Performance Considerations
When using Matplotlib.axes.Axes.findobj(), it’s important to keep in mind some best practices and performance considerations:
- Be specific in your search criteria to avoid unnecessary iterations through all objects.
- When possible, cache the results of findobj() calls if you plan to use them multiple times.
- For complex plots with many objects, consider alternative methods of object management to improve performance.
Here’s an example demonstrating these practices:
import matplotlib.pyplot as plt
import numpy as np

fig, ax = plt.subplots()
x = np.linspace(0, 10, 100)
for i in range(10):
    ax.plot(x, np.sin(x + i), label=f'how2matplotlib.com Line {i}')

ax.set_title('Performance Optimization Example')
ax.legend()

# Cache findobj results
all_lines = ax.findobj(plt.Line2D)

# Modify specific lines efficiently
for line in all_lines:
    if 'Line 5' in line.get_label():
        line.set_color('red')
        line.set_linewidth(3)
        break  # Exit loop once the desired line is found

plt.show()
Output:
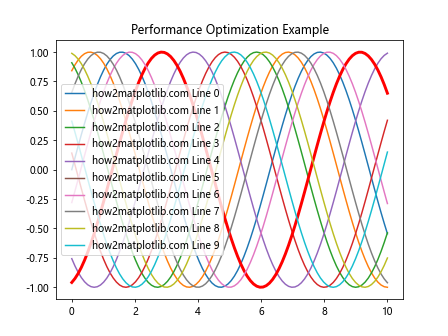
This example demonstrates how to cache the results of findobj() and use them efficiently to modify specific plot elements.
Integrating Matplotlib.axes.Axes.findobj() with Other Matplotlib Features
Matplotlib.axes.Axes.findobj() can be effectively combined with other Matplotlib features to create more complex and interactive visualizations. Let’s explore some of these integrations:
Combining with Event Handling
You can use Matplotlib.axes.Axes.findobj() in conjunction with event handling to create interactive plots:
import matplotlib.pyplot as plt
import numpy as np

fig, ax = plt.subplots()
x = np.linspace(0, 10, 100)
ax.plot(x, np.sin(x), label='how2matplotlib.com Sin')
ax.plot(x, np.cos(x), label='how2matplotlib.com Cos')
ax.set_title('Click to Toggle Line Visibility')
ax.legend()

def on_click(event):
    if event.inaxes == ax:
        lines = ax.findobj(plt.Line2D)
        for line in lines:
            line.set_visible(not line.get_visible())
        fig.canvas.draw()

fig.canvas.mpl_connect('button_press_event', on_click)
plt.show()
Output:
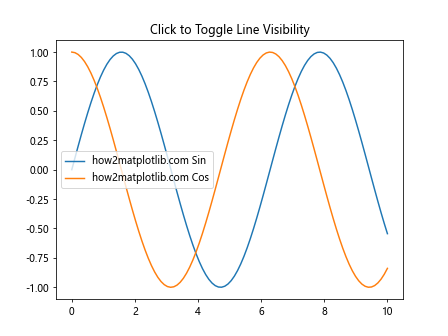
In this example, we use Matplotlib.axes.Axes.findobj() within an event handler to toggle the visibility of all lines when the user clicks on the plot.
Integration with Subplots
Matplotlib.axes.Axes.findobj() can be particularly useful when working with multiple subplots:
import matplotlib.pyplot as plt
import numpy as np

fig, (ax1, ax2) = plt.subplots(1, 2, figsize=(10, 4))
x = np.linspace(0, 10, 100)

ax1.plot(x, np.sin(x), label='how2matplotlib.com Sin')
ax1.set_title('Subplot 1')
ax1.legend()

ax2.plot(x, np.cos(x), label='how2matplotlib.com Cos')
ax2.set_title('Subplot 2')
ax2.legend()

# Find all lines across both subplots
all_lines = fig.findobj(plt.Line2D)

# Modify all lines
for line in all_lines:
    line.set_linewidth(2)
    line.set_alpha(0.7)

# Find and modify all titles
all_titles = fig.findobj(lambda obj: isinstance(obj, plt.Text) and obj.get_position()[1] > 1)
for title in all_titles:
    title.set_fontsize(16)
    title.set_fontweight('bold')

plt.show()
Output:
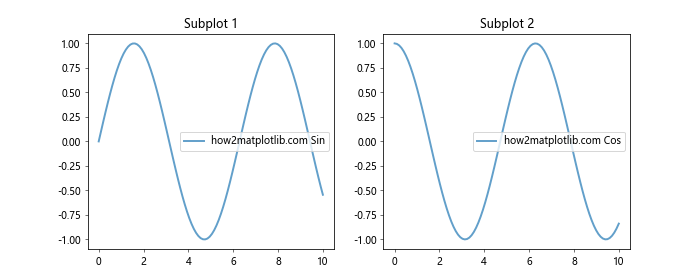
This example demonstrates how to use Matplotlib.axes.Axes.findobj() to modify elements across multiple subplots efficiently.
Advanced Customization with Matplotlib.axes.Axes.findobj()
Matplotlib.axes.Axes.findobj() can be used for advanced customization of plots, allowing for fine-grained control over individual elements. Let’s explore some more advanced customization techniques:
Creating Custom Annotations
Matplotlib.axes.Axes.findobj() can be used to add custom annotations to specific plot elements:
import matplotlib.pyplot as plt
import numpy as np

fig, ax = plt.subplots()
x = np.linspace(0, 10, 100)
ax.plot(x, np.sin(x), label='how2matplotlib.com Sin')
ax.plot(x, np.cos(x), label='how2matplotlib.com Cos')
ax.set_title('Custom Annotations Example')
ax.legend()

# Find all lines
lines = ax.findobj(plt.Line2D)

# Add custom annotations to each line
for i, line in enumerate(lines):
    xdata, ydata = line.get_data()
    max_y = max(ydata)
    max_x = xdata[np.argmax(ydata)]
    ax.annotate(f'Max: {max_y:.2f}',
                xy=(max_x, max_y),
                xytext=(max_x, max_y + 0.1),
                arrowprops=dict(facecolor='black', shrink=0.05),
                horizontalalignment='center')

plt.show()
Output:
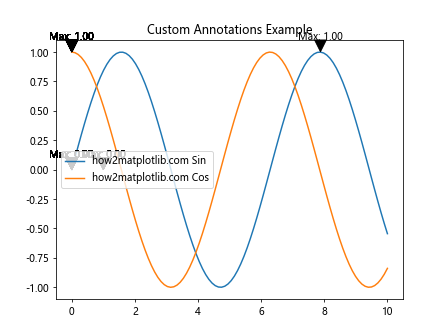
In this example, we use Matplotlib.axes.Axes.findobj() to locate each line in the plot and add a custom annotation showing the maximum y-value for each line.
Handling Complex Plot Structures with Matplotlib.axes.Axes.findobj()
As plots become more complex, Matplotlib.axes.Axes.findobj() becomes an even more powerful tool for managing and modifying plot elements. Let’s explore some scenarios involving more complex plot structures:
Working with Nested Artists
In some cases, you may need to search for objects nested within other objects. Matplotlib.axes.Axes.findobj() can handle this with its recursive search capability:
import matplotlib.pyplot as plt
import numpy as np

fig, ax = plt.subplots()
x = np.linspace(0, 10, 100)
y1 = np.sin(x)
y2 = np.cos(x)

# Create a complex plot with nested artists
line1 = ax.plot(x, y1, label='how2matplotlib.com Sin')[0]
line2 = ax.plot(x, y2, label='how2matplotlib.com Cos')[0]
ax.set_title('Nested Artists Example')
ax.legend()

# Add error bars (which contain Line2D objects)
ax.errorbar(x[::10], y1[::10], yerr=0.1, fmt='none', ecolor='r', capsize=5)
ax.errorbar(x[::10], y2[::10], yerr=0.1, fmt='none', ecolor='b', capsize=5)

# Find all Line2D objects, including those in error bars
all_lines = ax.findobj(plt.Line2D)

print(f"Total number of Line2D objects found: {len(all_lines)}")

# Modify all line widths
for line in all_lines:
    line.set_linewidth(2)

plt.show()
Output:
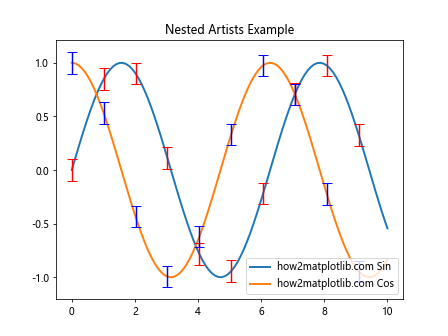
This example demonstrates how Matplotlib.axes.Axes.findobj() can find and modify Line2D objects that are nested within other plot elements, such as error bars.
Handling Grouped Plot Elements
When dealing with grouped plot elements, such as bar plots or stacked areas, Matplotlib.axes.Axes.findobj() can help you target specific groups:
import matplotlib.pyplot as plt
import numpy as np

fig, ax = plt.subplots()
x = np.arange(5)
y1 = [1, 2, 3, 4, 5]
y2 = [2, 3, 4, 5, 6]
y3 = [3, 4, 5, 6, 7]

ax.bar(x, y1, label='how2matplotlib.com Group 1')
ax.bar(x, y2, bottom=y1, label='how2matplotlib.com Group 2')
ax.bar(x, y3, bottom=np.array(y1) + np.array(y2), label='how2matplotlib.com Group 3')

ax.set_title('Grouped Bar Plot Example')
ax.legend()

# Find all Rectangle objects (bars)
bars = ax.findobj(plt.Rectangle)

# Modify specific group of bars
for i, bar in enumerate(bars):
    if i % 3 == 0:  # Every third bar (bottom group)
        bar.set_facecolor('red')
        bar.set_edgecolor('black')
        bar.set_linewidth(2)

plt.show()
Output:
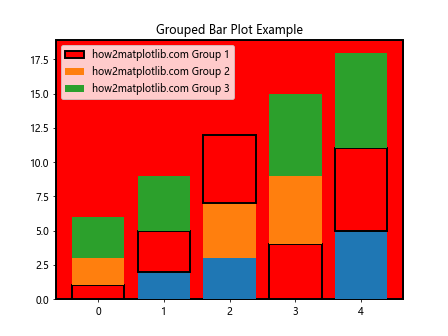
In this example, we use Matplotlib.axes.Axes.findobj() to locate and modify specific groups of bars in a stacked bar plot.
Optimizing Performance with Matplotlib.axes.Axes.findobj()
While Matplotlib.axes.Axes.findobj() is a powerful tool, it’s important to use it efficiently, especially when dealing with large or complex plots. Here are some tips for optimizing performance:
Using Specific Search Criteria
When possible, use specific search criteria to reduce the number of objects that need to be checked:
import matplotlib.pyplot as plt
import numpy as np

fig, ax = plt.subplots()
x = np.linspace(0, 10, 100)
ax.plot(x, np.sin(x), label='how2matplotlib.com Sin')
ax.plot(x, np.cos(x), label='how2matplotlib.com Cos')
ax.set_title('Specific Search Criteria Example')
ax.legend()

# Inefficient: searches all objects
all_objects = ax.findobj()
print(f"Total objects found: {len(all_objects)}")

# More efficient: searches only for Line2D objects
lines = ax.findobj(plt.Line2D)
print(f"Line2D objects found: {len(lines)}")

# Even more specific: search for a line with a particular label
sin_line = ax.findobj(lambda obj: isinstance(obj, plt.Line2D) and 'Sin' in obj.get_label())
if sin_line:
    sin_line[0].set_color('red')
    sin_line[0].set_linewidth(3)

plt.show()
Output:
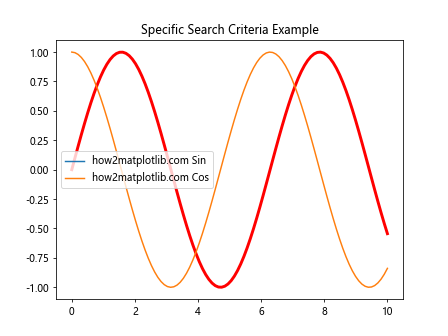
This example shows how using more specific search criteria can reduce the number of objects that need to be checked, potentially improving performance for large or complex plots.
Troubleshooting Common Issues with Matplotlib.axes.Axes.findobj()
When working with Matplotlib.axes.Axes.findobj(), you may encounter some common issues. Here are some troubleshooting tips:
Objects Not Found
If Matplotlib.axes.Axes.findobj() is not returning the objects you expect, double-check your search criteria and the structure of your plot:
import matplotlib.pyplot as plt
import numpy as np

fig, ax = plt.subplots()
x = np.linspace(0, 10, 100)
ax.plot(x, np.sin(x), label='how2matplotlib.com Sin')
ax.set_title('Troubleshooting Example')

# Attempt to find a non-existent object
cosine_line = ax.findobj(lambda obj: isinstance(obj, plt.Line2D) and 'Cos' in obj.get_label())
print(f"Cosine line found: {bool(cosine_line)}")

# Correct search for existing object
sine_line = ax.findobj(lambda obj: isinstance(obj, plt.Line2D) and 'Sin' in obj.get_label())
print(f"Sine line found: {bool(sine_line)}")

plt.show()
Output:
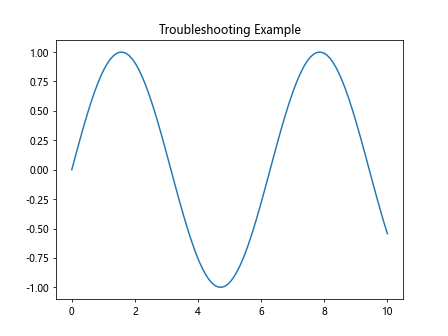
This example demonstrates how to check for the existence of objects and adjust your search criteria accordingly.
Unexpected Object Types
Sometimes, you might encounter unexpected object types when using Matplotlib.axes.Axes.findobj(). It’s helpful to inspect the types of objects returned:
import matplotlib.pyplot as plt
import numpy as np

fig, ax = plt.subplots()
x = np.linspace(0, 10, 100)
ax.plot(x, np.sin(x), label='how2matplotlib.com Sin')
ax.set_title('Object Type Inspection Example')
ax.legend()

# Find all objects
all_objects = ax.findobj()

# Inspect object types
for obj in all_objects:
    print(f"Object type: {type(obj).__name__}")

plt.show()
Output:
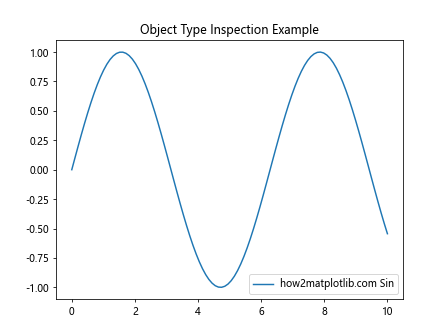
This example shows how to inspect the types of objects returned by findobj(), which can help you refine your search criteria or understand the structure of your plot.
Conclusion
Matplotlib.axes.Axes.findobj() is a powerful and versatile tool for manipulating and customizing Matplotlib plots. Throughout this comprehensive guide, we’ve explored its basic usage, advanced techniques, practical applications, and best practices. We’ve seen how this function can be used to modify specific plot elements, create dynamic visualizations, and handle complex plot structures.
By mastering Matplotlib.axes.Axes.findobj(), you can take your data visualization skills to the next level, creating more interactive, customized, and efficient plots. Remember to consider performance implications when working with large or complex plots, and always strive to use specific search criteria when possible.