How to Use Matplotlib.axes.Axes.draw_artist() in Python
Matplotlib.axes.Axes.draw_artist() in Python is a powerful method that allows for selective redrawing of specific artists within a Matplotlib figure. This function is particularly useful when you need to update only certain elements of a plot without redrawing the entire figure, which can significantly improve performance in interactive applications. In this comprehensive guide, we’ll explore the ins and outs of Matplotlib.axes.Axes.draw_artist(), providing detailed explanations and numerous examples to help you master this essential Matplotlib feature.
Understanding Matplotlib.axes.Axes.draw_artist()
Matplotlib.axes.Axes.draw_artist() is a method of the Axes class in Matplotlib. It’s designed to redraw a specific artist on the canvas without updating the entire figure. This can be particularly useful in animations or interactive plots where you want to update only certain elements of the plot efficiently.
The basic syntax of Matplotlib.axes.Axes.draw_artist() is as follows:
ax.draw_artist(artist)
Where ax is an Axes object, and artist is the Matplotlib artist (such as a Line2D, Text, or Patch object) that you want to redraw.
Let’s start with a simple example to illustrate how Matplotlib.axes.Axes.draw_artist() works:
import matplotlib.pyplot as plt
import numpy as np

fig, ax = plt.subplots()
x = np.linspace(0, 10, 100)
line, = ax.plot(x, np.sin(x), label='how2matplotlib.com')

ax.set_title('Using Matplotlib.axes.Axes.draw_artist()')
ax.legend()

# Redraw only the line
ax.draw_artist(line)

plt.show()
Output:
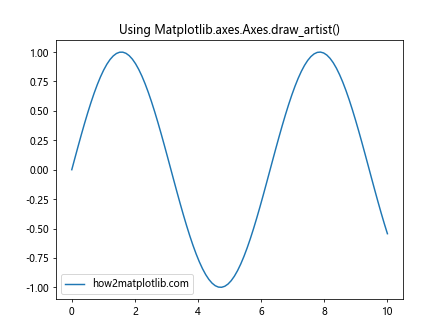
In this example, we create a simple sine wave plot and then use Matplotlib.axes.Axes.draw_artist() to redraw only the line. This doesn’t have a visible effect in a static plot, but it’s the foundation for more complex uses.
When to Use Matplotlib.axes.Axes.draw_artist()
Matplotlib.axes.Axes.draw_artist() is particularly useful in the following scenarios:
- Animations: When you need to update only specific elements of a plot in each frame.
- Interactive plots: For real-time updates of certain plot elements based on user input.
- Performance optimization: When redrawing the entire figure is unnecessary and time-consuming.
Let’s explore each of these scenarios with examples.
Using Matplotlib.axes.Axes.draw_artist() in Animations
Animations are one of the most common use cases for Matplotlib.axes.Axes.draw_artist(). By selectively redrawing only the changing elements, you can create smoother and more efficient animations.
Here’s an example of a simple animation using Matplotlib.axes.Axes.draw_artist():
import matplotlib.pyplot as plt
import numpy as np
from matplotlib.animation import FuncAnimation

fig, ax = plt.subplots()
x = np.linspace(0, 2 * np.pi, 100)
line, = ax.plot(x, np.sin(x), label='how2matplotlib.com')

ax.set_title('Matplotlib.axes.Axes.draw_artist() Animation')
ax.legend()

def update(frame):
    line.set_ydata(np.sin(x + frame / 10))
    ax.draw_artist(ax.patch)
    ax.draw_artist(line)
    return line,

ani = FuncAnimation(fig, update, frames=100, interval=50, blit=True)
plt.show()
Output:
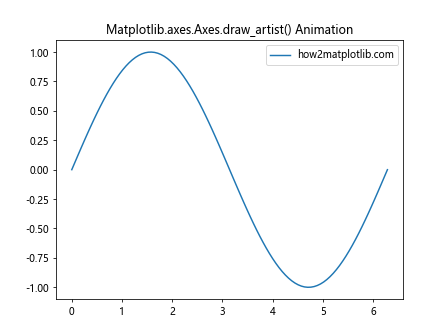
In this animation, we’re using Matplotlib.axes.Axes.draw_artist() to redraw only the line and the axes patch in each frame. This results in a smooth, efficient animation of a moving sine wave.
Interactive Plots with Matplotlib.axes.Axes.draw_artist()
Matplotlib.axes.Axes.draw_artist() can be particularly useful in interactive plots where you want to update elements based on user input. Here’s an example of a simple interactive plot:
import matplotlib.pyplot as plt
import numpy as np

fig, ax = plt.subplots()
x = np.linspace(0, 10, 100)
line, = ax.plot(x, np.sin(x), label='how2matplotlib.com')

ax.set_title('Interactive Plot with Matplotlib.axes.Axes.draw_artist()')
ax.legend()

def on_click(event):
    if event.inaxes == ax:
        line.set_ydata(np.sin(x + event.xdata))
        ax.draw_artist(ax.patch)
        ax.draw_artist(line)
        fig.canvas.blit(ax.bbox)

fig.canvas.mpl_connect('button_press_event', on_click)
plt.show()
Output:
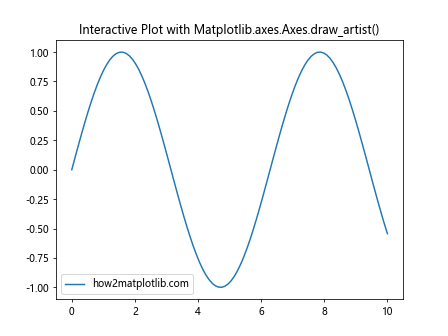
In this interactive plot, clicking on the axes will shift the sine wave based on the x-coordinate of the click. We use Matplotlib.axes.Axes.draw_artist() to efficiently update only the line and axes patch.
Performance Optimization with Matplotlib.axes.Axes.draw_artist()
One of the key benefits of using Matplotlib.axes.Axes.draw_artist() is performance optimization. By redrawing only the necessary elements, you can significantly reduce the computational load, especially in complex plots or animations.
Here’s an example that demonstrates the performance difference:
import matplotlib.pyplot as plt
import numpy as np
import time

fig, (ax1, ax2) = plt.subplots(1, 2, figsize=(12, 5))
x = np.linspace(0, 10, 1000)
line1, = ax1.plot(x, np.sin(x), label='how2matplotlib.com')
line2, = ax2.plot(x, np.sin(x), label='how2matplotlib.com')

ax1.set_title('Without draw_artist()')
ax2.set_title('With draw_artist()')
ax1.legend()
ax2.legend()

start_time = time.time()
for i in range(100):
    line1.set_ydata(np.sin(x + i/10))
    ax1.figure.canvas.draw()
without_time = time.time() - start_time

start_time = time.time()
for i in range(100):
    line2.set_ydata(np.sin(x + i/10))
    ax2.draw_artist(ax2.patch)
    ax2.draw_artist(line2)
    fig.canvas.blit(ax2.bbox)
with_time = time.time() - start_time

print(f"Time without draw_artist(): {without_time:.2f}s")
print(f"Time with draw_artist(): {with_time:.2f}s")

plt.show()
Output:
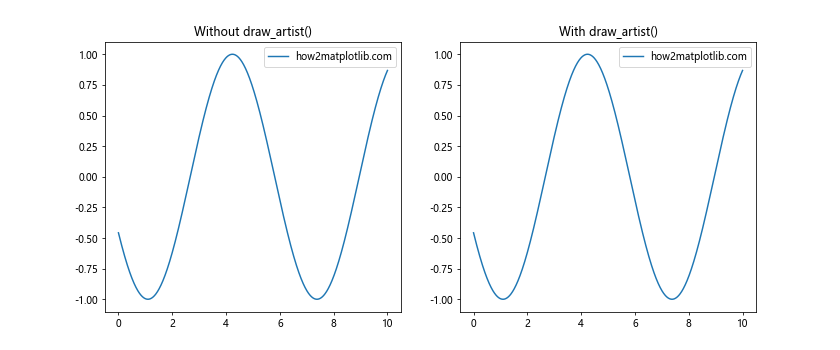
This example compares the time taken to update a plot 100 times with and without using Matplotlib.axes.Axes.draw_artist(). The performance difference can be significant, especially for more complex plots or higher update frequencies.
Advanced Usage of Matplotlib.axes.Axes.draw_artist()
Now that we’ve covered the basics, let’s explore some more advanced uses of Matplotlib.axes.Axes.draw_artist().
Multiple Artists
Matplotlib.axes.Axes.draw_artist() can be used with multiple artists in the same plot. Here’s an example:
import matplotlib.pyplot as plt
import numpy as np

fig, ax = plt.subplots()
x = np.linspace(0, 10, 100)
line1, = ax.plot(x, np.sin(x), label='Sin - how2matplotlib.com')
line2, = ax.plot(x, np.cos(x), label='Cos - how2matplotlib.com')
text = ax.text(5, 0, 'how2matplotlib.com', ha='center')

ax.set_title('Multiple Artists with Matplotlib.axes.Axes.draw_artist()')
ax.legend()

def update():
    line1.set_ydata(np.sin(x + np.random.rand()))
    line2.set_ydata(np.cos(x + np.random.rand()))
    text.set_position((np.random.rand() * 10, np.random.rand() * 2 - 1))
    ax.draw_artist(ax.patch)
    ax.draw_artist(line1)
    ax.draw_artist(line2)
    ax.draw_artist(text)
    fig.canvas.blit(ax.bbox)

# Simulate updates
for _ in range(10):
    update()
    plt.pause(0.5)

plt.show()
In this example, we’re using Matplotlib.axes.Axes.draw_artist() to update two lines and a text object independently.
Custom Artists
Matplotlib.axes.Axes.draw_artist() can also be used with custom artists. Here’s an example using a custom patch:
import matplotlib.pyplot as plt
import matplotlib.patches as patches
import numpy as np

fig, ax = plt.subplots()

custom_patch = patches.Circle((0.5, 0.5), 0.2, fc='r', label='how2matplotlib.com')
ax.add_patch(custom_patch)

ax.set_title('Custom Artist with Matplotlib.axes.Axes.draw_artist()')
ax.legend()

def update():
    custom_patch.center = (np.random.rand(), np.random.rand())
    ax.draw_artist(ax.patch)
    ax.draw_artist(custom_patch)
    fig.canvas.blit(ax.bbox)

# Simulate updates
for _ in range(10):
    update()
    plt.pause(0.5)

plt.show()
This example demonstrates how to use Matplotlib.axes.Axes.draw_artist() with a custom Circle patch, moving it randomly around the plot.
Combining Matplotlib.axes.Axes.draw_artist() with Other Matplotlib Features
Matplotlib.axes.Axes.draw_artist() can be combined with other Matplotlib features to create more complex and interactive visualizations. Let’s explore some of these combinations.
Matplotlib.axes.Axes.draw_artist() with Subplots
You can use Matplotlib.axes.Axes.draw_artist() with subplots to update multiple plots efficiently:
import matplotlib.pyplot as plt
import numpy as np

fig, (ax1, ax2) = plt.subplots(1, 2, figsize=(12, 5))
x = np.linspace(0, 10, 100)
line1, = ax1.plot(x, np.sin(x), label='Sin - how2matplotlib.com')
line2, = ax2.plot(x, np.cos(x), label='Cos - how2matplotlib.com')

ax1.set_title('Subplot 1')
ax2.set_title('Subplot 2')
ax1.legend()
ax2.legend()

def update():
    line1.set_ydata(np.sin(x + np.random.rand()))
    line2.set_ydata(np.cos(x + np.random.rand()))
    ax1.draw_artist(ax1.patch)
    ax1.draw_artist(line1)
    ax2.draw_artist(ax2.patch)
    ax2.draw_artist(line2)
    fig.canvas.blit(ax1.bbox)
    fig.canvas.blit(ax2.bbox)

# Simulate updates
for _ in range(10):
    update()
    plt.pause(0.5)

plt.show()
This example shows how to use Matplotlib.axes.Axes.draw_artist() to update two separate subplots efficiently.
Matplotlib.axes.Axes.draw_artist() with Colormaps
You can also use Matplotlib.axes.Axes.draw_artist() with colormaps for more dynamic visualizations:
import matplotlib.pyplot as plt
import numpy as np

fig, ax = plt.subplots()
x = np.linspace(0, 10, 100)
y = np.linspace(0, 10, 100)
X, Y = np.meshgrid(x, y)
Z = np.sin(X) * np.cos(Y)

im = ax.imshow(Z, cmap='viridis', extent=[0, 10, 0, 10])
ax.set_title('Colormap with Matplotlib.axes.Axes.draw_artist()')
plt.colorbar(im, label='how2matplotlib.com')

def update():
    Z = np.sin(X + np.random.rand()) * np.cos(Y + np.random.rand())
    im.set_array(Z)
    ax.draw_artist(ax.patch)
    ax.draw_artist(im)
    fig.canvas.blit(ax.bbox)

# Simulate updates
for _ in range(10):
    update()
    plt.pause(0.5)

plt.show()
This example demonstrates how to use Matplotlib.axes.Axes.draw_artist() with a colormap, updating the data dynamically.
Best Practices for Using Matplotlib.axes.Axes.draw_artist()
When working with Matplotlib.axes.Axes.draw_artist(), there are several best practices to keep in mind:
- Only redraw what’s necessary: Use Matplotlib.axes.Axes.draw_artist() only for the artists that have changed.
- Use blitting: Combine Matplotlib.axes.Axes.draw_artist() with
canvas.blit()for optimal performance. - Clear the background: If you’re updating the entire axes, remember to redraw the axes patch first.
- Be mindful of z-order: Draw artists in the correct order to ensure proper layering.
Here’s an example that demonstrates these best practices:
import matplotlib.pyplot as plt
import numpy as np

fig, ax = plt.subplots()
x = np.linspace(0, 10, 100)
background = ax.plot(x, np.zeros_like(x), 'k--', label='Background - how2matplotlib.com')
line, = ax.plot(x, np.sin(x), label='Data - how2matplotlib.com')
text = ax.text(5, 0.5, 'how2matplotlib.com', ha='center')

ax.set_title('Best Practices for Matplotlib.axes.Axes.draw_artist()')
ax.legend()

def update():
    line.set_ydata(np.sin(x + np.random.rand()))
    text.set_position((np.random.rand() * 10, np.random.rand()))

    # Clear the background
    ax.draw_artist(ax.patch)

    # Redraw in the correct order
    for artist in background + [line, text]:
        ax.draw_artist(artist)

    # Use blitting for efficiency
    fig.canvas.blit(ax.bbox)

# Simulate updates
for _ in range(10):
    update()
    plt.pause(0.5)

plt.show()
This example demonstrates the best practices for using Matplotlib.axes.Axes.draw_artist(), including clearing the background, drawing in the correct order, and using blitting for efficiency.
Troubleshooting Common Issues with Matplotlib.axes.Axes.draw_artist()
While Matplotlib.axes.Axes.draw_artist() is a powerful tool, you may encounter some issues when using it. Here are some common problems and their solutions:
1. Artists Not Updating
If your artists aren’t updating when you use Matplotlib.axes.Axes.draw_artist(), make sure you’re calling canvas.blit() after drawing the artists:
import matplotlib.pyplot as plt
import numpy as np

fig, ax = plt.subplots()
x = np.linspace(0, 10, 100)
line, = ax.plot(x, np.sin(x), label='how2matplotlib.com')

ax.set_title('Troubleshooting Matplotlib.axes.Axes.draw_artist()')
ax.legend()

def update():
    line.set_ydata(np.sin(x + np.random.rand()))
    ax.draw_artist(ax.patch)
    ax.draw_artist(line)
    fig.canvas.blit(ax.bbox)  # Don't forget this line!

## Simulate updates
for _ in range(10):
    update()
    plt.pause(0.5)

plt.show()
2. Z-Order Issues
If some artists are being drawn over others incorrectly, pay attention to the order in which you’re calling Matplotlib.axes.Axes.draw_artist():
import matplotlib.pyplot as plt
import numpy as np

fig, ax = plt.subplots()
x = np.linspace(0, 10, 100)
background = ax.fill_between(x, -1, 1, color='lightgray', label='Background - how2matplotlib.com')
line, = ax.plot(x, np.sin(x), label='Data - how2matplotlib.com')

ax.set_title('Z-Order with Matplotlib.axes.Axes.draw_artist()')
ax.legend()

def update():
    line.set_ydata(np.sin(x + np.random.rand()))
    ax.draw_artist(ax.patch)
    ax.draw_artist(background)  # Draw background first
    ax.draw_artist(line)  # Then draw line
    fig.canvas.blit(ax.bbox)

# Simulate updates
for _ in range(10):
    update()
    plt.pause(0.5)

plt.show()
3. Performance Issues
If you’re experiencing performance issues, make sure you’re only redrawing the necessary artists:
import matplotlib.pyplot as plt
import numpy as np

fig, ax = plt.subplots()
x = np.linspace(0, 10, 1000)
static_line, = ax.plot(x, np.cos(x), 'r--', label='Static - how2matplotlib.com')
dynamic_line, = ax.plot(x, np.sin(x), label='Dynamic - how2matplotlib.com')

ax.set_title('Performance Optimization with Matplotlib.axes.Axes.draw_artist()')
ax.legend()

def update():
    dynamic_line.set_ydata(np.sin(x + np.random.rand()))
    ax.draw_artist(ax.patch)
    ax.draw_artist(dynamic_line)  # Only redraw the dynamic line
    fig.canvas.blit(ax.bbox)

# Simulate updates
for _ in range(100):
    update()
    plt.pause(0.01)

plt.show()
Advanced Techniques with Matplotlib.axes.Axes.draw_artist()
Now that we’ve covered the basics and troubleshooting, let’s explore some advanced techniques using Matplotlib.axes.Axes.draw_artist().
Combining with Event Handling
You can combine Matplotlib.axes.Axes.draw_artist() with Matplotlib’s event handling system for interactive visualizations:
import matplotlib.pyplot as plt
import numpy as np

fig, ax = plt.subplots()
x = np.linspace(0, 10, 100)
line, = ax.plot(x, np.sin(x), label='how2matplotlib.com')
point, = ax.plot([], [], 'ro')

ax.set_title('Interactive Plot with Matplotlib.axes.Axes.draw_artist()')
ax.legend()

def on_move(event):
    if event.inaxes == ax:
        point.set_data(event.xdata, np.sin(event.xdata))
        ax.draw_artist(ax.patch)
        ax.draw_artist(line)
        ax.draw_artist(point)
        fig.canvas.blit(ax.bbox)

fig.canvas.mpl_connect('motion_notify_event', on_move)
plt.show()
Output:
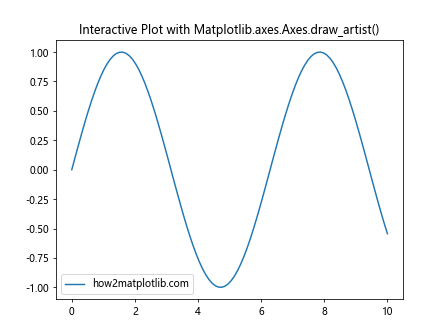
This example creates an interactive plot where a red point follows the sine curve as you move your mouse.
Animated Scatter Plots
Matplotlib.axes.Axes.draw_artist() can be used to create efficient animated scatter plots:
import matplotlib.pyplot as plt
import numpy as np

fig, ax = plt.subplots()
n = 100
x = np.random.rand(n)
y = np.random.rand(n)
colors = np.random.rand(n)
sizes = 1000 * np.random.rand(n)

scatter = ax.scatter(x, y, c=colors, s=sizes, alpha=0.5, label='how2matplotlib.com')

ax.set_title('Animated Scatter Plot with Matplotlib.axes.Axes.draw_artist()')
ax.legend()

def update():
    offsets = np.column_stack([x + np.random.randn(n) * 0.1, y + np.random.randn(n) * 0.1])
    scatter.set_offsets(offsets)
    ax.draw_artist(ax.patch)
    ax.draw_artist(scatter)
    fig.canvas.blit(ax.bbox)

# Simulate updates
for _ in range(50):
    update()
    plt.pause(0.1)

plt.show()
This example creates an animated scatter plot where the points move randomly.
Real-time Data Visualization
Matplotlib.axes.Axes.draw_artist() is particularly useful for real-time data visualization. Here’s an example simulating real-time data:
import matplotlib.pyplot as plt
import numpy as np
import time

fig, ax = plt.subplots()
x = np.linspace(0, 10, 100)
line, = ax.plot(x, np.zeros_like(x), label='how2matplotlib.com')

ax.set_ylim(-1, 1)
ax.set_title('Real-time Data Visualization with Matplotlib.axes.Axes.draw_artist()')
ax.legend()

start_time = time.time()

def update():
    current_time = time.time() - start_time
    y = np.sin(x - current_time)
    line.set_ydata(y)
    ax.draw_artist(ax.patch)
    ax.draw_artist(line)
    fig.canvas.blit(ax.bbox)

# Simulate real-time updates
for _ in range(200):
    update()
    plt.pause(0.05)

plt.show()
This example simulates real-time data by updating a sine wave based on the elapsed time.
Comparing Matplotlib.axes.Axes.draw_artist() with Other Matplotlib Methods
To fully appreciate the power of Matplotlib.axes.Axes.draw_artist(), it’s useful to compare it with other Matplotlib methods for updating plots.
draw_artist() vs. set_data()
While set_data() is commonly used to update line plots, Matplotlib.axes.Axes.draw_artist() can be more efficient for frequent updates:
import matplotlib.pyplot as plt
import numpy as np
import time

fig, (ax1, ax2) = plt.subplots(1, 2, figsize=(12, 5))
x = np.linspace(0, 10, 1000)
line1, = ax1.plot(x, np.sin(x), label='set_data() - how2matplotlib.com')
line2, = ax2.plot(x, np.sin(x), label='draw_artist() - how2matplotlib.com')

ax1.set_title('Using set_data()')
ax2.set_title('Using draw_artist()')
ax1.legend()
ax2.legend()

def update_set_data():
    line1.set_data(x, np.sin(x + np.random.rand()))
    fig.canvas.draw()

def update_draw_artist():
    line2.set_ydata(np.sin(x + np.random.rand()))
    ax2.draw_artist(ax2.patch)
    ax2.draw_artist(line2)
    fig.canvas.blit(ax2.bbox)

# Compare performance
n_updates = 100

start_time = time.time()
for _ in range(n_updates):
    update_set_data()
set_data_time = time.time() - start_time

start_time = time.time()
for _ in range(n_updates):
    update_draw_artist()
draw_artist_time = time.time() - start_time

print(f"Time with set_data(): {set_data_time:.2f}s")
print(f"Time with draw_artist(): {draw_artist_time:.2f}s")

plt.show()
Output:
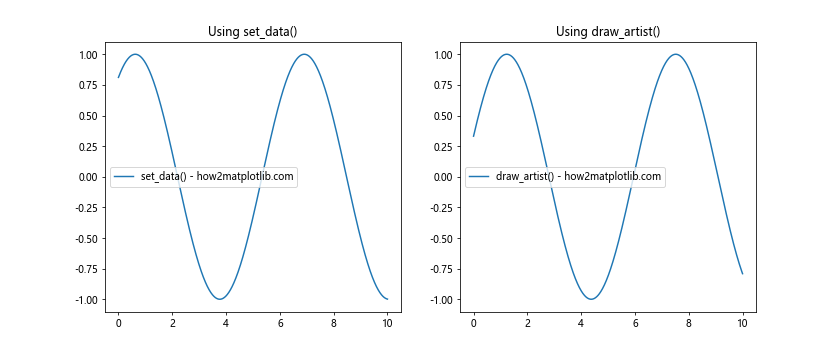
This example compares the performance of set_data() with Matplotlib.axes.Axes.draw_artist() for updating a line plot.
draw_artist() vs. animation.FuncAnimation()
While animation.FuncAnimation() is a powerful tool for creating animations, Matplotlib.axes.Axes.draw_artist() can offer more fine-grained control:
import matplotlib.pyplot as plt
import numpy as np
from matplotlib.animation import FuncAnimation

fig, (ax1, ax2) = plt.subplots(1, 2, figsize=(12, 5))
x = np.linspace(0, 10, 100)
line1, = ax1.plot(x, np.sin(x), label='FuncAnimation - how2matplotlib.com')
line2, = ax2.plot(x, np.sin(x), label='draw_artist() - how2matplotlib.com')

ax1.set_title('Using FuncAnimation')
ax2.set_title('Using draw_artist()')
ax1.legend()
ax2.legend()

def update_func_animation(frame):
    line1.set_ydata(np.sin(x + frame / 10))
    return line1,

def update_draw_artist():
    line2.set_ydata(np.sin(x + np.random.rand()))
    ax2.draw_artist(ax2.patch)
    ax2.draw_artist(line2)
    fig.canvas.blit(ax2.bbox)

ani = FuncAnimation(fig, update_func_animation, frames=100, interval=50, blit=True)

# Simulate updates for draw_artist
for _ in range(100):
    update_draw_artist()
    plt.pause(0.05)

plt.show()
This example demonstrates the difference between using FuncAnimation and Matplotlib.axes.Axes.draw_artist() for creating animations.
Conclusion
Matplotlib.axes.Axes.draw_artist() is a powerful tool in the Matplotlib arsenal, offering fine-grained control over plot updates and significant performance improvements for interactive visualizations. By selectively redrawing only the necessary elements, it allows for efficient updates of complex plots and smooth animations.
Throughout this comprehensive guide, we’ve explored various aspects of Matplotlib.axes.Axes.draw_artist():
- We started with the basics, understanding when and how to use Matplotlib.axes.Axes.draw_artist().
- We delved into more advanced usage, including working with multiple artists and custom patches.
- We combined Matplotlib.axes.Axes.draw_artist() with other Matplotlib features like subplots and colormaps.
- We discussed best practices and troubleshooting common issues.
- We explored advanced techniques, including event handling and real-time data visualization.
- Finally, we compared Matplotlib.axes.Axes.draw_artist() with other Matplotlib methods for updating plots.
By mastering Matplotlib.axes.Axes.draw_artist(), you can create more efficient, responsive, and interactive visualizations in Python. Whether you’re working on real-time data visualization, complex animations, or performance-critical applications, Matplotlib.axes.Axes.draw_artist() is a valuable tool to have in your data visualization toolkit.
Remember, while Matplotlib.axes.Axes.draw_artist() offers significant advantages in many scenarios, it’s not always the best choice for every situation. Simple static plots or infrequently updated visualizations may not benefit significantly from using Matplotlib.axes.Axes.draw_artist(). As with any tool, it’s important to understand its strengths and use it appropriately.