How to Make Filled Polygons Between Two Curves in Python Using Matplotlib
Make filled polygons between two curves in Python using Matplotlib is a powerful technique for visualizing data and creating eye-catching plots. This article will explore various methods and techniques to achieve this effect, providing detailed explanations and examples along the way. Whether you’re a beginner or an experienced data scientist, this guide will help you master the art of creating filled polygons between curves using Matplotlib.
Understanding the Basics of Filled Polygons Between Curves
Before we dive into the specifics of how to make filled polygons between two curves in Python using Matplotlib, let’s first understand what this concept means and why it’s useful.
When we talk about making filled polygons between two curves, we’re referring to the process of creating a shaded area between two lines or curves on a plot. This technique is particularly useful for:
- Highlighting the difference between two data sets
- Visualizing confidence intervals or error ranges
- Creating area charts or stacked area charts
- Emphasizing specific regions of interest in a plot
Matplotlib, a popular plotting library in Python, provides several functions and methods that allow us to create these filled polygons easily and efficiently.
Let’s start with a simple example to illustrate the concept:
import matplotlib.pyplot as plt
import numpy as np

# Generate data for two curves
x = np.linspace(0, 10, 100)
y1 = np.sin(x)
y2 = np.cos(x)

# Create the plot
plt.figure(figsize=(10, 6))
plt.plot(x, y1, label='Sine')
plt.plot(x, y2, label='Cosine')
plt.fill_between(x, y1, y2, alpha=0.3)
plt.title('Make filled polygons between two curves in Python using Matplotlib')
plt.xlabel('X-axis')
plt.ylabel('Y-axis')
plt.legend()
plt.text(5, 0, 'how2matplotlib.com', ha='center', va='center', fontsize=12, alpha=0.5)
plt.show()
Output:
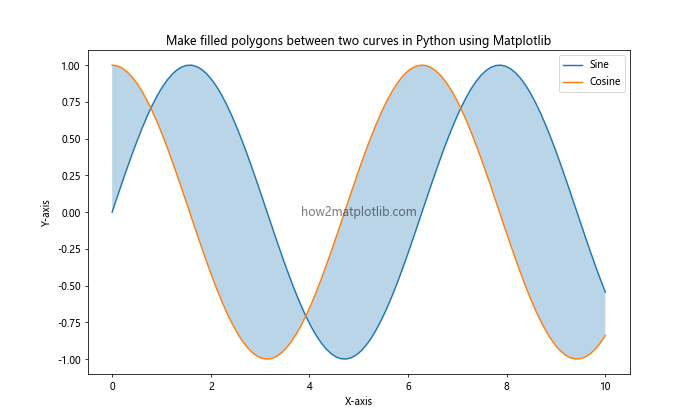
In this example, we’ve created two curves (sine and cosine) and filled the area between them using the fill_between() function. This is the most basic way to make filled polygons between two curves in Python using Matplotlib.
Using fill_between() for Simple Polygons
The fill_between() function is the primary tool for creating filled polygons between curves in Matplotlib. Let’s explore its usage in more detail.
Basic Syntax
The basic syntax of fill_between() is as follows:
plt.fill_between(x, y1, y2, **kwargs)
x: The x-coordinates of the curvesy1: The y-coordinates of the first curvey2: The y-coordinates of the second curve**kwargs: Additional keyword arguments for customization
Let’s see a more detailed example:
import matplotlib.pyplot as plt
import numpy as np

# Generate data
x = np.linspace(0, 10, 100)
y1 = 2 * np.sin(x) + 5
y2 = np.sin(x) + 3

# Create the plot
plt.figure(figsize=(10, 6))
plt.plot(x, y1, label='Curve 1')
plt.plot(x, y2, label='Curve 2')
plt.fill_between(x, y1, y2, alpha=0.5, color='green', label='Filled Area')
plt.title('Make filled polygons between two curves in Python using Matplotlib')
plt.xlabel('X-axis')
plt.ylabel('Y-axis')
plt.legend()
plt.text(5, 4, 'how2matplotlib.com', ha='center', va='center', fontsize=12, alpha=0.5)
plt.show()
Output:
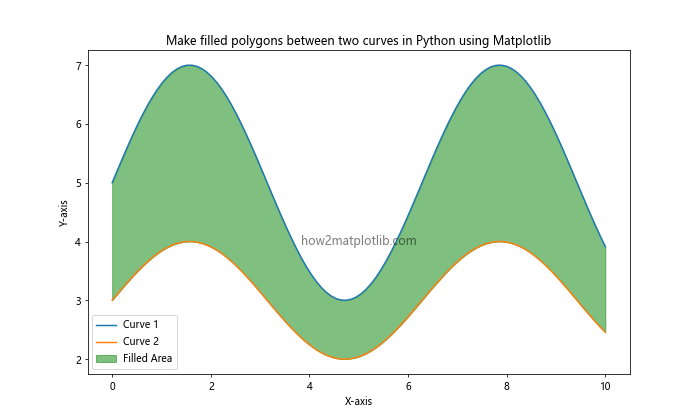
In this example, we’ve added more customization to the filled area by specifying the color and adding a label for the legend.
Customizing the Filled Area
When you make filled polygons between two curves in Python using Matplotlib, you have several options for customizing the appearance of the filled area:
- Color: Use the
colorparameter to set the fill color. - Alpha: Adjust the transparency with the
alphaparameter. - Hatch: Add patterns to the fill using the
hatchparameter. - Interpolate: Smooth the fill with the
interpolateparameter.
Let’s see these in action:
import matplotlib.pyplot as plt
import numpy as np

# Generate data
x = np.linspace(0, 10, 100)
y1 = 2 * np.sin(x) + 5
y2 = np.sin(x) + 3

# Create the plot
plt.figure(figsize=(12, 8))

# Basic fill
plt.subplot(2, 2, 1)
plt.fill_between(x, y1, y2, alpha=0.3, label='Basic')
plt.title('Basic Fill')

# Custom color
plt.subplot(2, 2, 2)
plt.fill_between(x, y1, y2, color='purple', alpha=0.3, label='Custom Color')
plt.title('Custom Color')

# Hatch pattern
plt.subplot(2, 2, 3)
plt.fill_between(x, y1, y2, hatch='///', alpha=0.3, label='Hatch')
plt.title('Hatch Pattern')

# Interpolated
plt.subplot(2, 2, 4)
plt.fill_between(x, y1, y2, interpolate=True, alpha=0.3, label='Interpolated')
plt.title('Interpolated')

plt.tight_layout()
plt.suptitle('Make filled polygons between two curves in Python using Matplotlib', fontsize=16)
plt.text(5, 2, 'how2matplotlib.com', ha='center', va='center', fontsize=12, alpha=0.5)
plt.show()
Output:
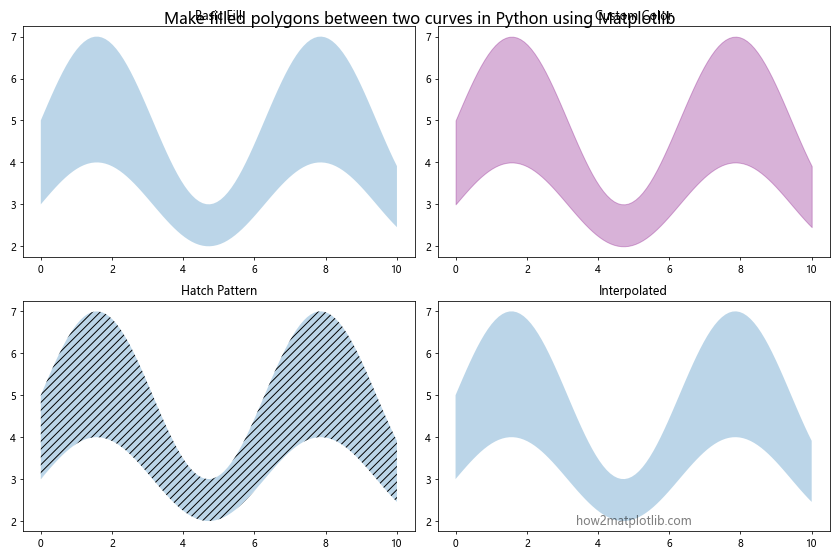
This example demonstrates various ways to customize the filled area between curves, showcasing the flexibility of Matplotlib in creating visually appealing plots.
Advanced Techniques for Filled Polygons
Now that we’ve covered the basics of how to make filled polygons between two curves in Python using Matplotlib, let’s explore some more advanced techniques.
Conditional Filling
Sometimes, you may want to fill the area between curves only when certain conditions are met. Matplotlib’s fill_between() function allows for this using the where parameter.
import matplotlib.pyplot as plt
import numpy as np

# Generate data
x = np.linspace(0, 10, 100)
y1 = 2 * np.sin(x) + 5
y2 = np.sin(x) + 3

# Create the plot
plt.figure(figsize=(10, 6))
plt.plot(x, y1, label='Curve 1')
plt.plot(x, y2, label='Curve 2')

# Fill only where y1 > y2
plt.fill_between(x, y1, y2, where=(y1 > y2), alpha=0.5, color='green', label='y1 > y2')

# Fill only where y1 < y2
plt.fill_between(x, y1, y2, where=(y1 < y2), alpha=0.5, color='red', label='y1 < y2')

plt.title('Make filled polygons between two curves in Python using Matplotlib: Conditional Filling')
plt.xlabel('X-axis')
plt.ylabel('Y-axis')
plt.legend()
plt.text(5, 4, 'how2matplotlib.com', ha='center', va='center', fontsize=12, alpha=0.5)
plt.show()
Output:
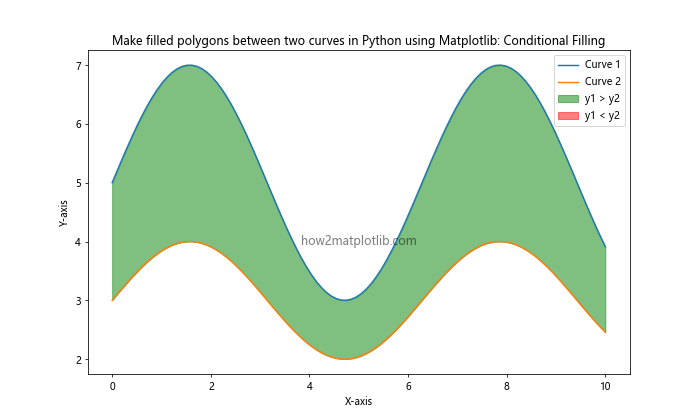
This example demonstrates how to conditionally fill areas based on the relationship between the two curves.
Multiple Filled Areas
You can create multiple filled areas in a single plot to represent different categories or ranges. This is particularly useful for stacked area charts or visualizing multiple data sets.
import matplotlib.pyplot as plt
import numpy as np

# Generate data
x = np.linspace(0, 10, 100)
y1 = np.sin(x) + 5
y2 = np.sin(x) + 3
y3 = np.sin(x) + 1

# Create the plot
plt.figure(figsize=(10, 6))

plt.fill_between(x, y1, y2, alpha=0.3, color='red', label='Area 1')
plt.fill_between(x, y2, y3, alpha=0.3, color='green', label='Area 2')
plt.fill_between(x, y3, alpha=0.3, color='blue', label='Area 3')

plt.title('Make filled polygons between two curves in Python using Matplotlib: Multiple Areas')
plt.xlabel('X-axis')
plt.ylabel('Y-axis')
plt.legend()
plt.text(5, 3, 'how2matplotlib.com', ha='center', va='center', fontsize=12, alpha=0.5)
plt.show()
Output:
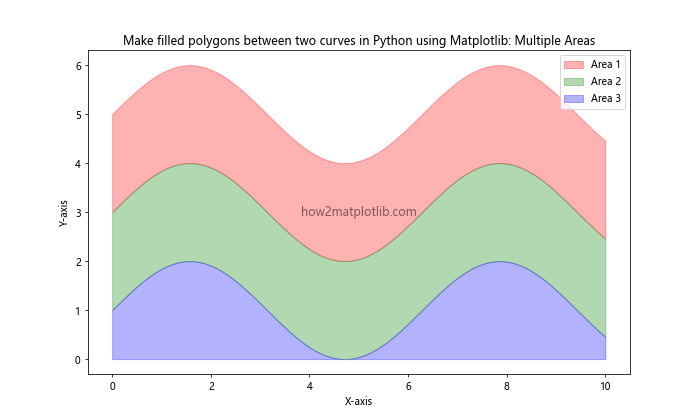
This example shows how to create a stacked area chart by filling multiple areas between curves.
Gradient Fills
To create more visually appealing plots, you can use gradient fills between curves. This can be achieved using the LinearSegmentedColormap from Matplotlib's colors module.
import matplotlib.pyplot as plt
import numpy as np
from matplotlib.colors import LinearSegmentedColormap

# Generate data
x = np.linspace(0, 10, 100)
y1 = 2 * np.sin(x) + 5
y2 = np.sin(x) + 3

# Create a custom colormap
colors = ['#ff9999', '#ff3333']
n_bins = 100
cmap = LinearSegmentedColormap.from_list('custom', colors, N=n_bins)

# Create the plot
plt.figure(figsize=(10, 6))
plt.plot(x, y1, color='red', label='Curve 1')
plt.plot(x, y2, color='blue', label='Curve 2')

# Create gradient fill
for i in range(n_bins):
    y_top = y1 - (y1 - y2) * i / n_bins
    y_bottom = y1 - (y1 - y2) * (i + 1) / n_bins
    plt.fill_between(x, y_top, y_bottom, color=cmap(i / n_bins), alpha=0.1)

plt.title('Make filled polygons between two curves in Python using Matplotlib: Gradient Fill')
plt.xlabel('X-axis')
plt.ylabel('Y-axis')
plt.legend()
plt.text(5, 4, 'how2matplotlib.com', ha='center', va='center', fontsize=12, alpha=0.5)
plt.show()
Output:
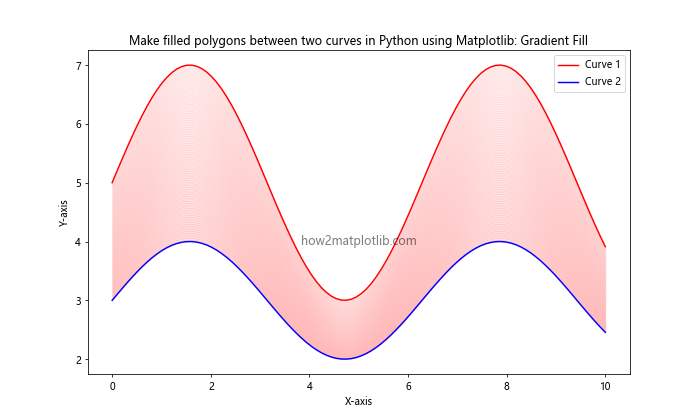
This example demonstrates how to create a gradient fill between two curves, adding depth and visual interest to the plot.
Practical Applications of Filled Polygons Between Curves
Now that we've explored various techniques to make filled polygons between two curves in Python using Matplotlib, let's look at some practical applications of this visualization technique.
Visualizing Confidence Intervals
Filled polygons are often used to represent confidence intervals or error ranges in statistical analysis. Here's an example of how to visualize a confidence interval:
import matplotlib.pyplot as plt
import numpy as np

# Generate data
x = np.linspace(0, 10, 100)
y = np.sin(x) + np.random.normal(0, 0.1, 100)
y_mean = np.sin(x)
y_std = np.std(y - y_mean)

# Create the plot
plt.figure(figsize=(10, 6))
plt.plot(x, y, 'o', alpha=0.5, label='Data')
plt.plot(x, y_mean, 'r-', label='Mean')
plt.fill_between(x, y_mean - y_std, y_mean + y_std, alpha=0.3, label='Confidence Interval')

plt.title('Make filled polygons between two curves in Python using Matplotlib: Confidence Interval')
plt.xlabel('X-axis')
plt.ylabel('Y-axis')
plt.legend()
plt.text(5, 0, 'how2matplotlib.com', ha='center', va='center', fontsize=12, alpha=0.5)
plt.show()
Output:
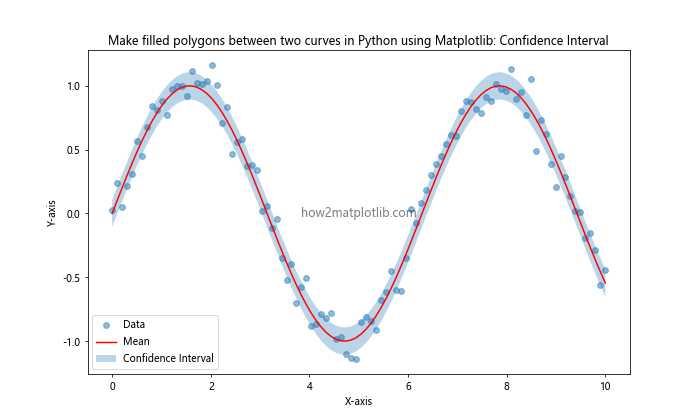
This example shows how to visualize a confidence interval around a mean curve, which is a common application in statistical analysis and data science.
Creating Area Charts
Area charts are useful for visualizing cumulative data or showing the relative proportion of different categories over time. Here's an example of how to create a simple area chart:
import matplotlib.pyplot as plt
import numpy as np

# Generate data
x = np.linspace(0, 10, 100)
y1 = np.exp(-x/10) * np.sin(x)
y2 = np.exp(-x/10) * np.cos(x)
y3 = np.exp(-x/5)

# Create the plot
plt.figure(figsize=(10, 6))

plt.fill_between(x, 0, y1, alpha=0.3, label='Category 1')
plt.fill_between(x, y1, y1+y2, alpha=0.3, label='Category 2')
plt.fill_between(x, y1+y2, y1+y2+y3, alpha=0.3, label='Category 3')

plt.title('Make filled polygons between two curves in Python using Matplotlib: Area Chart')
plt.xlabel('X-axis')
plt.ylabel('Y-axis')
plt.legend()
plt.text(5, 0.5, 'how2matplotlib.com', ha='center', va='center', fontsize=12, alpha=0.5)
plt.show()
Output:
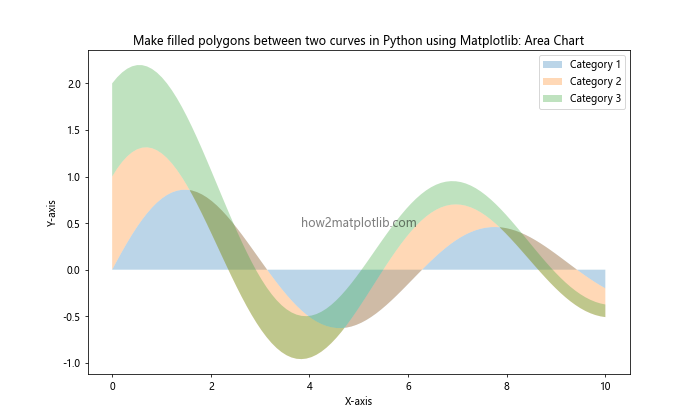
This example demonstrates how to create a stacked area chart, which is useful for showing the composition of a whole over time.
Highlighting Regions of Interest
Filled polygons can be used to highlight specific regions of interest in a plot. This is particularly useful when you want to draw attention to certain areas or time periods in your data.
import matplotlib.pyplot as plt
import numpy as np

# Generate data
x = np.linspace(0, 10, 100)
y = np.sin(x) * np.exp(-x/10)

# Create the plot
plt.figure(figsize=(10, 6))
plt.plot(x, y, label='Data')

# Highlight regions of interest
plt.fill_between(x, y, where=(x > 2) & (x < 4), alpha=0.3, color='green', label='Region 1')
plt.fill_between(x, y, where=(x > 6) & (x < 8), alpha=0.3, color='red', label='Region 2')

plt.title('Make filled polygons between two curves in Python using Matplotlib: Highlighting Regions')
plt.xlabel('X-axis')
plt.ylabel('Y-axis')
plt.legend()
plt.text(5, 0, 'how2matplotlib.com', ha='center', va='center', fontsize=12, alpha=0.5)
plt.show()
Output:
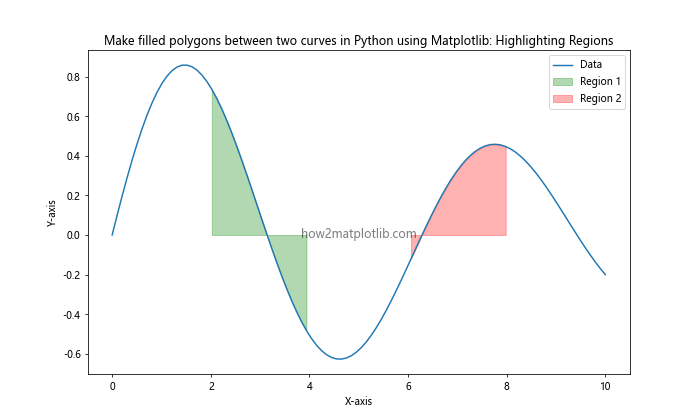
This example shows how to highlight specific regions of a curve, which can be useful for emphasizing important features or events in your data.
Advanced Customization Techniques
As we continue to explore how to make filled polygons between two curves in Python using Matplotlib, let's delve into some advanced customization techniques that can enhance the visual appeal and informativeness of your plots.
Custom Colormaps for Gradient Fills
While we've already seen how to create a simple gradient fill, you can take this further by creating custom colormaps. This allows for more complex color transitions and can be particularly effective for visualizing data with multiple dimensions.
import matplotlib.pyplot as plt
import numpy as np
from matplotlib.colors import LinearSegmentedColormap

# Generate data
x = np.linspace(0, 10, 100)
y1 = 2 * np.sin(x) + 5
y2 = np.sin(x) + 3

# Create a custom colormap
colors = ['#ff9999', '#ffcc99', '#99ff99', '#99ccff']
n_bins = 100
cmap = LinearSegmentedColormap.from_list('custom', colors, N=n_bins)

# Create the plot
plt.figure(figsize=(10, 6))
plt.plot(x, y1, color='red', label='Curve 1')
plt.plot(x, y2, color='blue', label='Curve 2')

# Create gradient fill
for i in range(n_bins):
    y_top = y1 - (y1 - y2) * i / n_bins
    y_bottom = y1 - (y1 - y2) * (i + 1) / n_bins
    plt.fill_between(x, y_top, y_bottom, color=cmap(i / n_bins), alpha=0.1)

plt.title('Make filled polygons between two curves in Python using Matplotlib: Custom Colormap')
plt.xlabel('X-axis')
plt.ylabel('Y-axis')
plt.legend()
plt.text(5, 4, 'how2matplotlib.com', ha='center', va='center', fontsize=12, alpha=0.5)
plt.show()
Output:
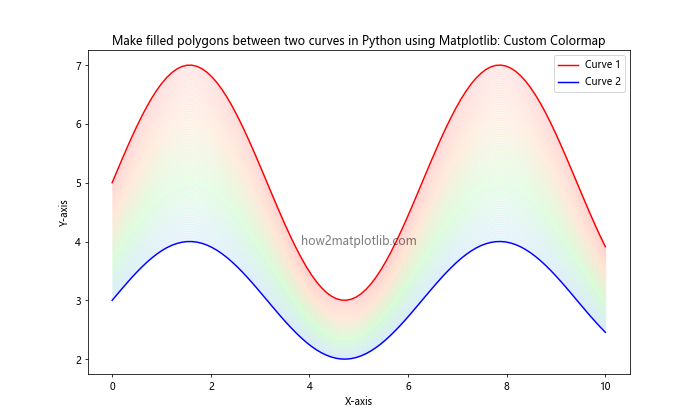
This example demonstrates how to create a custom colormap for a more complex gradient fill between two curves.
Best Practices for Making Filled Polygons Between Curves
When you make filled polygons between two curves in Python using Matplotlib, it's important to follow some best practices to ensure your visualizations are effective and informative:
- Choose appropriate colors: Select colors that complement each other and are easy to distinguish. Consider using color-blind friendly palettes.
Use transparency wisely: Adjust the alpha value to ensure the fill doesn't obscure important details of the curves.
Label your axes and include a legend: Always provide clear labels for your axes and include a legend to explain what each curve and filled area represents.
Consider your audience: Tailor the complexity of your visualization to your audience's familiarity with the subject matter.
Don't overload your plot: While filled polygons can be informative, too many on one plot can be confusing. Stick to a few key areas if possible.
Use consistent styling: If you're creating multiple plots, maintain consistent styling across them for easier comparison.
Provide context: Include titles and annotations to give context to your visualization.
Let's see an example that incorporates these best practices: